






The global leader in enterprise social media management
For over a decade, Sprinklr Social has helped the world’s biggest brands reimagine social media as a growth driver with a unified platform, industry-leading AI and enterprise-grade scale.



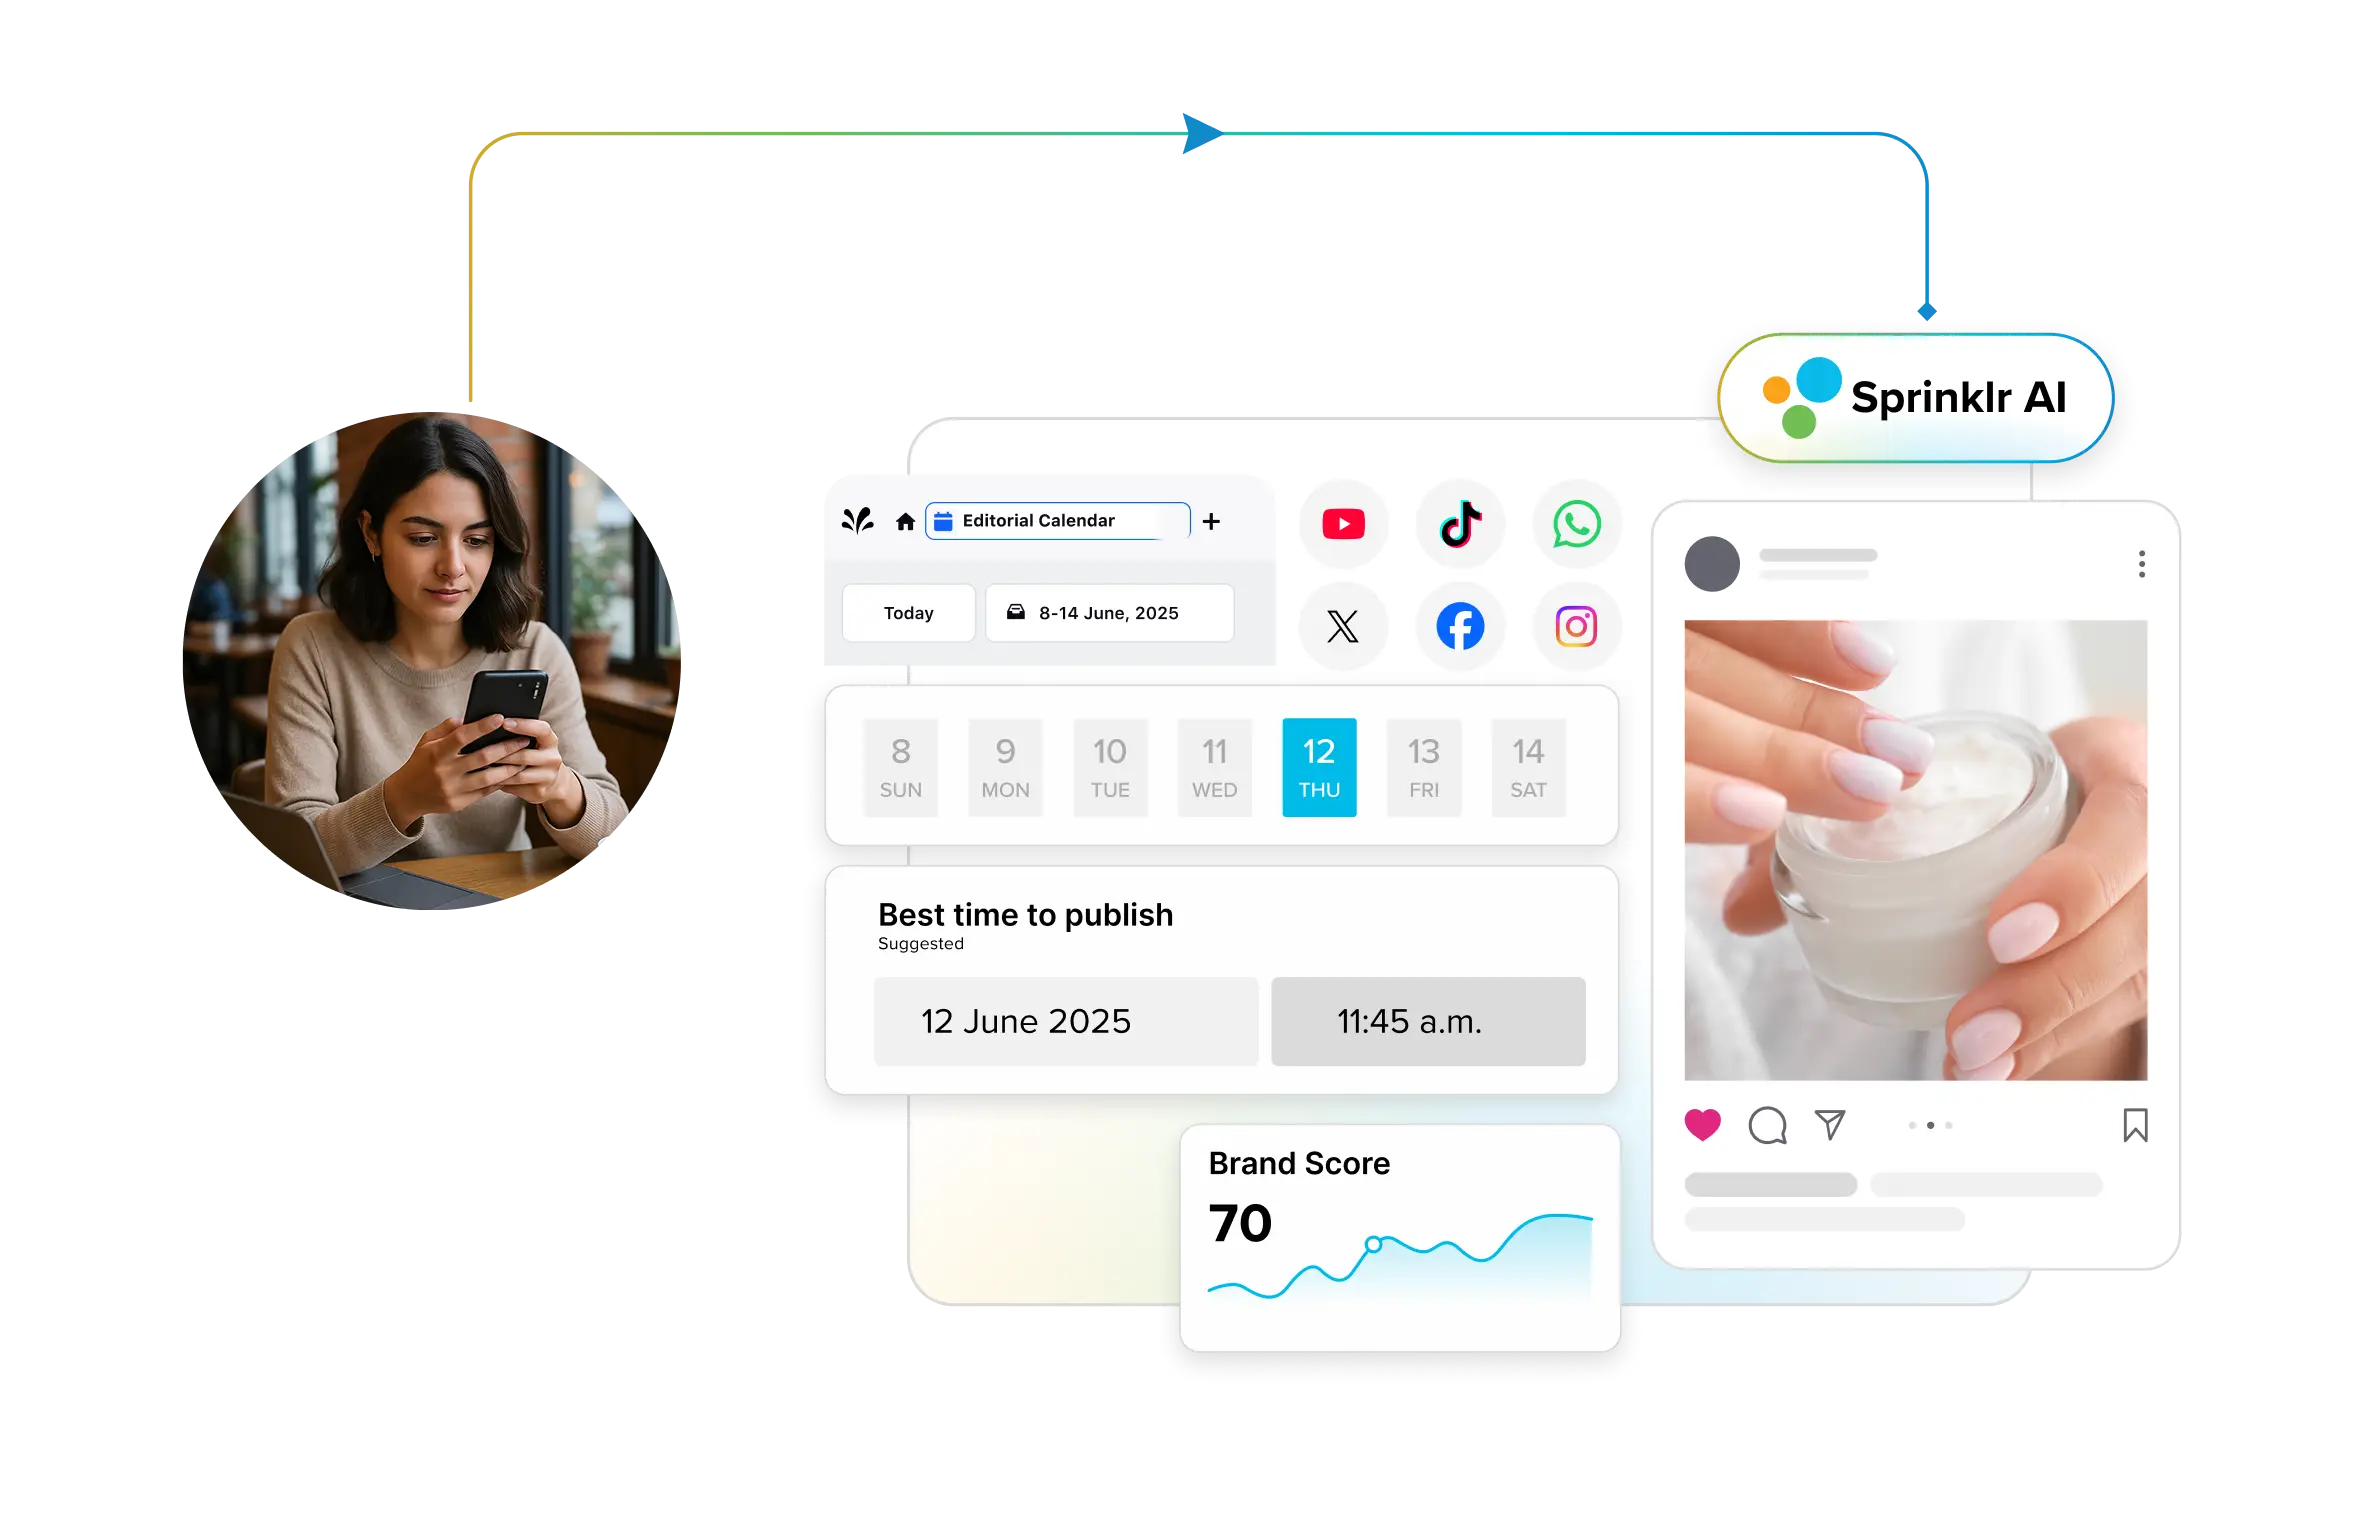
Social Media Metrics: All Types Explained
Aishwarya Suresh is an experienced content writer specializing in social media management, social listening, social analytics, Voice of the Customer (VoC) and customer experience. She writes practical, research-backed guides that help brands understand customer conversations, measure social media performance and turn insights into meaningful business decisions.
Key Takeaways:
- Social media metrics help brands reveal how audiences engage with content, how campaigns influence business outcomes, and how brand perception shifts across platforms.
- Effective social media measurement requires balancing marketing, engagement, conversion, customer service and ROI metrics instead of relying only on vanity metrics like follower count or impressions.
- Metrics such as watch time, video completion rate, sentiment analysis and pipeline influence have become increasingly important as short-form video, AI-driven discovery and fragmented customer journeys reshape social media performance.
- Leading brands use unified analytics, social listening and attribution tools to connect social media activity with customer experience, revenue impact, and long-term growth decisions.
Social media metrics help understand whether your content, campaigns, and social presence are working. They show what’s driving engagement, where audiences are responding, how content performs across channels, and whether social media efforts are contributing to larger business goals. Without the right metrics, it becomes difficult to know what to improve, what to scale, and what’s simply creating noise.
This guide breaks down the social media metrics that matter most today, what they actually tell you and how brands use them to measure performance more effectively across platforms. We’ll also look at how social media measurement is evolving with AI-driven analytics, social listening, and more connected reporting.
What are social media metrics?
Social media metrics are quantifiable data points used to measure the performance of your content, campaigns, and overall social media presence. They cover how people interact with your posts, how far your content travels, how effectively your team responds to customers, and whether your social efforts contribute to business goals like leads, conversions, and revenue.
Metrics can be grouped by what they measure:
- Engagement: How audiences interact with your content.
- Reach and awareness: How many people see your content and how often.
- Conversion: How social activity drives specific actions like signups, downloads, or purchases.
- Customer service: How fast and effectively your team handles inquiries through social.
- ROI and revenue: Whether your social spend is generating measurable returns.
What's changed in 2026 is the bar for what counts as meaningful measurement. With AI-driven feeds, dark social, and increasingly fragmented attention, surface-level metrics like follower count or raw impressions tell an incomplete story.
Do B2B and B2C brands track different social media metrics?
The core metrics are the same (reach, engagement, conversions, ROI), but what you prioritize shifts based on how your audience buys. B2C teams typically focus on engagement volume, follower growth, and direct conversions because purchase decisions are faster and more emotion driven. B2B teams weigh metrics like CTR, cost per lead, pipeline influence, and content-driven conversions more heavily because buying cycles are longer and involve multiple stakeholders.
The best approach is to align your metric stack to your actual business goals rather than defaulting to a B2B or B2C template. If your goal is awareness, measure reach and SOV. If it's pipeline, measure conversion rate and pipeline influence, regardless of business model.
Social media marketing metrics
1. Impressions
Impressions measure the total number of times your content appears on users’ screens across social media platforms. Unlike reach, impressions count repeated views from the same user as separate views.
This metric helps brands understand content visibility and distribution scale. A high number of impressions usually indicates that a platform’s algorithm is pushing your content more aggressively through feeds, recommendations, reposts or paid promotion.
However, impressions alone do not indicate content effectiveness. A post may generate strong visibility but still fail to drive engagement, clicks or conversions. That’s why marketers typically analyze impressions alongside metrics like engagement rate, click-through rate (CTR) and watch time to understand whether visibility is translating into meaningful audience action.
How it's calculated:
For example, if 500 users see your post twice, your total impressions would be 1,000 even though your reach is only 500.
2. Click-through rate (CTR)
Click-through rate (CTR) measures how often users click on a link after seeing your social media post or ad. It’s one of the clearest indicators of whether your social media messaging, creative and call-to-action are compelling enough to drive audience action.
A strong CTR generally signals that your content is relevant to the audience it is reaching. Teams often use CTR to evaluate campaign performance, optimize ad creatives, and identify which content formats generate the most traffic or conversions.
That said, CTR should always be interpreted in context. Awareness campaigns may prioritize reach and video views over clicks, while performance campaigns typically rely heavily on CTR as a success metric. Benchmarks also vary significantly across platforms, industries, and content formats.
Formula:
Example: If a campaign receives 150 clicks and 5,000 impressions:
CTR = (150 ÷ 5,000) × 100 = 3%
Note: A 2%+ CTR is generally strong for paid social, though short-form video CTAs and story-based placements can perform differently. Always benchmark against your own historical data and industry rather than relying on universal averages.
3. Share of Voice (SOV)
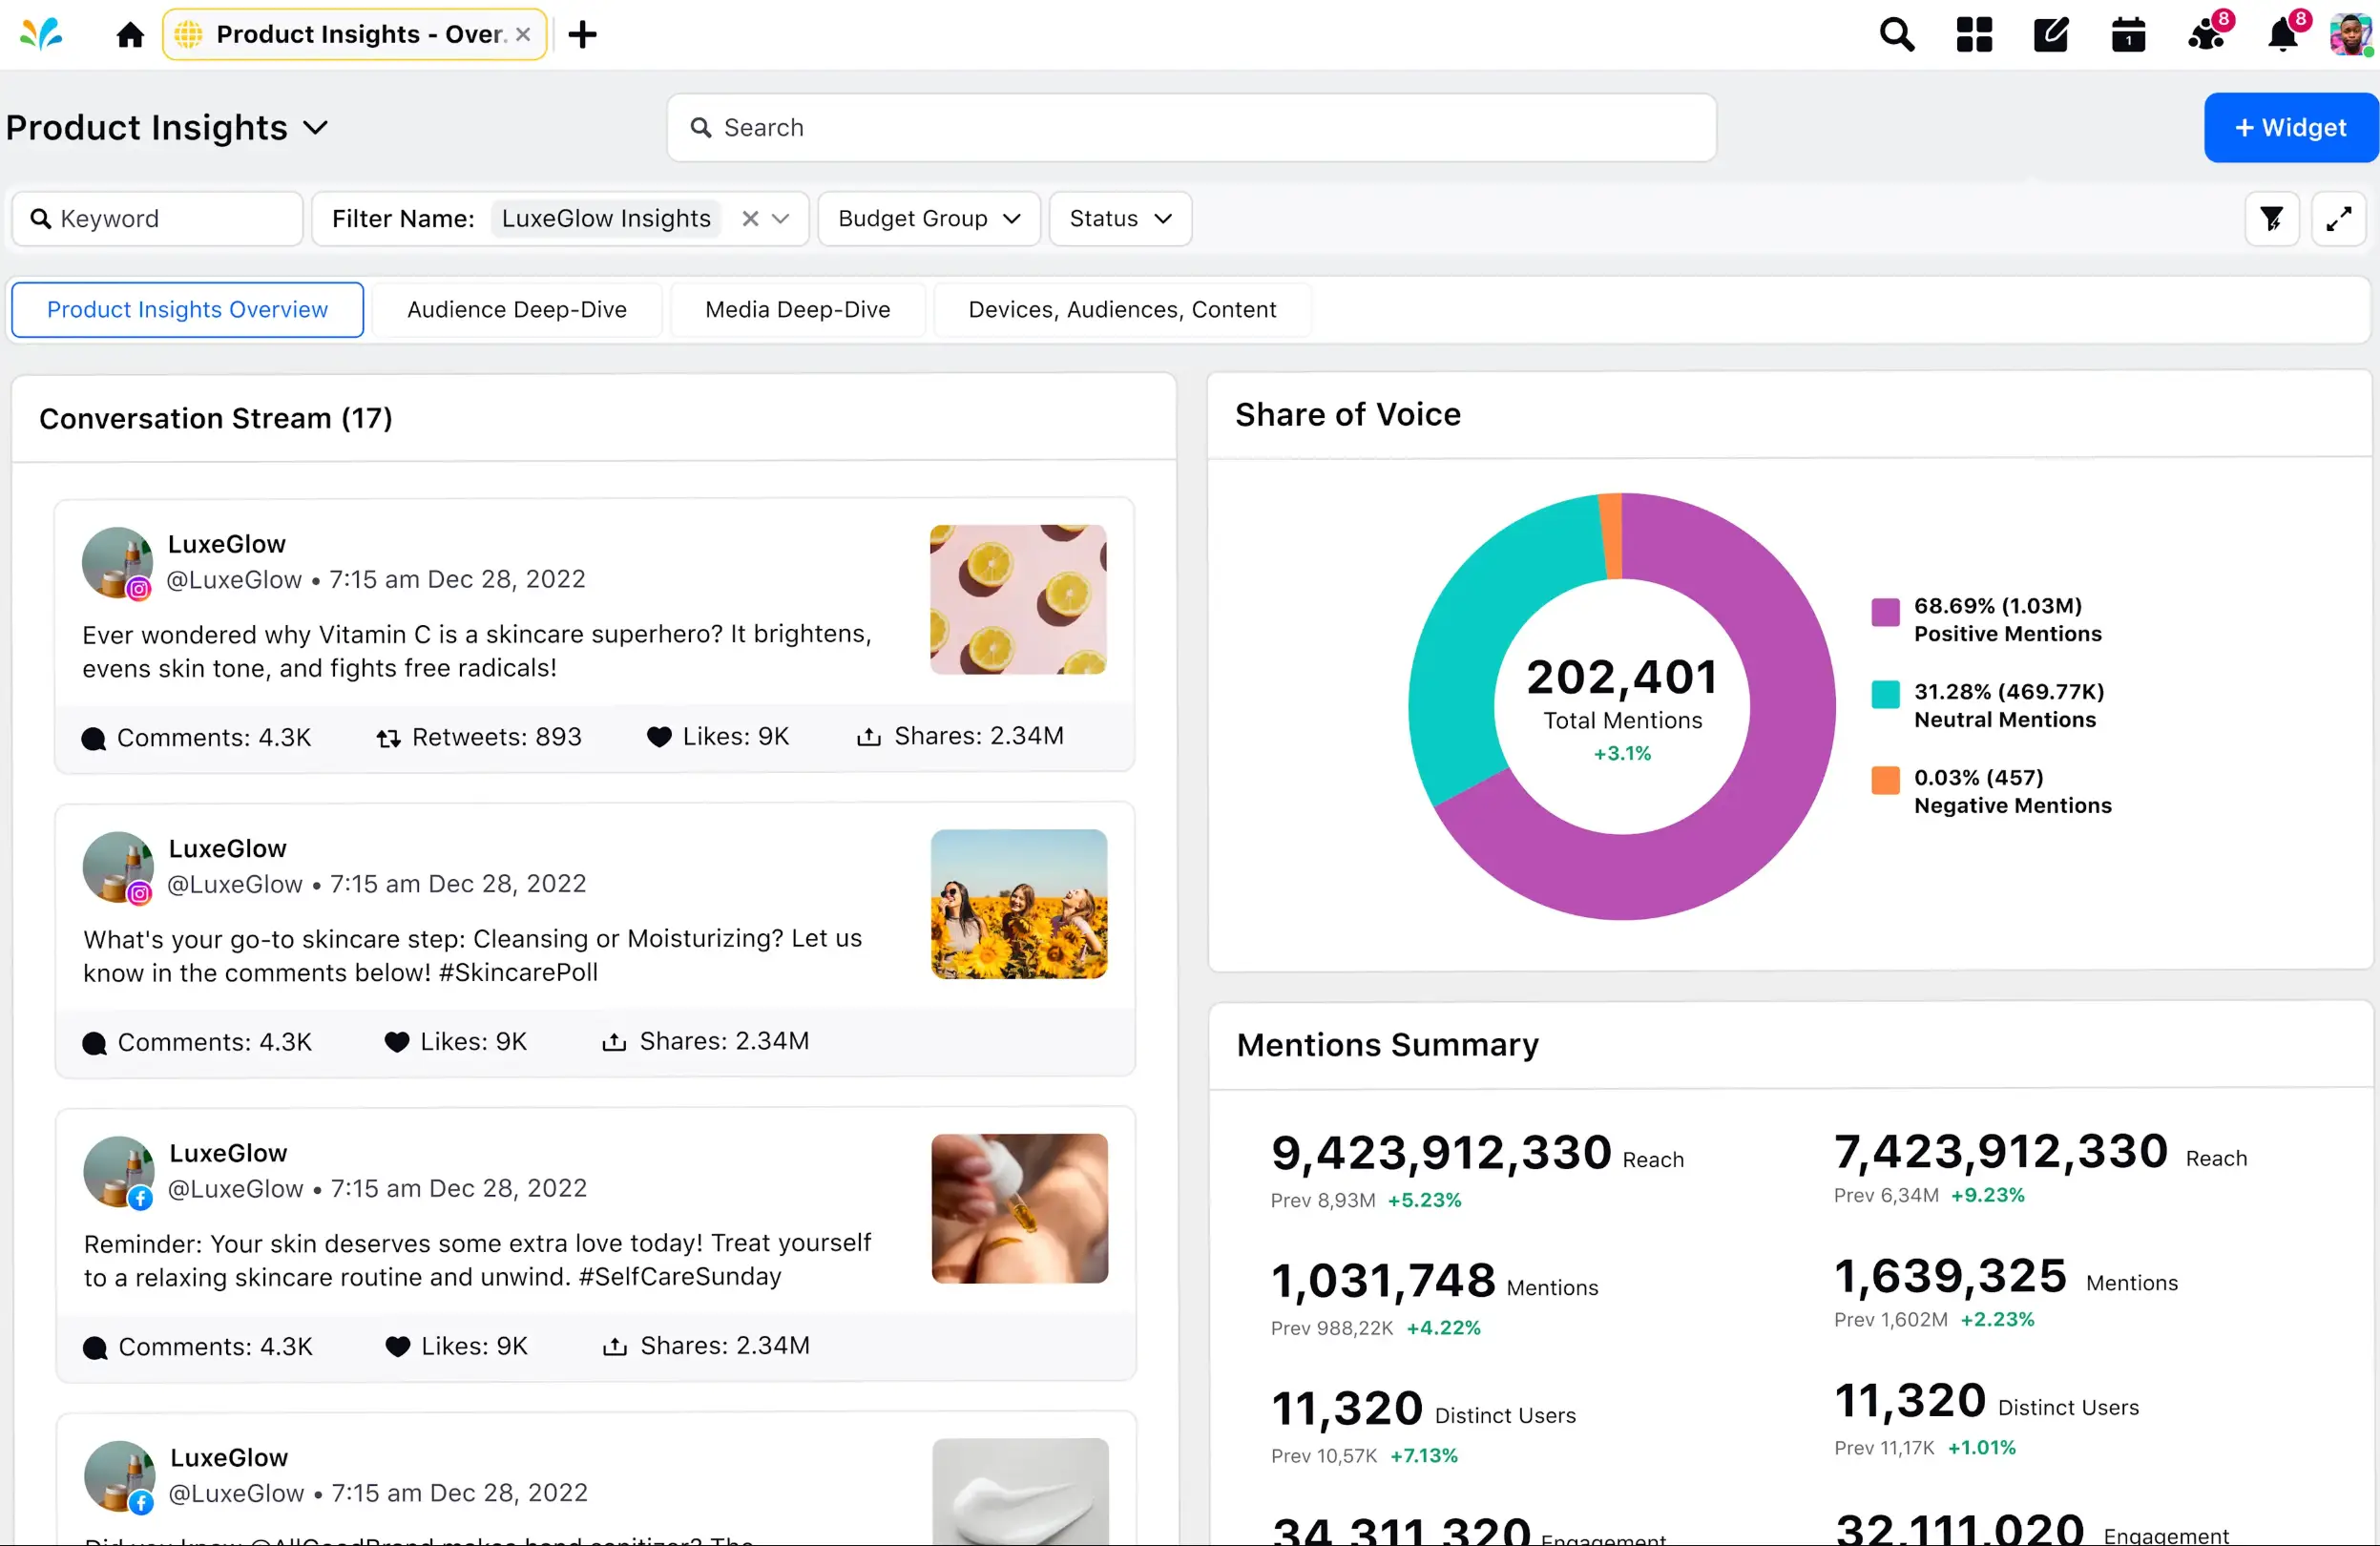
Share of Voice measures how much of the total social conversation in your category or industry involves your brand, compared to competitors. It captures both direct mentions (tagged), indirect mentions (untagged), and branded keyword usage across public posts, comments, and discussions; making it one of the more holistic brand health indicators available.
SOV is especially useful for measuring brand visibility and competitive positioning. A growing share of voice often signals increasing brand awareness, stronger campaign momentum or rising audience interest relative to competitors.
Formula:
Here’s the breakdown:
- Your brand mentions: Count how many times people talk about your brand on social media.
- Total industry mentions: This is the sum of your brand's mentions and your competitors' mentions combined.
Example: If you have 200 mentions and the total mentions in your industry are 1000, your SOV is = (200/1000) × 100 = 20%
Pro Tip: Modern social listening platforms such as Sprinklr’s Social Listening tool now track both direct mentions and indirect mentions. This matters because a large percentage of brand conversations now happen outside owned channels.
In 2026, SOV has become more nuanced — AI-generated content and third-party brand commentary have expanded the volume of mentions significantly. Tools that apply sentiment filters alongside mention volume give a more accurate picture of whether your SOV is working for or against you.
4. Cost per thousand impressions (CPM)
Cost per thousand impressions or Cost Per Mille (CPM) measures how much you pay to generate 1,000 ad impressions. It is commonly used in awareness-focused campaigns where the primary goal is visibility rather than immediate conversions.
CPM helps marketers evaluate the efficiency of paid social distribution. A lower CPM can indicate cost-efficient reach, while a rising CPM may suggest increased competition, audience saturation, or weaker ad relevance.
Since CPM focuses only on visibility, it should be analyzed alongside social engagement, CTR, and conversion metrics to understand actual campaign effectiveness.
Formula:
Example: If your CPM is $5, it means you’re paying 5 bucks every time your ad gets 1,000 views on social media. So, if your ad is seen 10,000 times, it would cost you $50.
Here’s How you can Convert Social Media Conversations into Revenue
Social media engagement metrics
1. Engagement rate
Engagement rate measures how actively audiences interact with your content through likes, comments, shares, saves, clicks and other platform-specific actions. It is one of the most widely used indicators of content relevance and audience resonance.
High engagement often signals that content is generating interest or conversation. However, modern engagement analysis goes beyond likes alone. On many platforms, saves, shares and meaningful comments now carry more weight because they indicate stronger audience intent and higher content value.
Engagement rate also helps teams compare performance across campaigns, content formats and platforms more fairly than raw engagement counts alone.
Formula:
- Total engagement: This is the sum of all interactions with your content, like likes, comments, shares, and clicks.
- Total followers: The number of people who follow your account.
Example: If your post got 100 interactions (likes, comments, etc.) and you have 1,000 followers:
Your Engagement Rate = (100 / 1,000) × 100 = 10%
This means 10% of your followers interacted with your post, which now becomes your engagement rate.
Worth noting: Engagement patterns are shifting. Average comments per post have declined on both TikTok (down 24%) and Instagram (down 16%), suggesting audiences are engaging more passively (through saves, shares, and views) rather than starting conversations.
If you still need to dive deeper, read our blog on How to Measure Social Media Engagement Effectively!
2. Reach
Reach measures the number of unique users who viewed your content during a given period. Unlike impressions, reach counts each user only once regardless of how many times they saw the content.
This metric helps brands understand how widely content is being distributed across audiences. Teams often analyze reach alongside engagement metrics to determine whether content is simply being seen or actually influencing audience behavior.
Reach is reported natively by platforms and doesn't have a manual formula. However, it can be segmented in useful ways:
- Organic reach: Users who see your content without paid promotion.
- Paid reach: Users who see your content through advertising.
- Viral reach: Users who see your content because someone in their network shared it.
Good Read: Organic vs Paid Social Media: How to Maximize ROI
3. Virality rate
Virality rate measures how often users share your content relative to the number of views or impressions it receives. It helps quantify how effectively content spreads beyond your existing audience.
This metric has become increasingly important in the era of algorithm-driven discovery, where reposts, shares and community amplification heavily influence content distribution.
A high virality rate usually indicates that content is emotionally engaging, highly relevant, or valuable enough for audiences to share with others.
Formula:
Example: If your video snagged 1,000 views and got shared 100 times:
Virality rate = (100 shares / 1,000 views) × 100 = 10%
A 10% virality rate means that for every ten people who viewed your content, one person shared it on their social media profile. The higher this number, the more viral your content is, giving you a solid read on how much your audience is loving and sharing your work.
Note: A 5-10% virality rate is considered strong for most content types. For B2B brands especially, virality rate on thought leadership or data-driven content can be a meaningful signal of category authority — not just entertainment value.
🧭 Craving Viral Success? Check Out "Tips for Participating in Viral Social Media Challenges"
4. Video completion rate
Video completion rate measures the percentage of viewers who watch a video until the end. As short-form video continues to dominate platform algorithms, this metric has become one of the strongest indicators of content quality and audience retention.
High completion rates often signal that the content is relevant, engaging, and well-paced. Many platforms also use completion rate as a ranking signal when deciding how widely to distribute video content.
Formula:
Good to know: The Most Important Video Metrics You Should Track
5. Saves and save rate
Saves have become one of the strongest engagement signals on platforms like Instagram, TikTok, and LinkedIn. When someone saves your post, they're telling the social algorithm and you that the content is worth returning to.
A high save rate typically indicates your content is educational, actionable, or reference-worthy — the kind of content that builds long-term audience trust. In algorithmic terms, saves are now weighted more heavily than likes on most platforms, making this a metric worth tracking alongside (or even above) traditional engagement rate.
Formula:
6. Amplification rate (shares)
Amplification rate measures how often your content is shared relative to your audience size. It's a direct indicator of how much your audience is extending your content's reach on your behalf.
Formula:
Example: A post that gets shared 80 times from an account with 4,000 followers has a 2% amplification rate.
Shares carry implicit credibility — when someone shares your content, they're endorsing it to their own network. TikTok shares per post grew by 45% YoY suggesting that shareability is becoming a more important content strategy lever than pure engagement volume.
7. Follower growth rate
Follower growth rate tracks how fast your audience is growing (or shrinking) over a given period. Unlike raw follower count, the rate gives you a normalized view that's comparable across accounts of different sizes.
Formula:
Example: If you start the month with 10,000 followers and gain 300, your growth rate is 3%.
This metric is particularly useful for evaluating whether specific campaigns, content formats, or collaborations are driving sustained audience growth versus one-time spikes.
Here’s How you can Grow your Followers on Social Media
Social media conversion metrics
1. Conversion rate
Conversion rate measures the percentage of users who complete a desired action after clicking on or engaging with your social media content. It directly connects social media performance to business outcomes.
A strong social conversion rate often indicates that audience targeting, messaging and landing page experience are aligned effectively.
Formula:
Example: If a campaign drives 2,000 clicks and 80 of those result in demo signups, your conversion rate is 4%.
💡 Tip: Use UTM parameters to tag your social media links with campaign names, mediums, and sources. This lets you trace exactly which campaigns, platforms, and posts are driving conversions — rather than attributing everything broadly to "social."
2. Cost per conversion
Cost per conversion measures how much a brand spends to generate a specific action, such as a purchase, sign-up or lead. It helps teams evaluate campaign efficiency and customer acquisition costs.
Formula:
Example: If you spend $500 on a marketing campaign and it results in 50 people signing up for your service, your cost per conversion would be: $10.
It helps advertisers and marketers to:
- Optimize their campaigns by adjusting bids
- Allocate budgets effectively
- Maximize social media ROI
- Compare the cost-effectiveness of advertising on different channels
3. Lead generation rate
Lead generation rate tracks the percentage of visitors (from social media) who complete a form, signup, or other lead-qualifying action on your landing page.
Formula:
Example: If your campaign attracts 1,000 visitors and from these, you generate 50 leads, your lead generation rate would be: 5%
This means that 5% of the people who visited your site from the campaign took some action that qualifies them as a lead, like filling out a contact form, signing up for a newsletter or downloading a whitepaper.
4. Pipeline influence
Pipeline influence tracks whether social media touchpoints appear in the journey of contacts who eventually convert into qualified opportunities or customers — even when social wasn't the last touch. It's tracked through CRM integrations and multi-touch attribution models, typically with a lookback window of 24-90 days depending on your sales cycle.
Formula:
Example: If your total open pipeline is worth $500,000 and $300,000 of that involved contacts who engaged with at least one social post, ad, or piece of social content before entering the pipeline, your social-influenced pipeline is 60%.
For most B2B teams, sourced pipeline (where social was the first touch) typically accounts for just 5-20% of total pipeline. But influenced pipeline (where social participated anywhere in the journey) often covers a majority of deals. Only 48% of organizations measure it, which means most teams are significantly underreporting social's contribution to revenue.
This gap widens further with dark social — shares through DMs, WhatsApp, Slack, or email where standard tracking breaks. To surface this hidden influence, teams use branded short links, UTM clustering, and self-reported attribution fields ("How did you hear about us?") at key conversion points.
Deep Dive: Social Media KPIs That Prove ROI in 2026 and Beyond
What social media metrics should I present to leadership?
Lead with business outcomes, not platform data. Most leadership teams don't need to see likes, saves, or impressions — they need to know how social is contributing to pipeline, revenue, brand awareness, or customer retention. Structure your report around goals, not platforms: what was the objective, which metrics track progress toward it, what changed, and what you're adjusting. Keep platform-level detail in an appendix for the team, and keep the executive view focused on trends, ROI, and decisions.
Social media customer service metrics
1. Average response time
Average response time measures how long it takes your team to respond to customer queries, complaints, or messages that come through social media channels. It's one of the most direct indicators of how responsive your brand feels to customers in real time.
Formula:
Example: If your team took 150 minutes in total to respond to 10 customer queries, your average response time would be:
Average response time = 150 minutes / 10 = 15 minutes
This means, on average, it took your team 15 minutes to respond to each customer query on social media.
Response time expectations on social media are higher than on email or phone. 90% of customers rate an immediate response as important when they have a service question, and delays on public channels like X or Instagram can quickly escalate into visible dissatisfaction.
AI-powered tools are helping teams reduce response times significantly without sacrificing quality. Platforms like Sprinklr Service use AI-powered routing to match queries to the right agent based on skill and availability, conversational AI agents to handle routine cases instantly across 30+ channels, and agent copilots that surface real-time reply suggestions drawn from past cases and knowledge base articles — so teams resolve faster while staying on-brand.
2. Customer satisfaction (CSAT) score
CSAT captures how satisfied customers are with a service interaction, support experience or brand engagement, typically measured via a follow-up survey on the same channel.
Formula:
- Number of satisfied scores: Add up the ratings given by all respondents on your CSAT survey. These ratings are usually on a scale, such as 1 to 5 or 1 to 10. These ratings are usually on a scale, such as 1 to 5 or 1 to 10.
- Total number of respondents: Count how many people gave you feedback.
Example: If 10 customers rated their satisfaction level and their scores add up to 40 (on a scale of 1 to 5), your CSAT score would be calculated as:
CSAT Score = (40 / 10) × 100 = 400 / 10 = 40%
CSAT on social is most valuable when tracked alongside resolution rate and response time — together, they give a complete picture of social service quality, not just perceived satisfaction at a single moment.
Good to know: Sprinklr Service with AI-powered CSAT Prediction and automated CSAT surveys delivers the data-driven insights you need to create better service experiences on all customer and social media channels. Schedule an expert-led demo now to know more.
Social media ROI metrics
1. Cost per click (CPC)
Cost per click (CPC) measures how much advertisers pay for each click on a paid social ad. It is widely used to evaluate ad efficiency and campaign competitiveness.
Formula:
Example: If you spend $500 on a campaign and receive 1,000 clicks, your CPC is $0.50.
CPC helps you compare cost efficiency across platforms, ad formats, and audience segments. A lower CPC doesn't always mean better performance — it should be read alongside conversion rate and cost per conversion to get the full picture.
2. Return on ad spend (ROAS)
ROAS measures the revenue generated for every dollar spent on advertising. It is one of the clearest indicators of paid campaign profitability.
Formula:
Example: If you spend $1,000 on a campaign and generate $4,000 in attributed revenue, your ROAS is 4:1 — meaning every dollar spent returned four dollars in revenue.
Across most industries, a 3:1 return is considered the baseline for paid social, while a 5:1 return is a strong benchmark. But ROAS should always be evaluated in context — longer sales cycles, brand awareness campaigns, and multi-touch attribution models can all affect how this number looks.
One growing limitation: As third-party cookies phase out, ROAS based on last-click data alone increasingly underreports actual returns. Teams are shifting toward blended attribution models (first-touch, linear, or data-driven) to get a more accurate picture. If your ROAS looks underwhelming, but pipeline influence tells a different story, the problem may be your attribution model, not your campaign.
Bonus metrics
1. Social media influencer and creator impact
Influencer impact measures how much of your total engagement, traffic, or conversions can be attributed to influencer-led campaigns. As influencer marketing matures (94% of organizations now say it outperforms traditional digital advertising), measuring its direct contribution has become essential.
Formula:
Example: If an influencer campaign generates 400 conversions out of a total of 2,000 in the same period, the influencer impact is 20%.
Beyond the formula, teams should also track sentiment and brand mention quality around influencer content. A campaign that drives conversions but generates negative sentiment may not be a net positive.
In 2026, the conversation has shifted from macro-influencer reach to measurable creator ROI — with more brands using tracked affiliate links, promo codes, and platform-native analytics to tie creator content directly to outcomes.
How do you measure influencer marketing ROI across multiple platforms?
Brands typically measure influencer marketing ROI by combining engagement, conversions, affiliate link performance, promo code usage and sentiment data across platforms. Many teams now use unified reporting and creator management platforms to consolidate influencer metrics alongside broader social media performance data, making it easier to compare creator impact across campaigns and channels.
For example, integrations between creator marketing platforms like CreatorIQ and unified social media management platforms like Sprinklr help brands centralize creator campaign reporting, track influencer-driven engagement and connect creator performance with broader marketing analytics workflows.
2. Social media sentiment analysis
Social media sentiment analysis measures the emotional tone behind online conversations about a brand, campaign, or topic. Using AI and natural language processing, brands can classify mentions as positive, negative or neutral.
The formula for sentiment analysis metrics depends on the tool or software used. Generally, sentiment analysis algorithms assign scores to text based on keywords, tone, and context to decode the sentiment. In short, rather than keeping track of mentions or comments, sentiment analysis considers the feelings and opinions of your audience behind their mentions.
The algorithm of social listening tools categorizes sentiment within your mentions in the following way:
Sentiment is best used as a qualitative layer on top of your quantitative metrics. A post with high engagement, but negative sentiment tells a very different story than one with high engagement and positive sentiment.
Look no further, the only guide you need! Social Media Sentiment Analysis: An Easy Guide
3. Social search visibility
Social search visibility measures how discoverable your brand and content are through in-platform search features on TikTok, Instagram, LinkedIn, YouTube, and Reddit. As social platforms increasingly function as search engines, with 41% of Gen Z now preferring them over Google for discovery — optimizing for social search has become as important as optimizing for traditional SEO.
There's no single formula for this. Instead, teams track a combination of signals:
- Search impressions — how often your content appears in platform search results
- Discovery vs. feed traffic — what percentage of your views come from search and explore rather than followers' feeds
- Keyword positioning — whether your content ranks for relevant in-platform search terms
Content that performs well in social search tends to have strong metadata density — keywords aligned across captions, hashtags, spoken words, and on-screen text; along with high save rates, which platforms use as a primary quality signal for search ranking.
Do AI search tools like ChatGPT and Gemini affect brand visibility?
Yes — and increasingly so. A growing number of users now ask AI assistants directly for product recommendations, brand comparisons, and buying advice instead of browsing search results or social feeds. The difference is that brands have little control over how (or whether) they appear in these responses, and most have no way to monitor it.
Tools like Sprinklr's LLM Insights (currently in beta) are emerging to address this — letting teams track how major LLMs reference their brand, what sentiment they attach to it, and where competitors are being recommended instead.
Final thoughts
Tracking social media metrics isn't the hard part — knowing which ones deserve your attention and building the operational systems to act on them consistently, is where most teams struggle.
The brands getting the most out of social measurement in 2026 aren't necessarily tracking more metrics. They're tracking the right ones, connecting them to business outcomes, and using that intelligence to make faster, better-informed decisions at every stage of the funnel.
If you're looking to bring that kind of clarity to your social media measurement, Sprinklr Social gives you a unified view across channels, campaigns, and teams — so the metrics that matter are always within reach. See it in action! ⬇️
Aishwarya Suresh is an experienced content writer specializing in social media management, social listening, social analytics, Voice of the Customer (VoC) and customer experience. She writes practical, research-backed guides that help brands understand customer conversations, measure social media performance and turn insights into meaningful business decisions.
Explore Social Media Analytics