Insight Card Functionalities
Updated
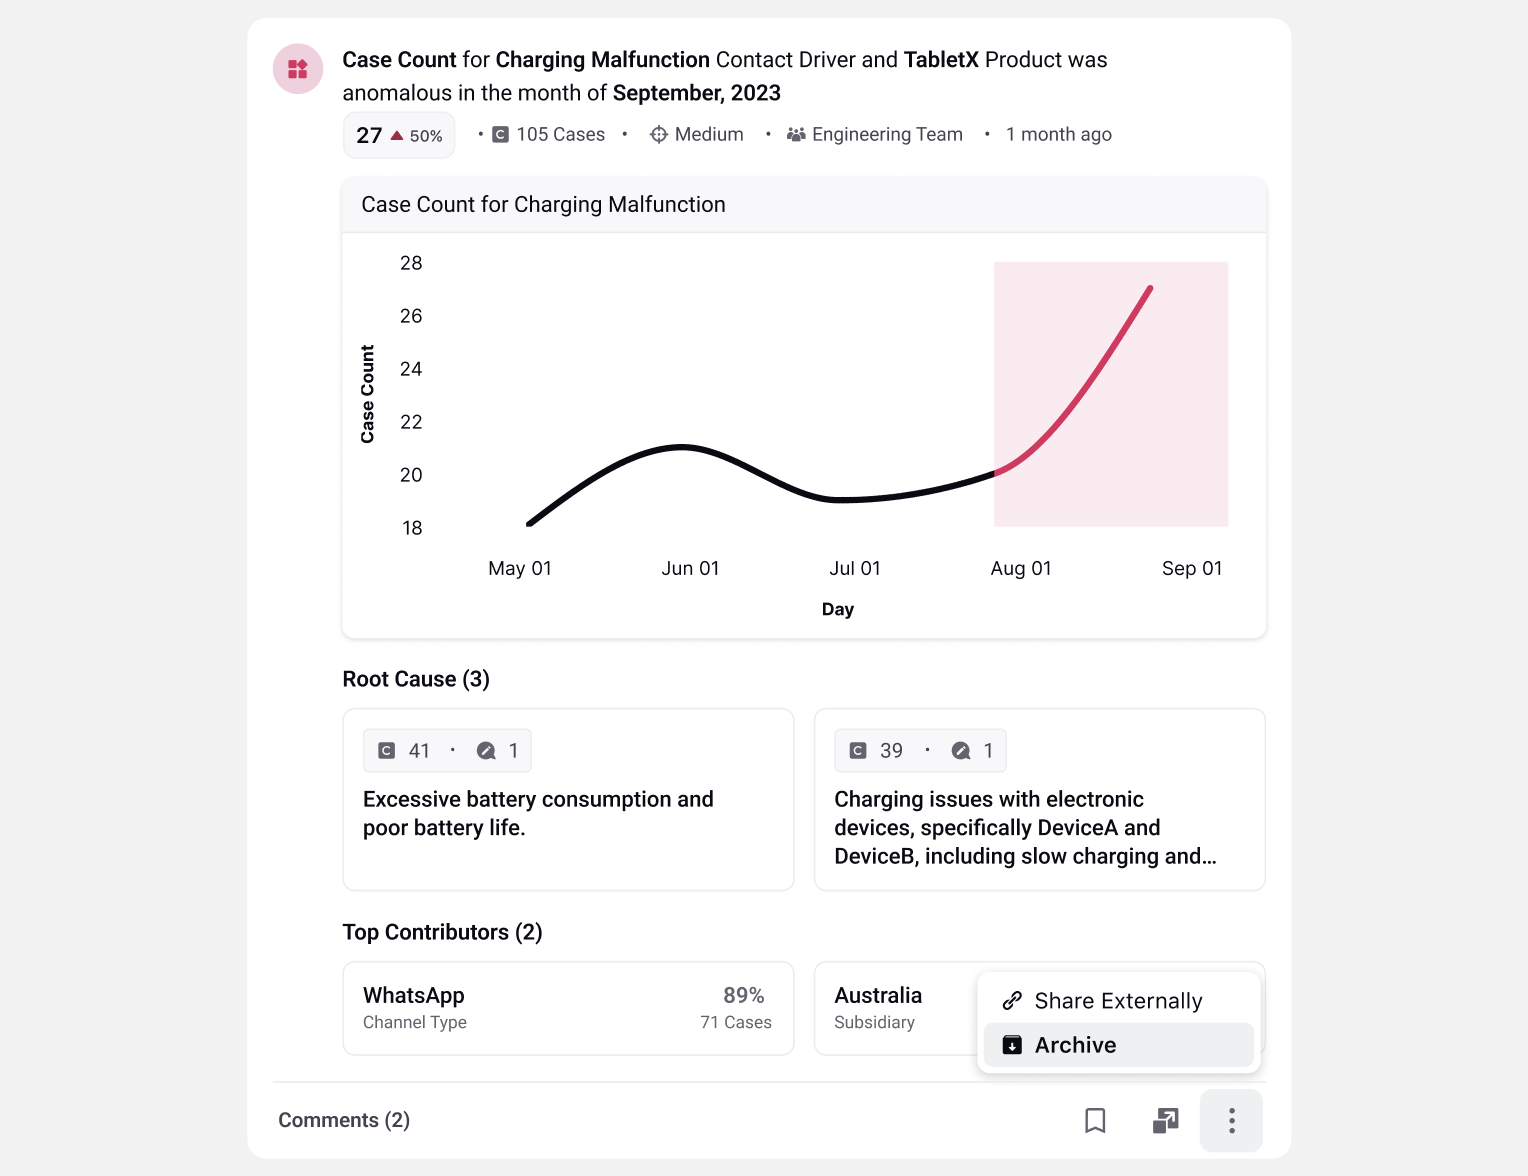
Each insight card provides a concise overview:
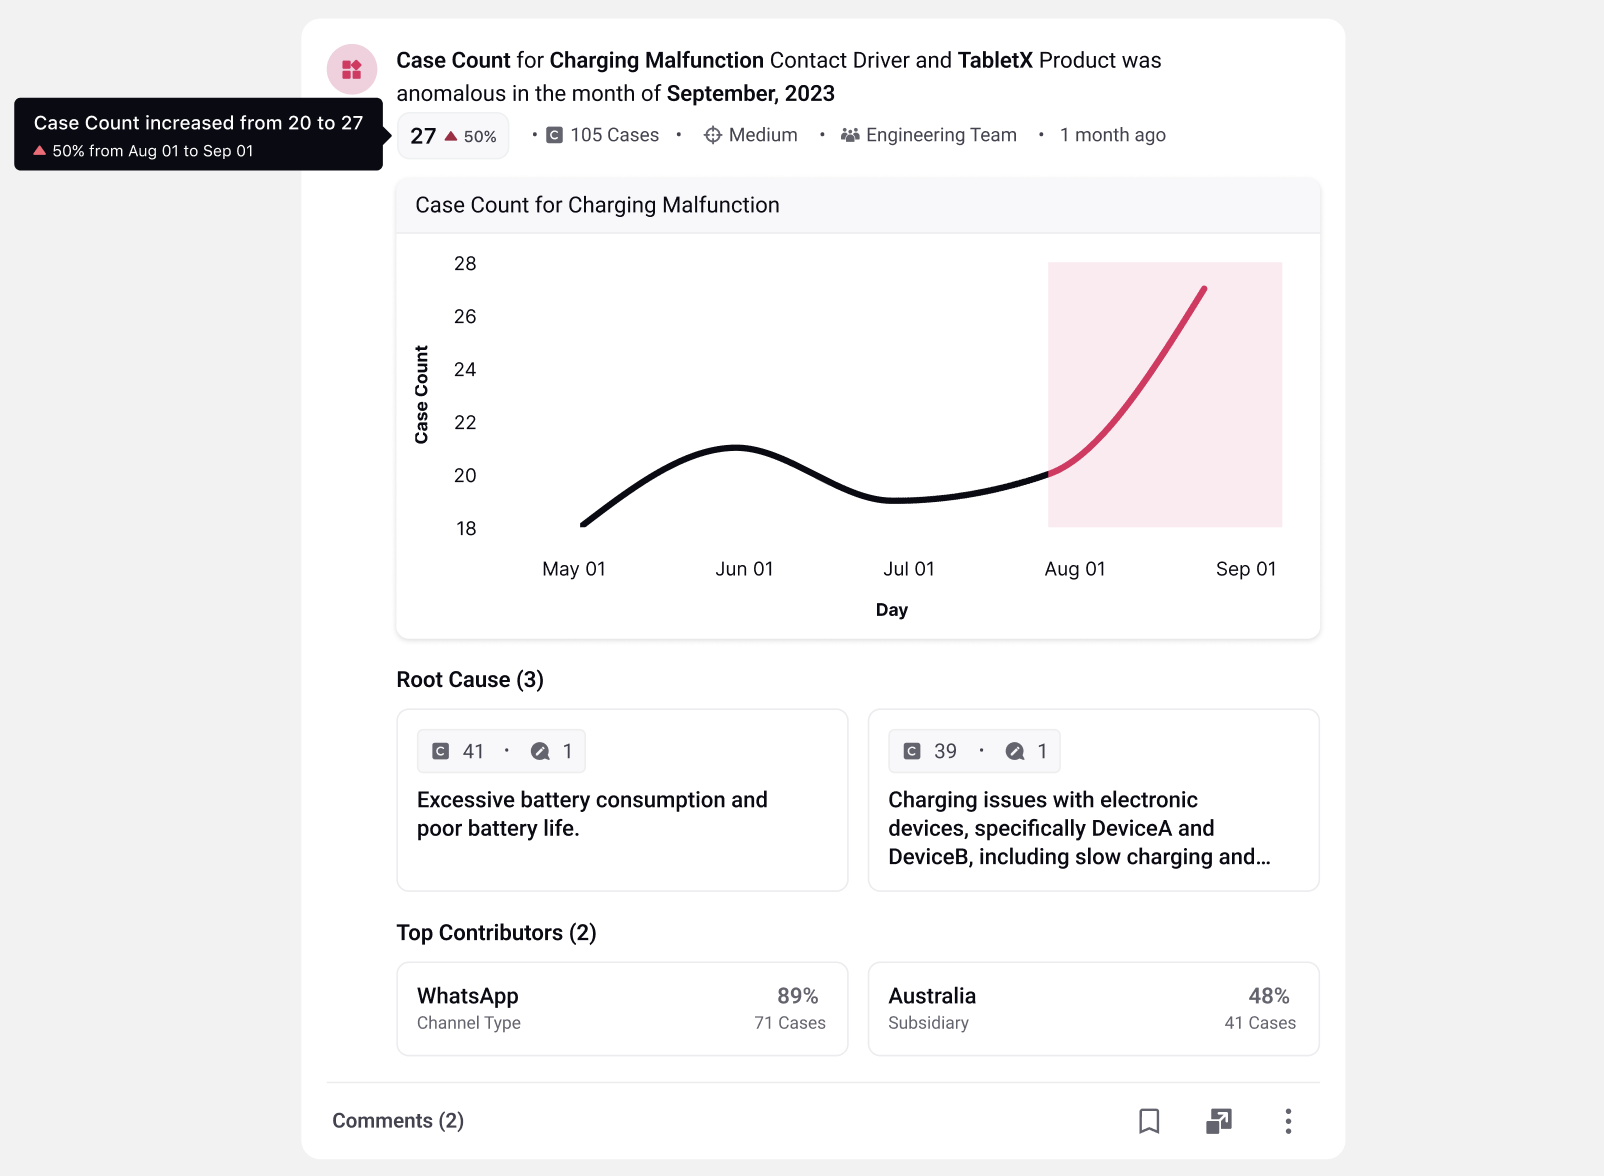
Title: Describes an event or situation, providing a summary of "what is happening." It focuses on communicating the observed pattern and changes in a metric associated with specific dimensions and a timeline.
Insight Summary
Below the title, the insight card provides valuable information on the insight.

Pattern: The percentage increase or decrease in the metric and the total count of observed cases. It shows the observed pattern within the associated metadata, including metrics and dimensions. Metadata refers to the various fields and metrics are associated with each case, such as the channel, CSAT score, case duration, region, or the discussed product.
Case Count: Next, the case count indicates the total number of cases on which this insight is based.
Impact Score: The card also features the Impact Score, which is categorized as high, medium, or low. The Impact Score is derived by combining severity and case count. Severity assesses how severe the insight is based on the defined focus areas for the specific insight group. For example, legal issues might be highly severe for the legal and warranties team but not as much for the engineering team. The case count represents how many cases the insight is based on. The Impact Score ranges from 0 to 100, indicating low (0-40), medium (40-70), and high (70-100).
Insight Group: Furthermore, the card specifies the insight group for which this insight was generated.
Time: The time of insight generation is also provided, indicating when the insight was created.
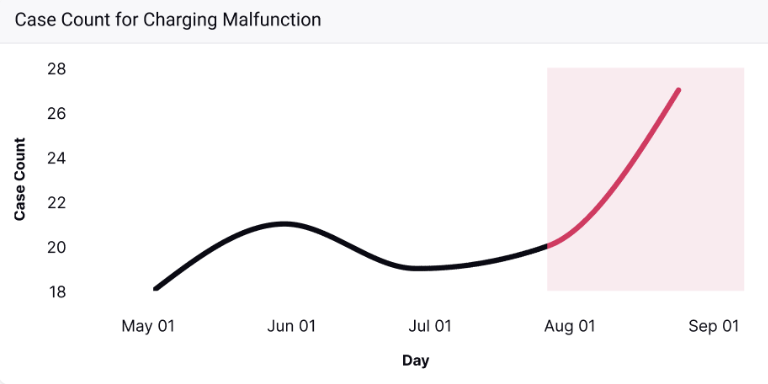
Graph: The graph represents the observed pattern and changes in a metric associated with specific dimensions and a timeline.
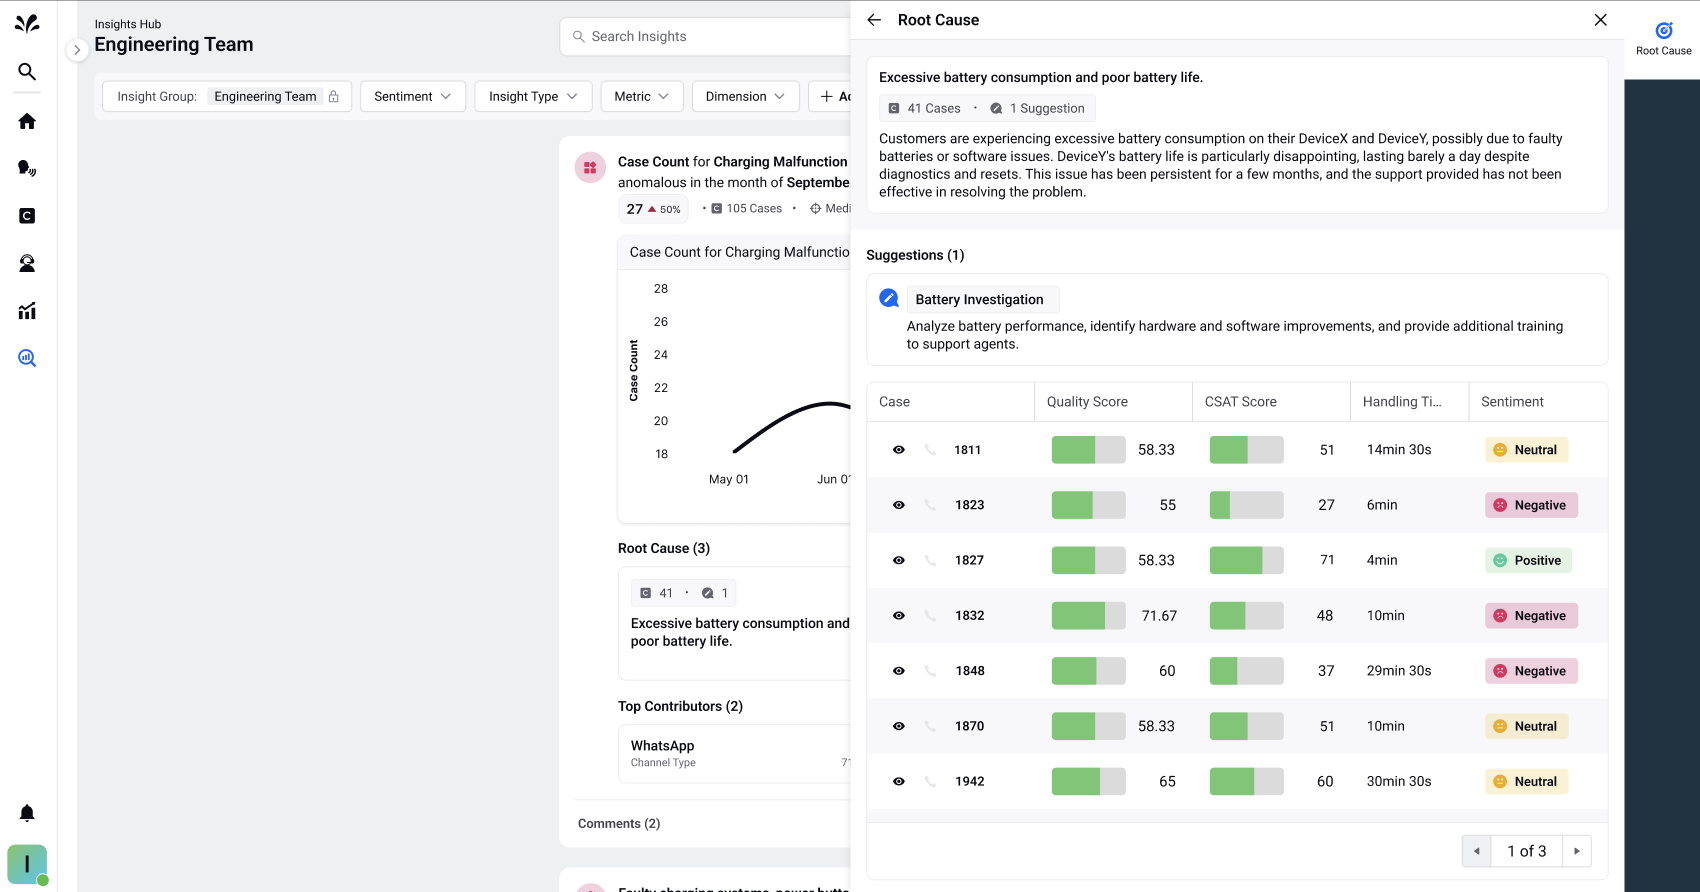
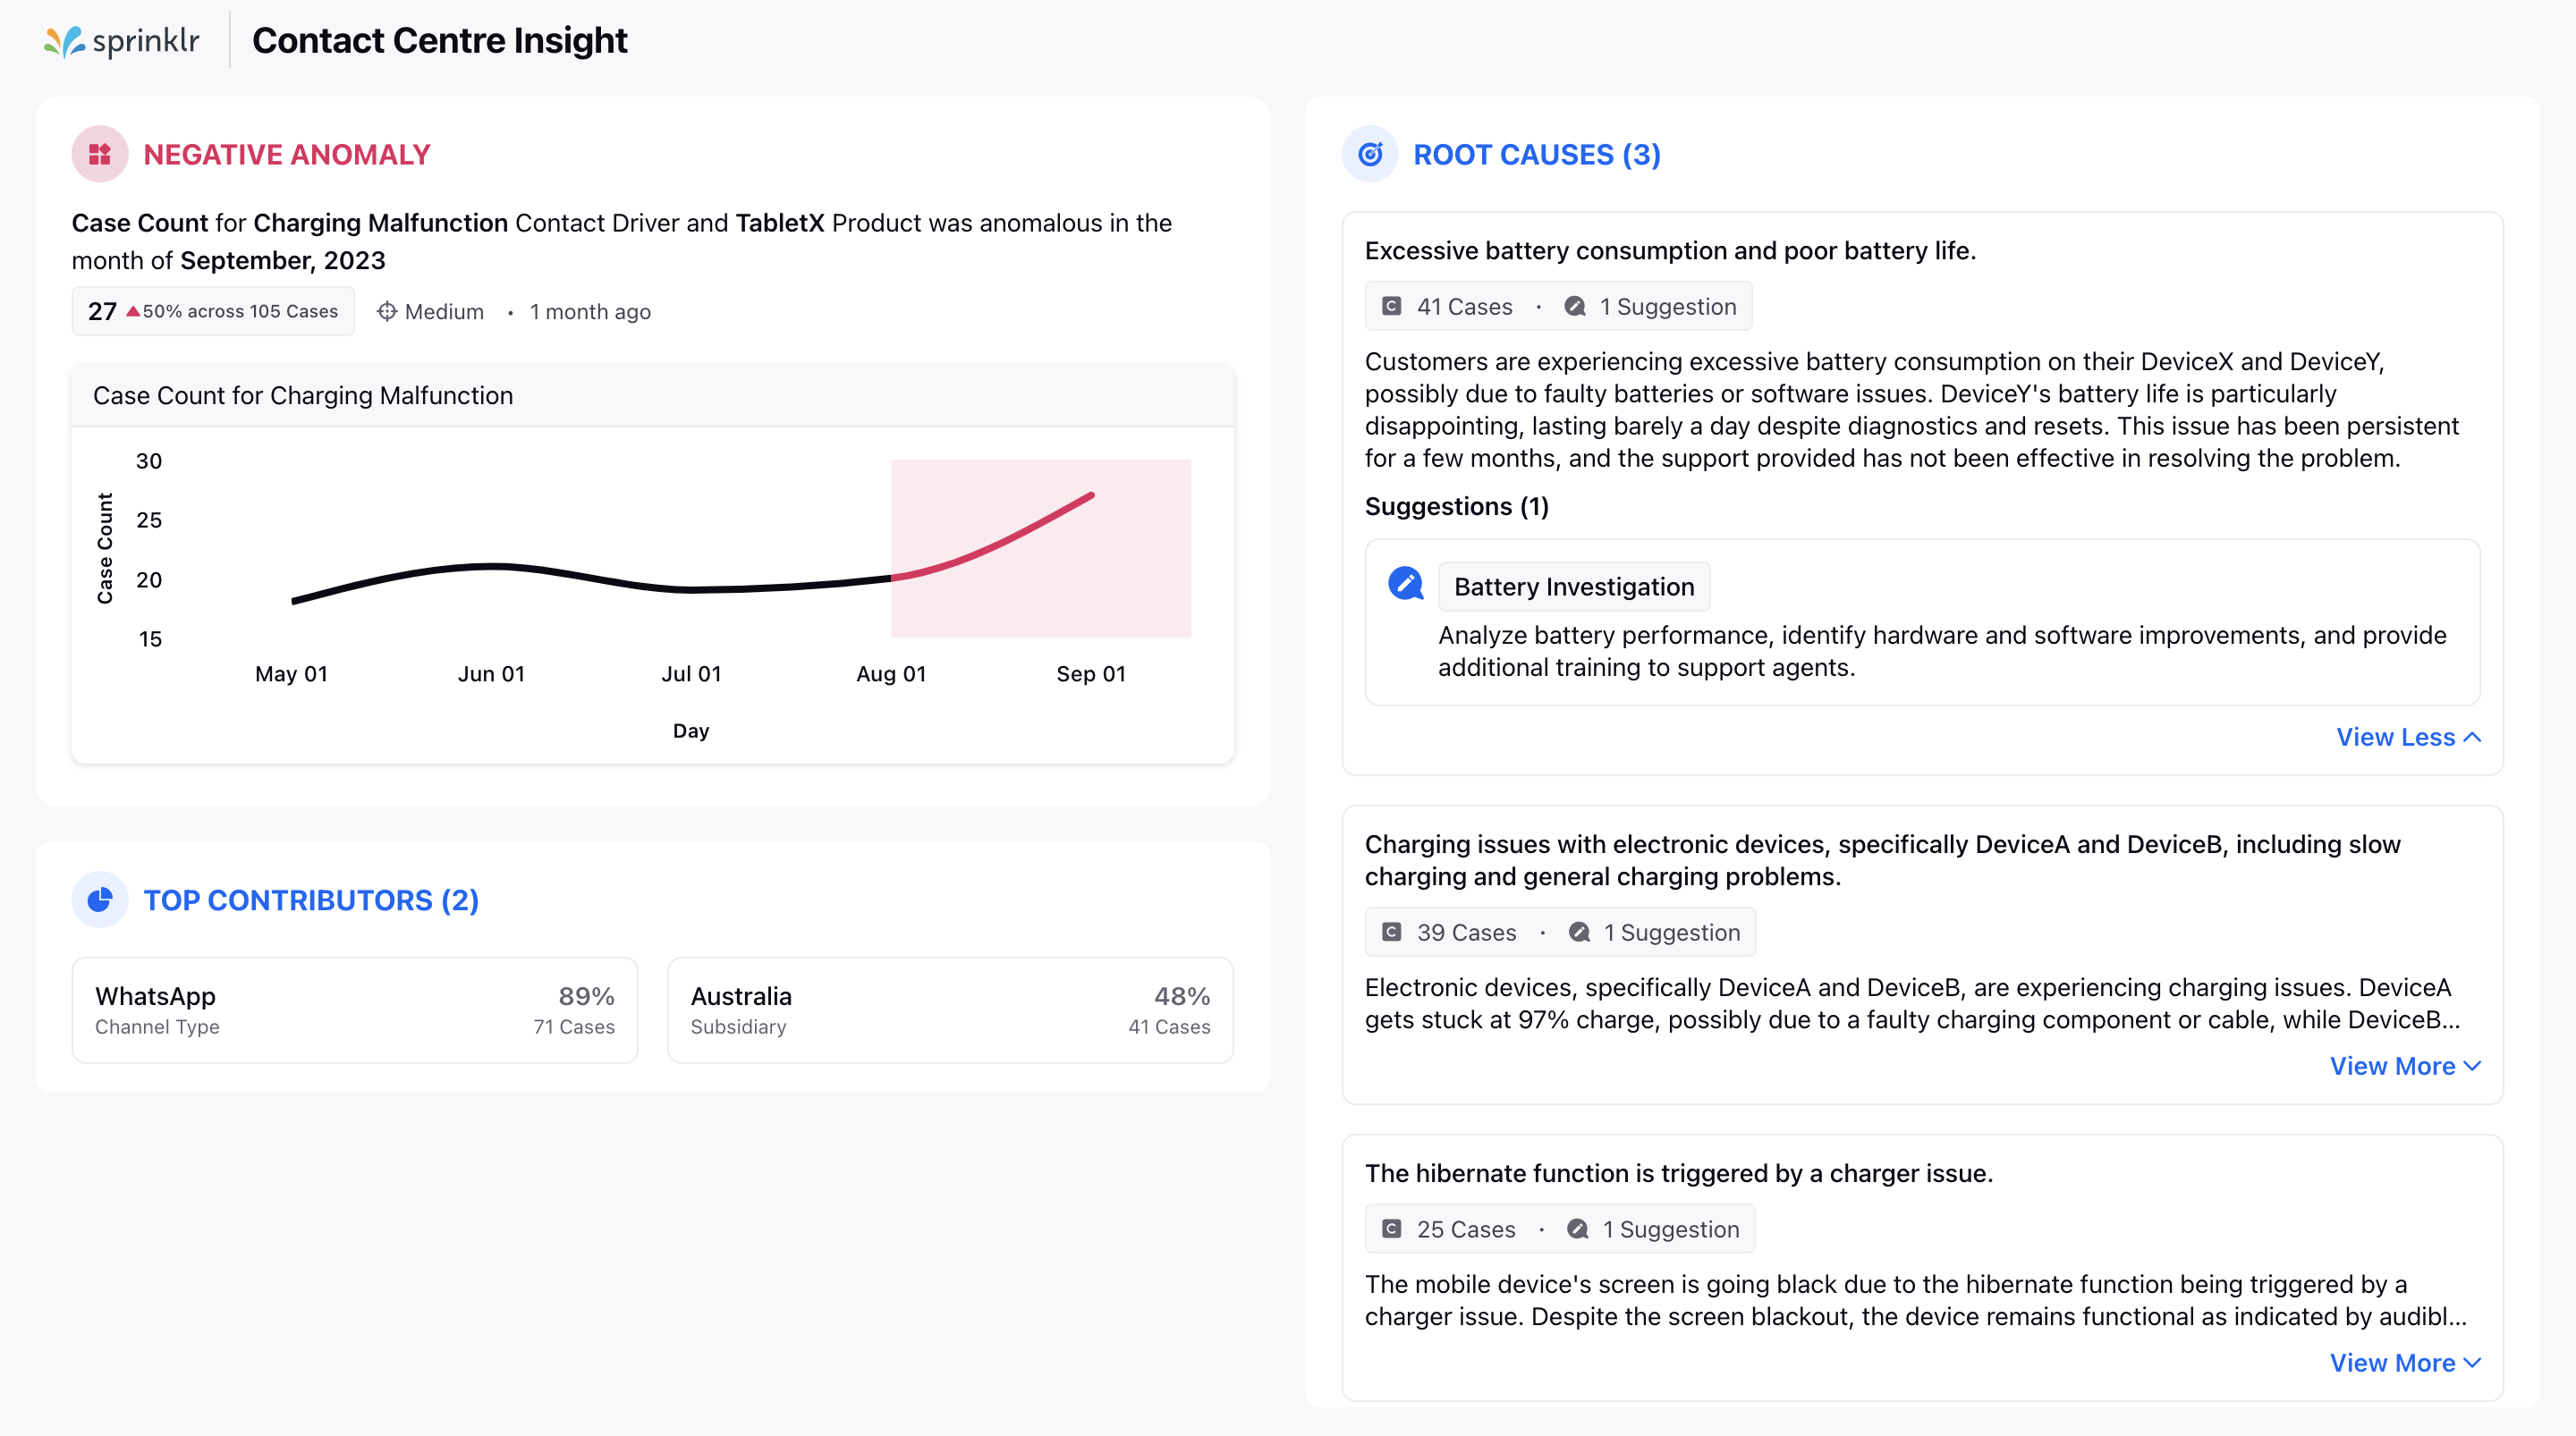
Root Cause: Provides a detailed analysis of the root cause, accompanied by customized recommendations for each identified issue. It also displays the associated number of cases and suggestions. In the below image, 41 represents the associated case count, and 1 represents the number of suggestions.
The explanation of the root cause includes the duration of the issue and outlines the impact it has on the customer. Clicking on a root cause allows you to access a more detailed analysis and view associated cases in the third pane. Additionally, you can click on the case number to navigate directly to the Case Analytics view for further insights.
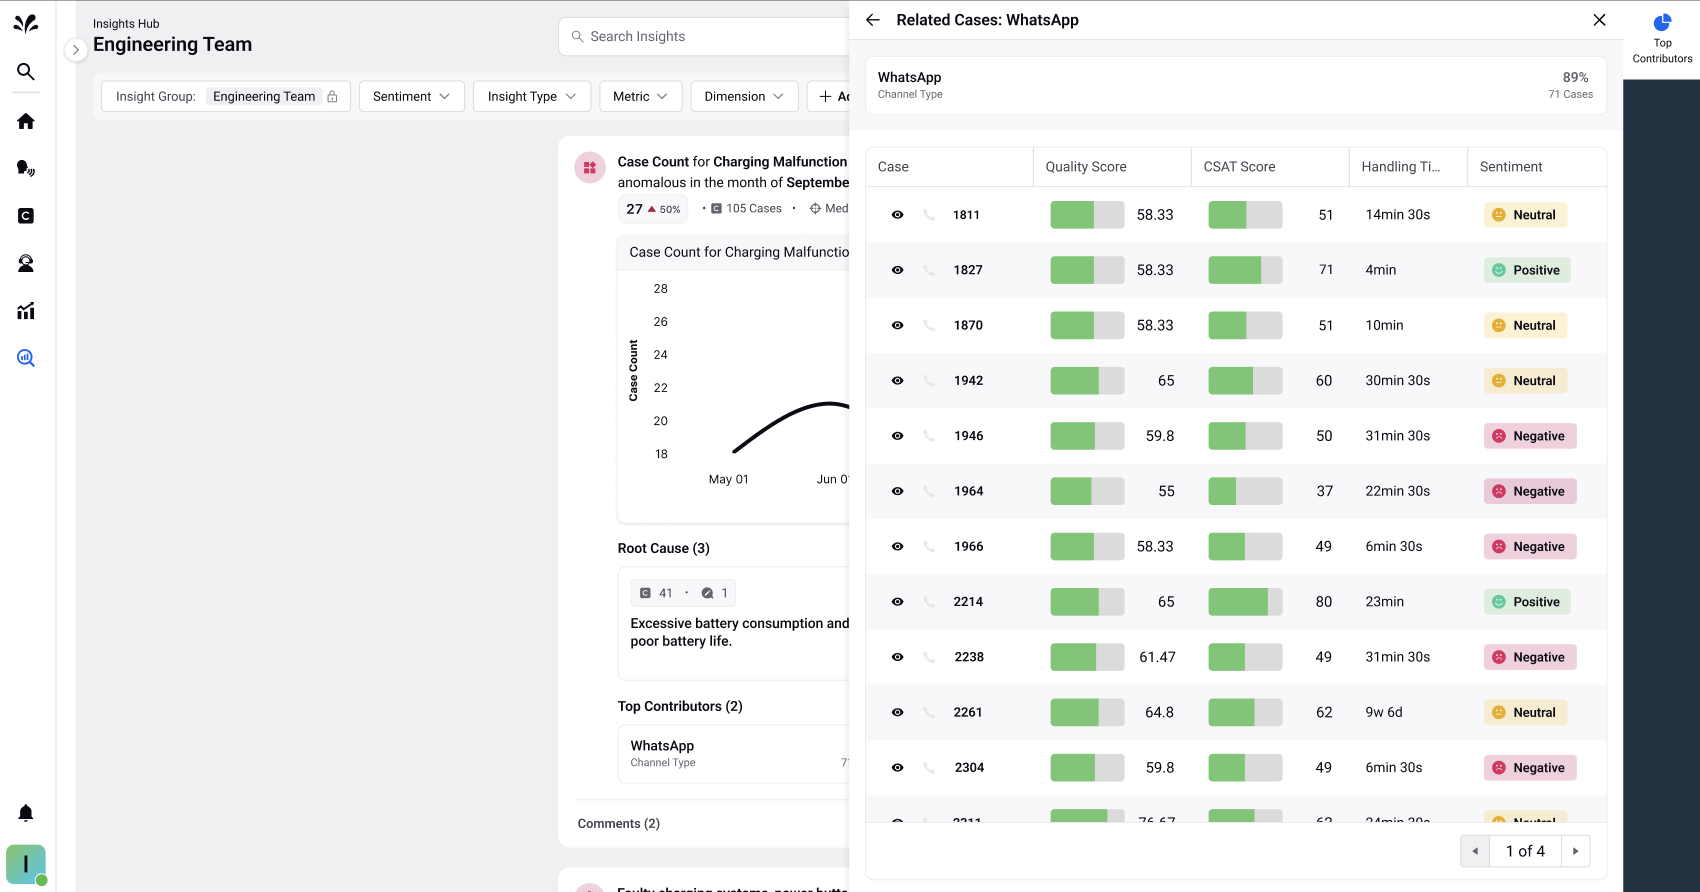
Top Contributors: Identifies the primary contributors or areas "where it is happening." For example, in this particular insight, the channel type field is set as WhatsApp for 71 cases, representing 89% of the total volume. The top contributors are derived by performing statistical analysis on the observed pattern.
Click on it to naviagte to the third pane and view associated cases.
Card Actions
The following actions are supported on Insights Card:
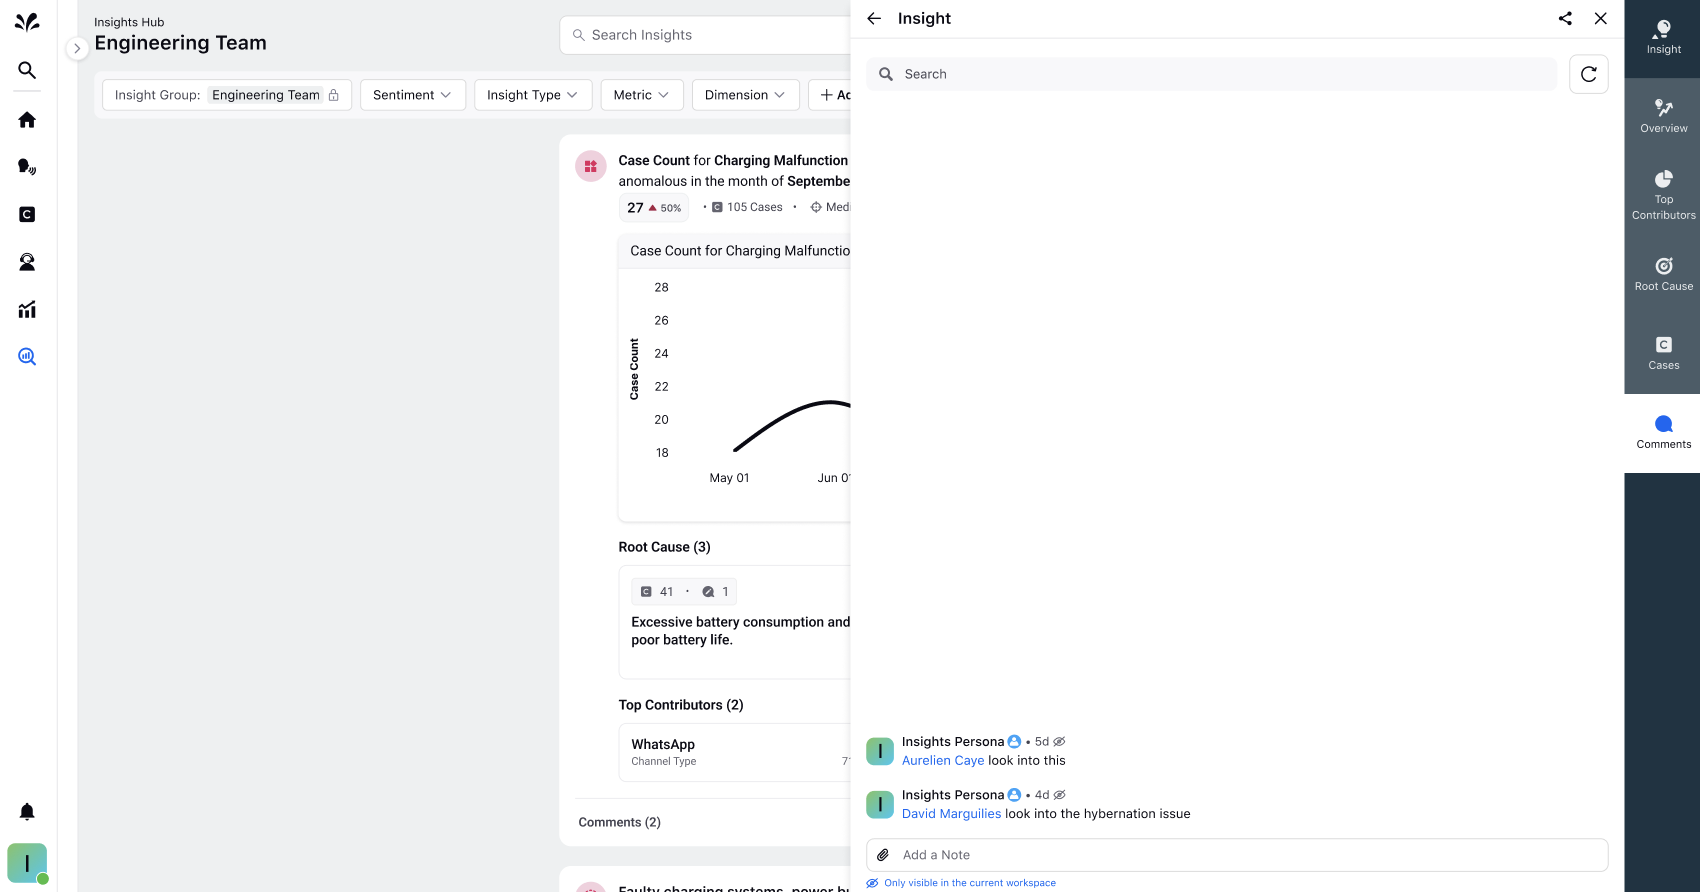
Comments
Enhance collaboration by tagging and engaging with other team members using the Comments feature. Share insights, gather feedback, and facilitate meaningful discussions within the platform.
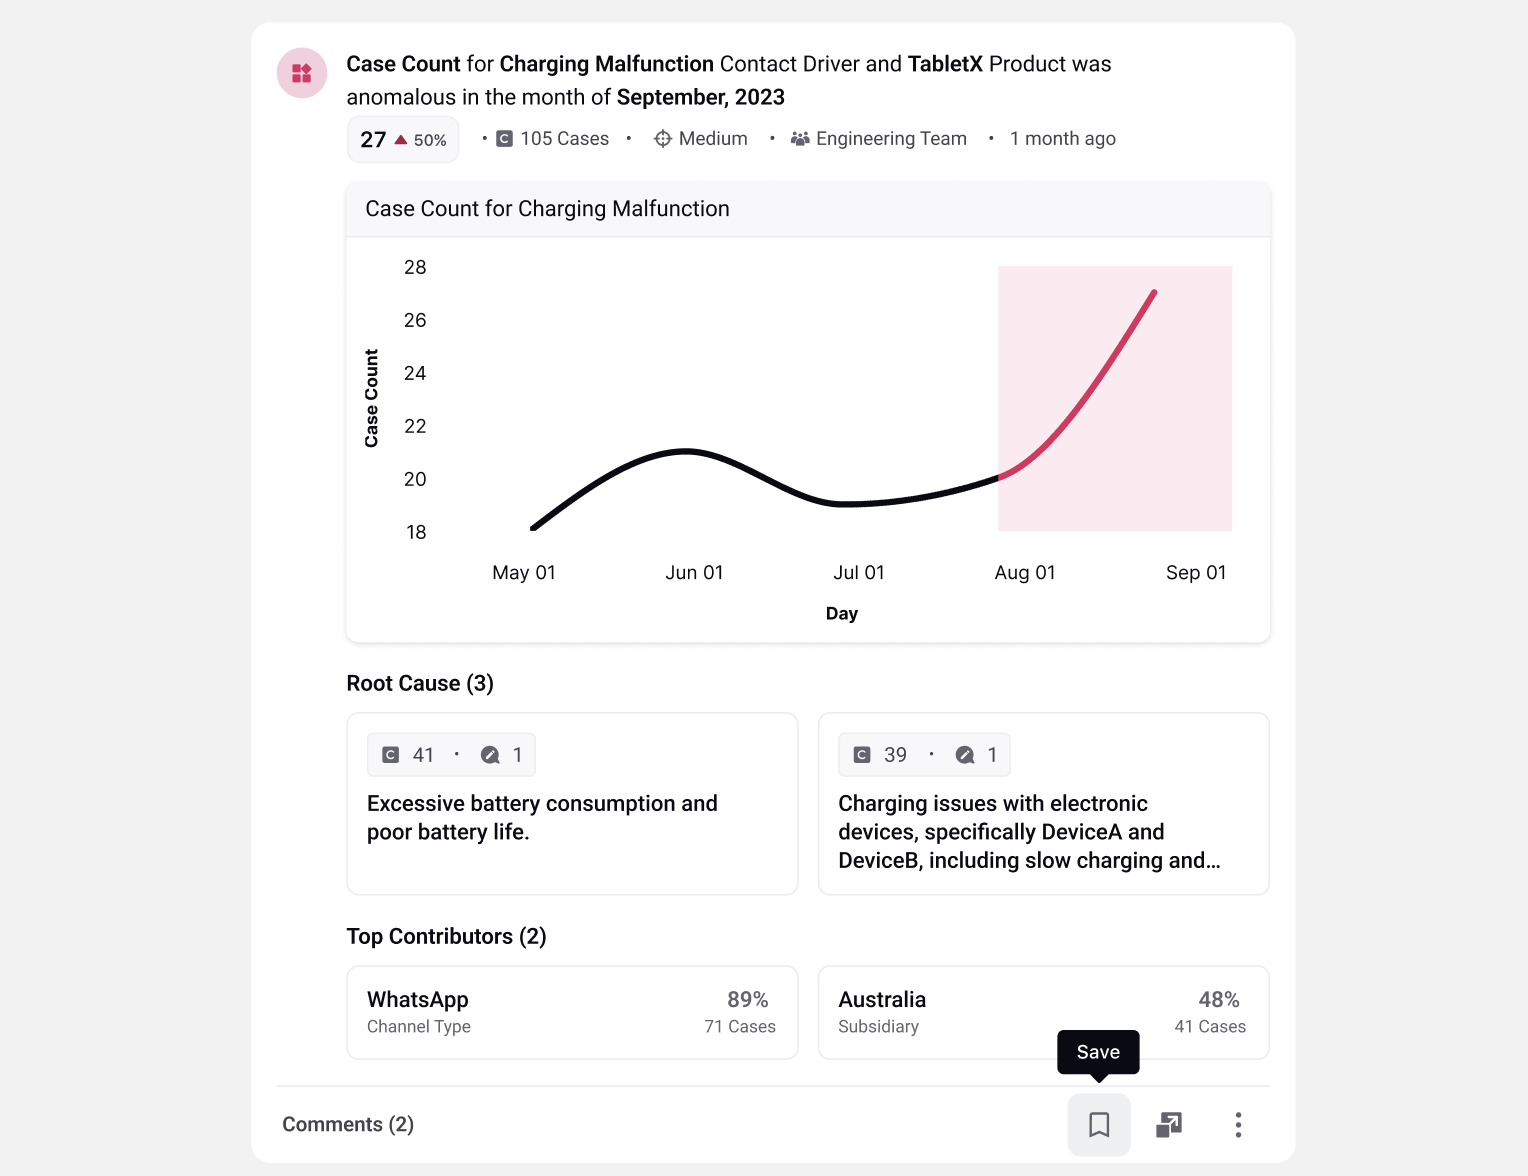
Save
You can bookmark specific insight cards for quick and convenient access within the Saved tab.
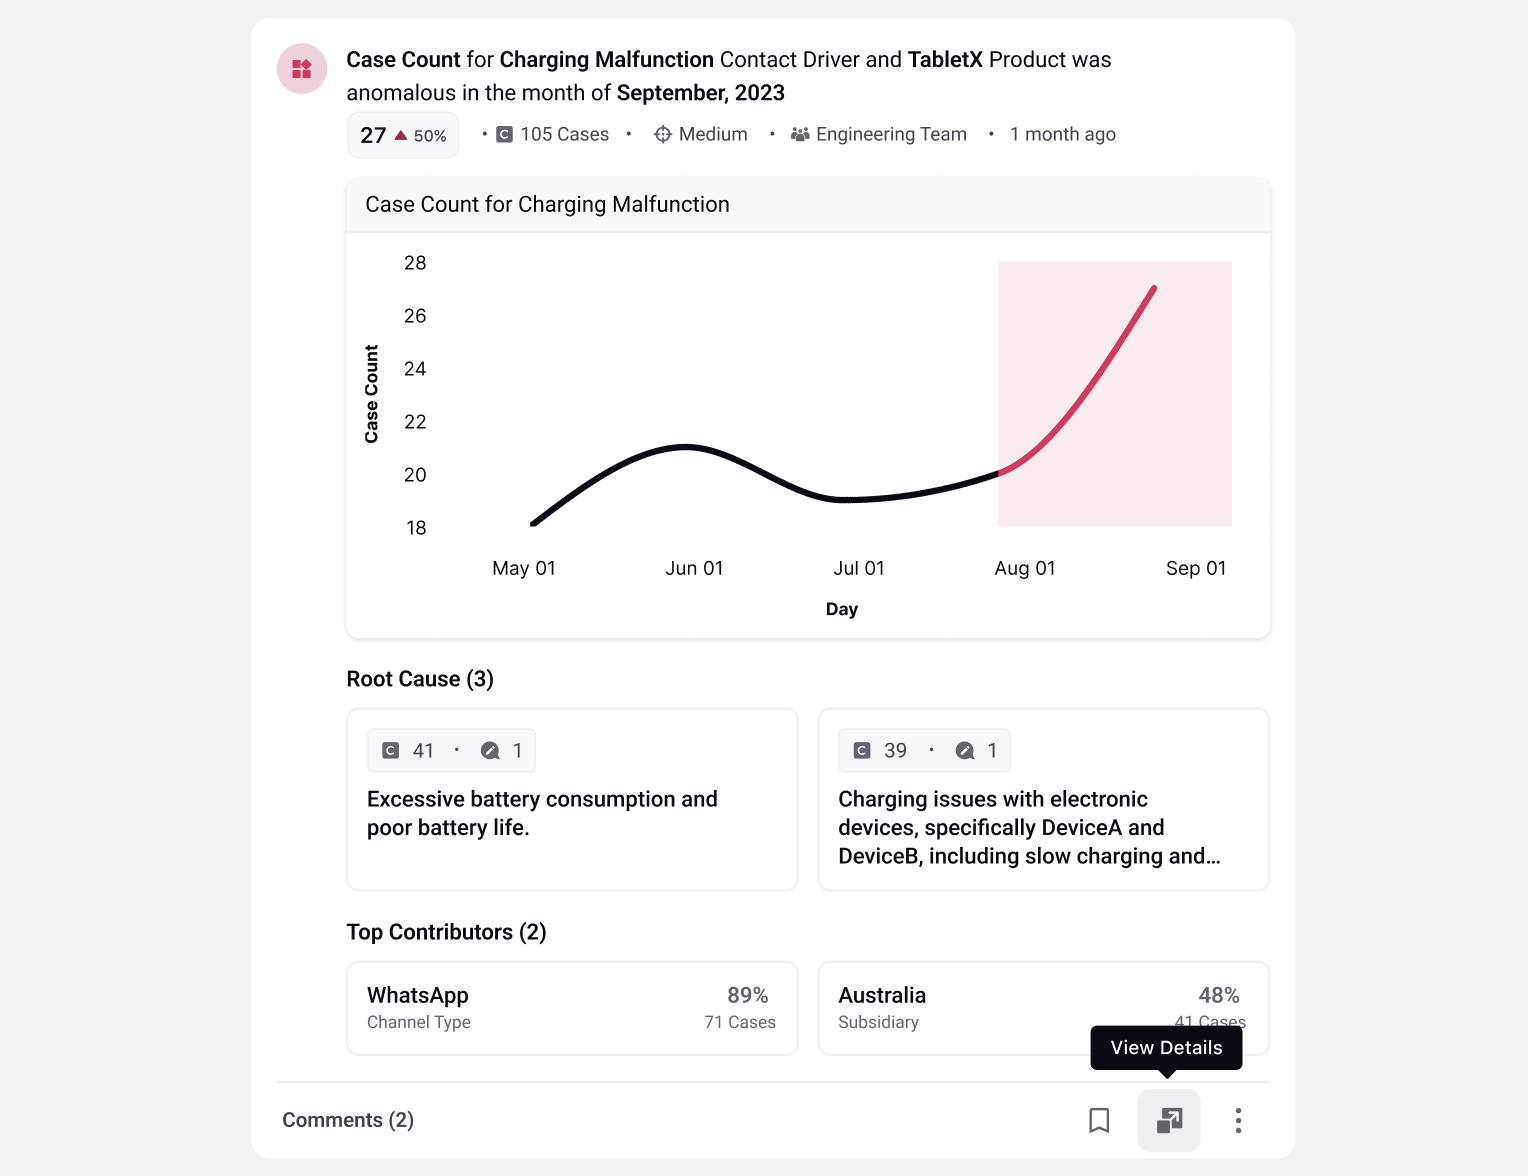
View Details
You can delve deeper into the insight's details and access root causes, top contributors, associated cases, and comments in the third pane. For more information, see Insights Third Pane.
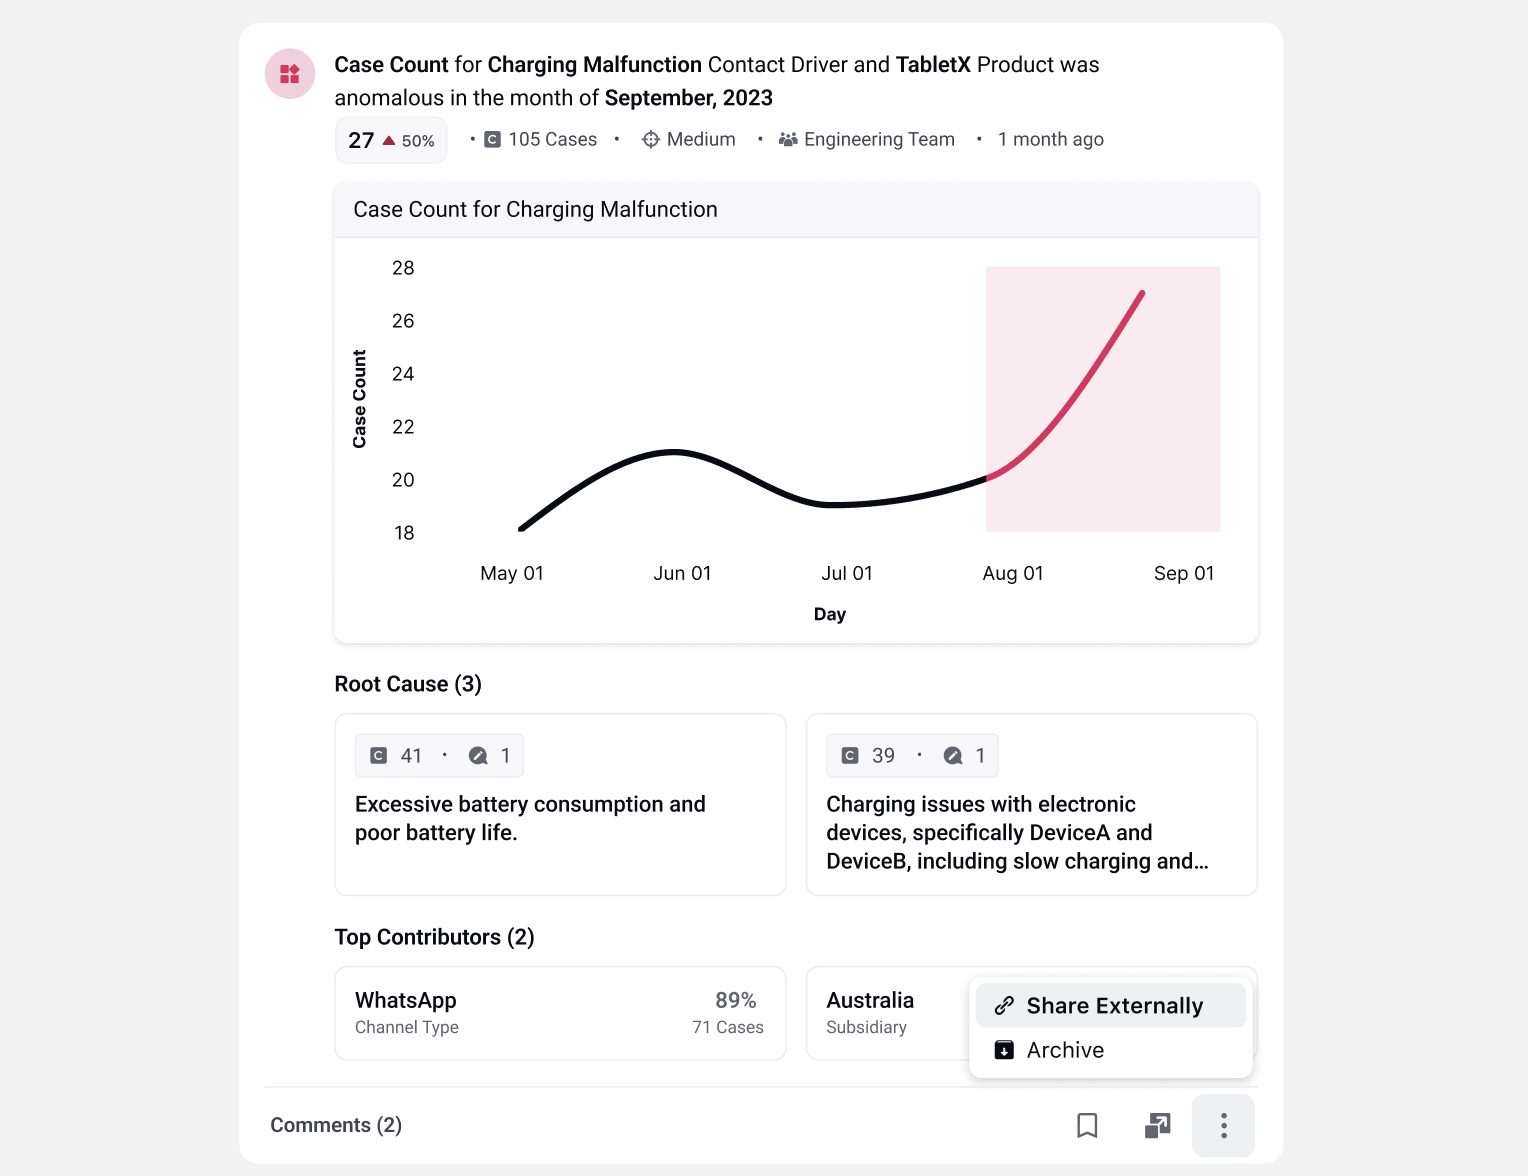
Share Externally
Click the three dots appearing at the bottom right of the card, then choose Share Externally.
You can also set an expiry date and make it password protected for added security. After configuring the settings, click "Copy Link" to copy the link to your clipboard. Additionally, you can click on "Copy Access Details" to copy both the link and the password required for accessing the shared content.
Enablement note: To learn more about getting this capability disabled in your environment, please work with your Success Manager. |
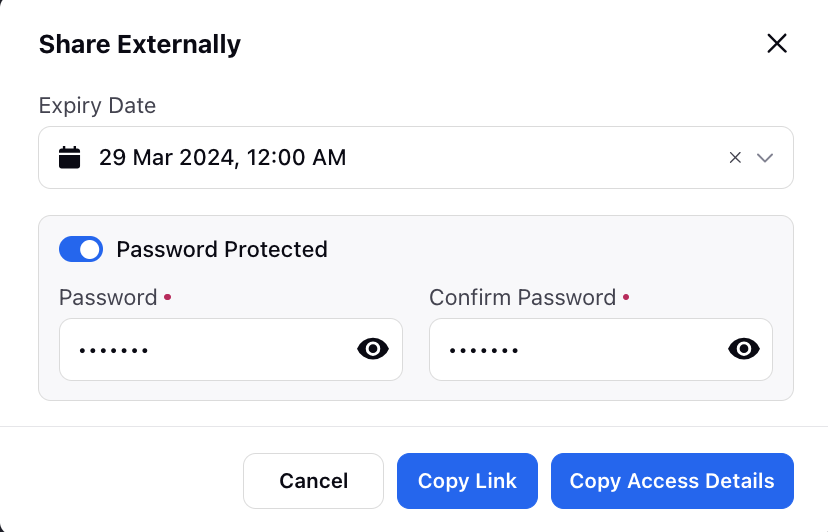
This link allows you to share insights with teams outside of Sprinklr. The actual cases and customer messages is not visible to external parties.
Archive
You can choose to archive an insight card when you no longer need it, removing it from the Home and Groups page.
Read and Unread
The Read and Unread feature allows Conversational Analytics users to manage their insights more effectively. By marking insights as read, you can easily distinguish between insights they have already reviewed and those they have not. This helps reduce information overload and ensures a smoother experience by enabling you to focus only on unread insights in subsequent sessions.
Different ways of Marking insights as Read / Unread
Insights may be marked as read or unread, either manually by the user or automatically by the system.
Manually, click the three dots appearing at the bottom right of the card, then, only one option is shown based on the current read status of the insight for that user.
Automatically, the system marks an insight as read when a user opens its detail view (third pane). This includes direct clicks on the "View Details" on the Insight, through reporting widgets in Persona App, via the Contact Driver insights banner, or from Knowledge Base article suggestions. In each case, opening the insight's detail view updates its status to read.
New and Reccuring
A New Insight is a insight that has been surfaced for the first time and has not yet been viewed or marked as read by the current user. These Insights show a label as New on the top right corner of the Insight Card.
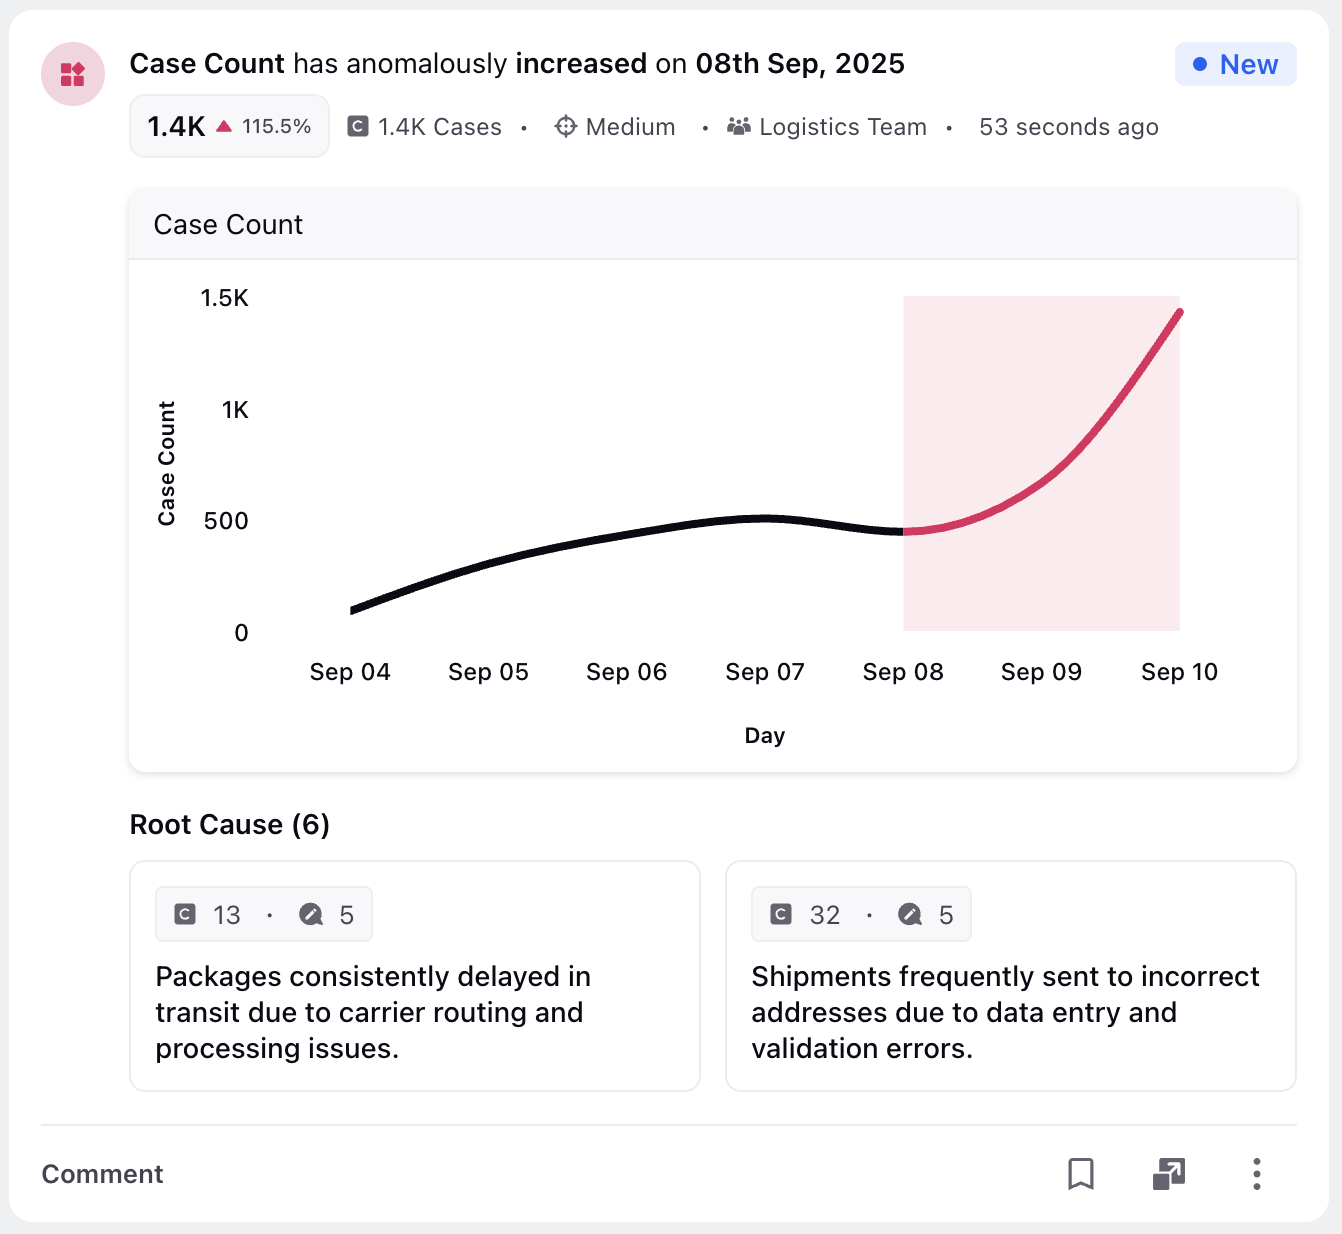
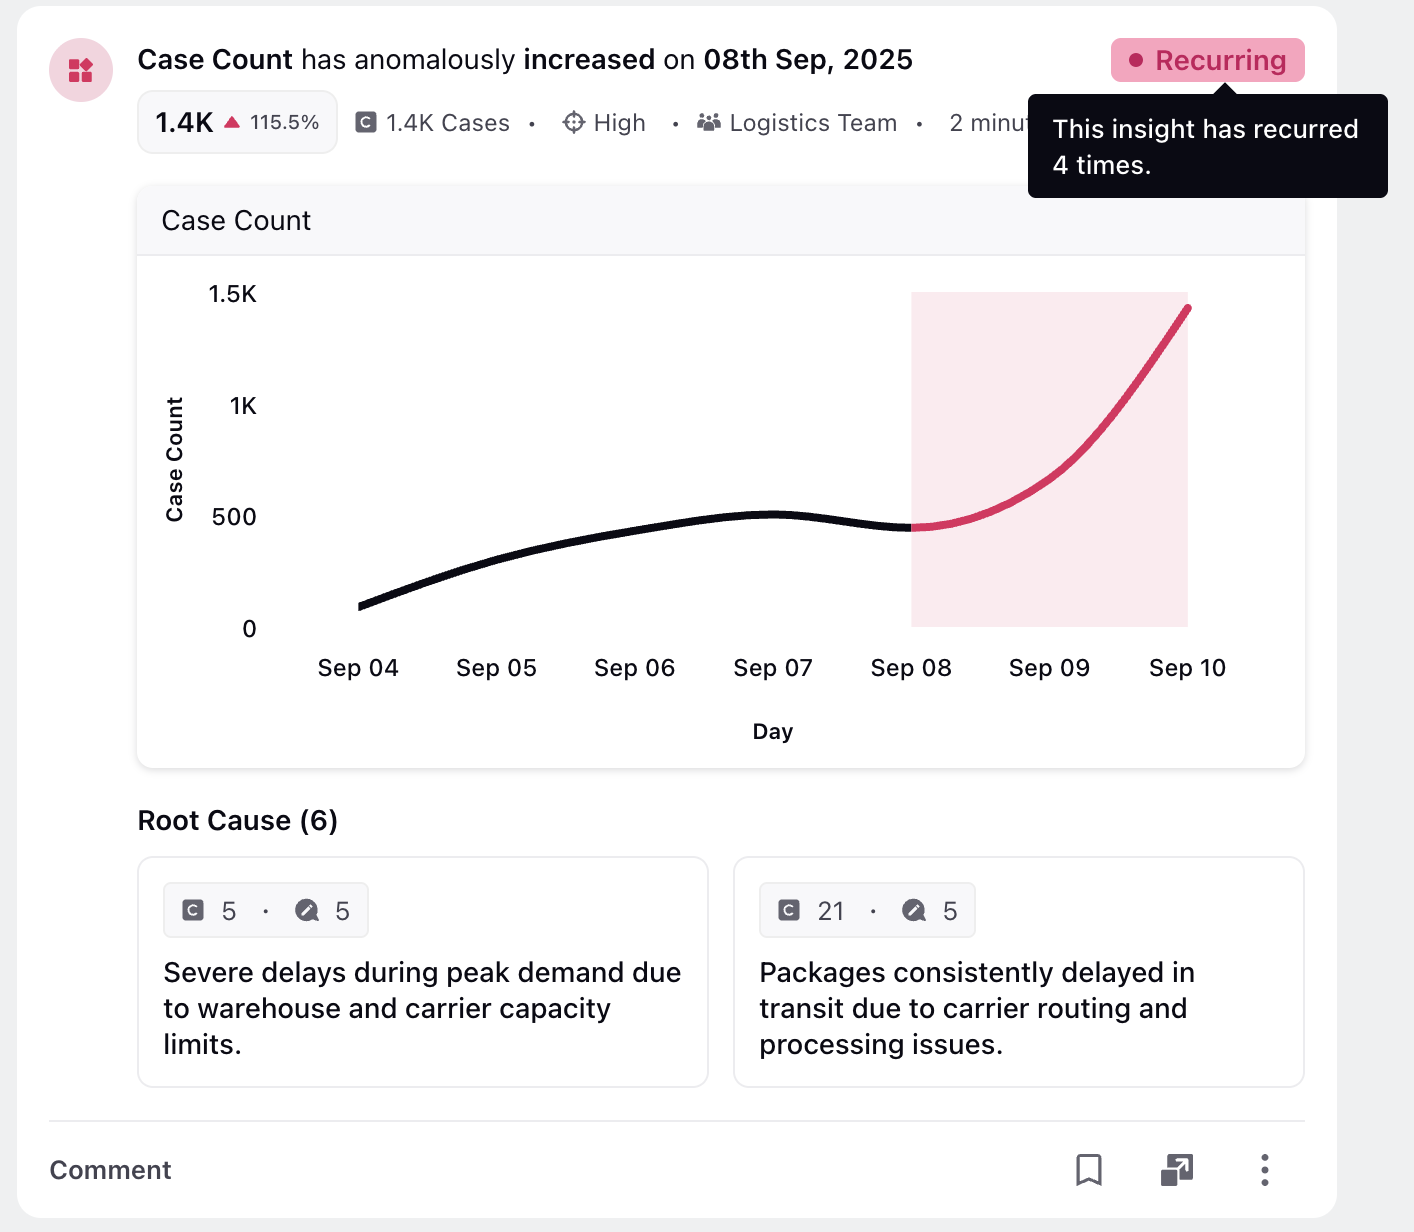
Also a Reccuring Insight is an insight that reappears over time because the same underlying issues continue to occur in the data, and the most recent instance has not yet been viewed or marked as read by the current user. These Insights show a label as Recurring on the top right corner of the Insight Card.
Hovering over the Recurring label shows the user how many times the Insight has recurred.
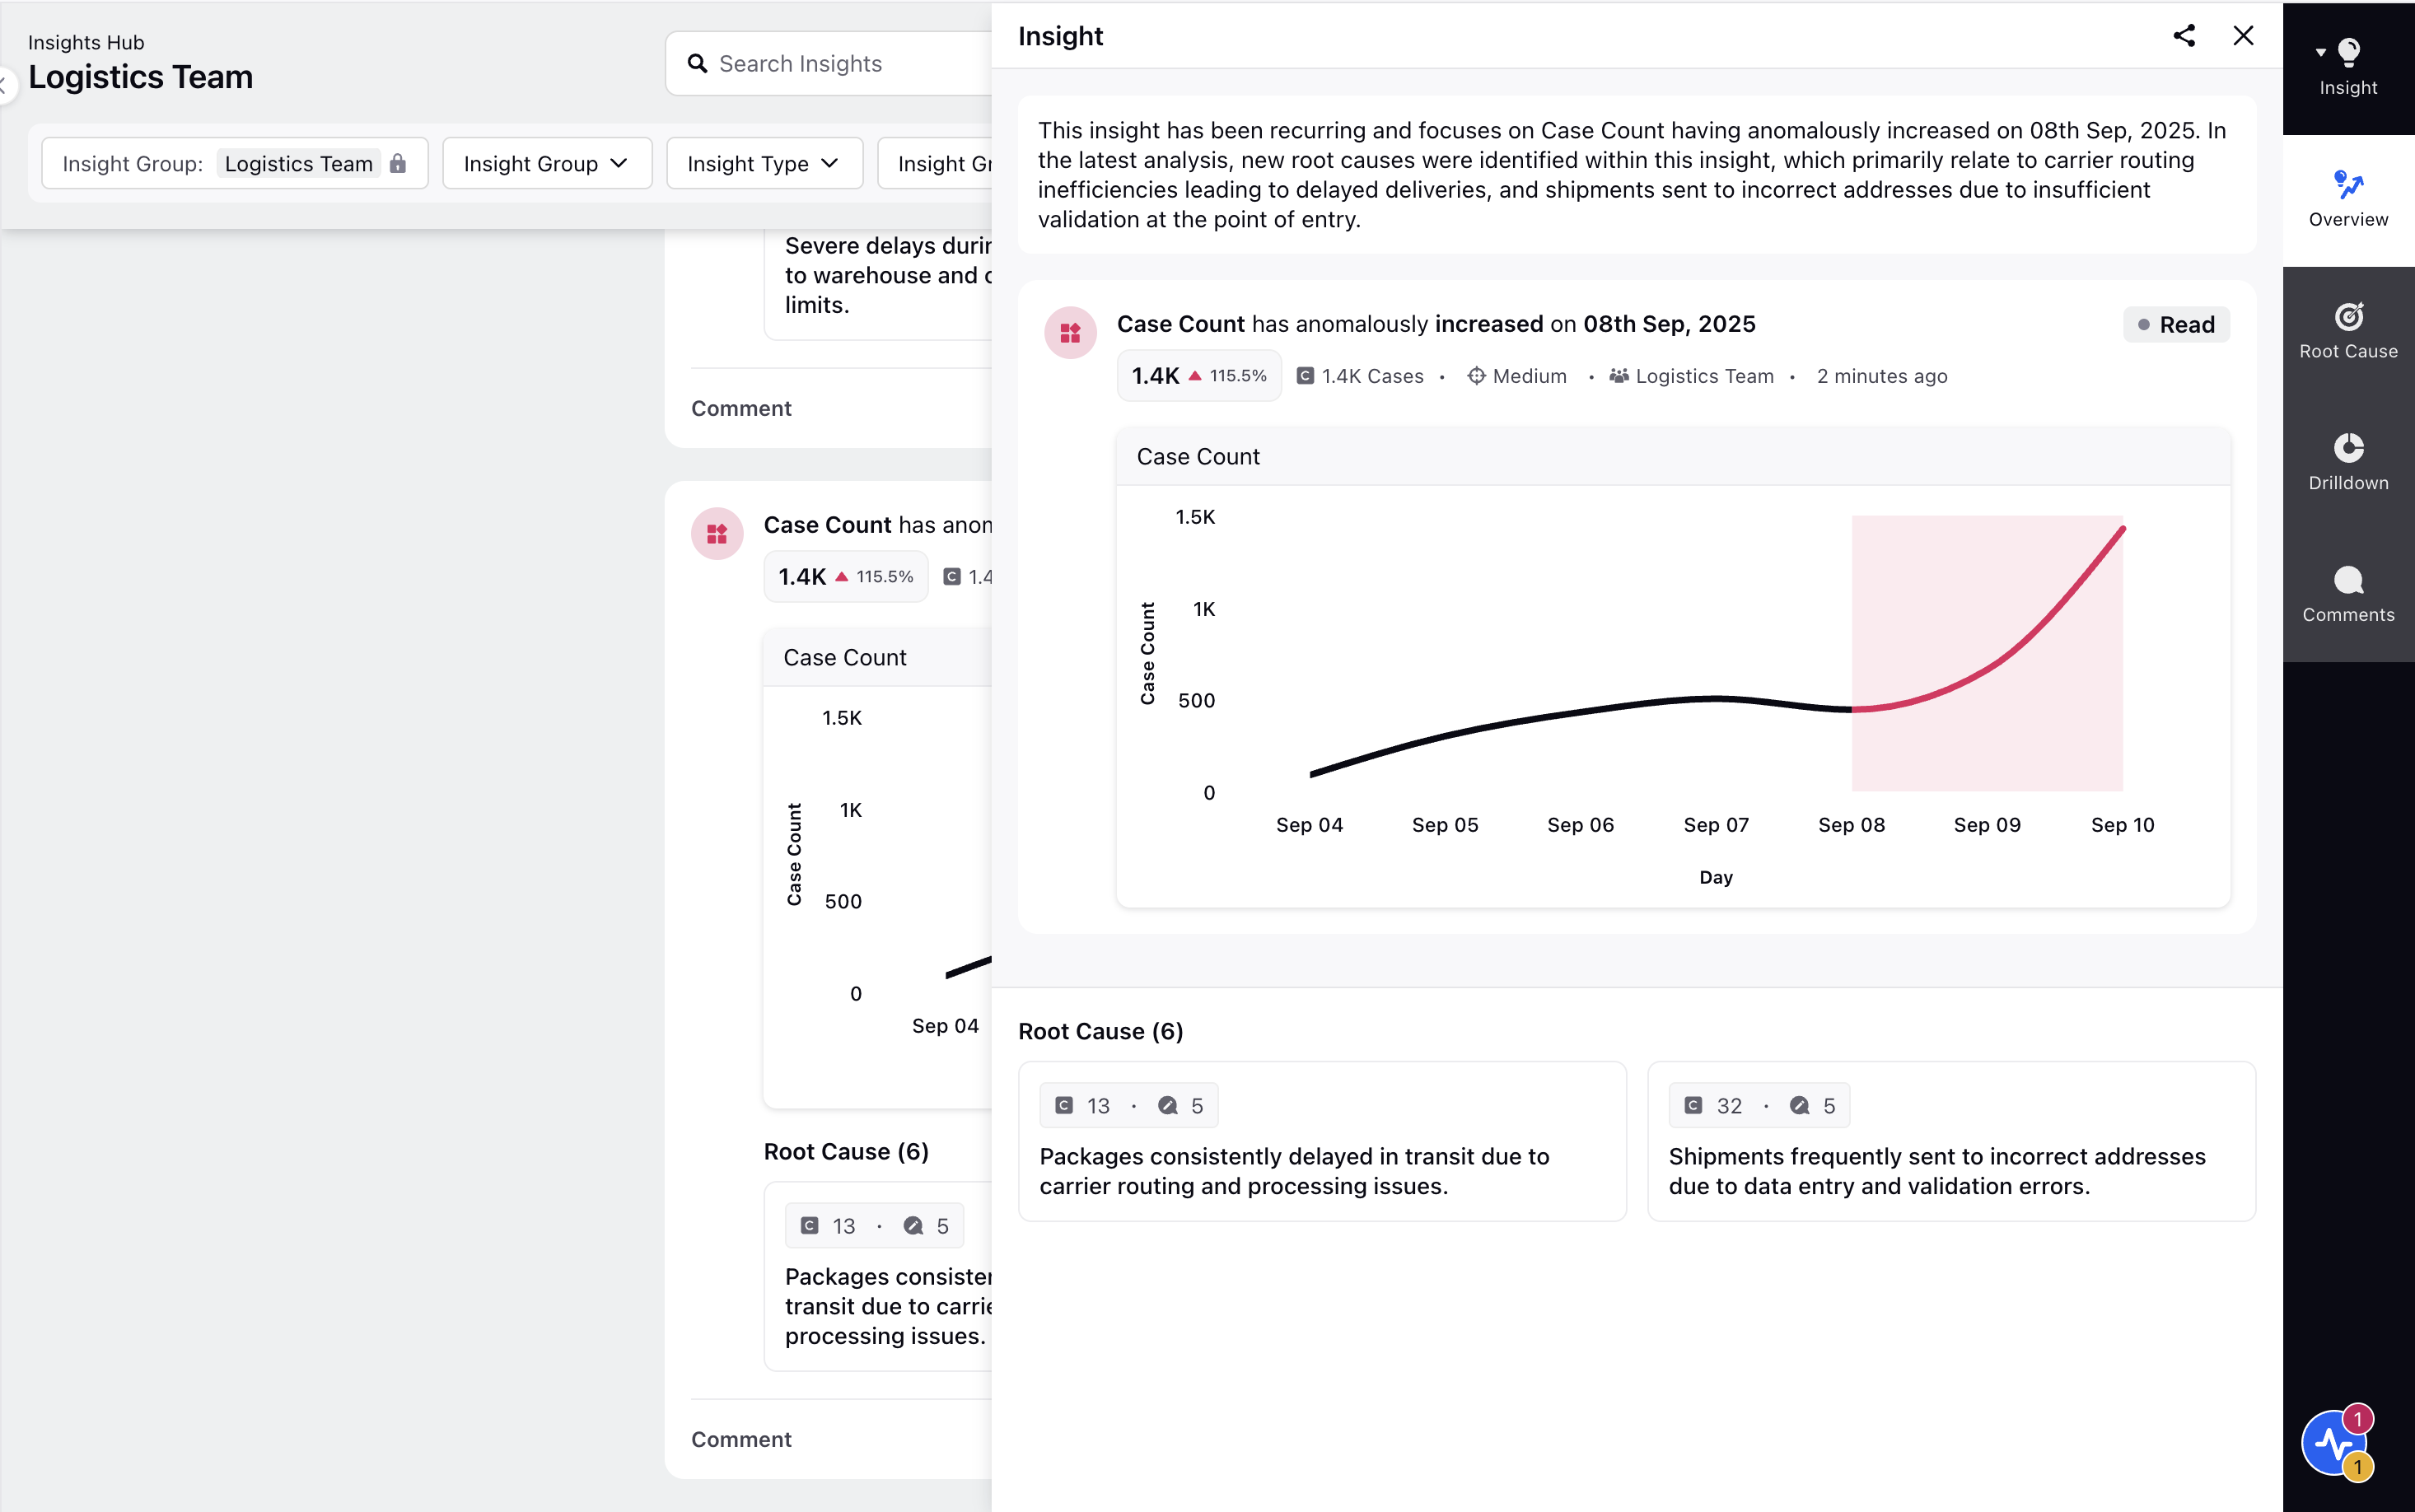
The Insight Overview tab of the View Details pane includes a concise summary highlighting what has changed or been updated since the insight was last triggered. The summary is shown only in case of recurring Insights.
View Insight Content in Your Local Language
Use View Translation to display supported AI-generated insight content in the language associated with your platform or browser locale. You can translate insights from the Insights Hub page, an individual insight card, or the insight details pane.
The original insight content is generated in English. Insights Hub automatically determines the target language from your locale, so you don't need to select a language.
Translate Insights From the Insights Hub Page
Use the translation control in the Insights Hub toolbar to translate supported content across the page.
- Open Insights Hub.
- In the page toolbar, select the Translation icon.
- Review the translated content on the insight cards.

The translated view can include insight titles, root causes, and other supported AI-generated content. Charts, case information, and metric or dimension names remain unchanged.
 Note: A badge on the Translation icon can indicate that the page-level translation option is active.
Translate Content From an Insight Card
You can translate an individual insight from the insight card menu.
- Locate the insight in Insights Hub.
- Select More options on the insight card.
- Select View Translation.

The supported AI-generated content on the insight card appears in the language associated with your locale.
To return to the English content:
- Select More options on the translated insight card.
- Select View Original.

Translate Content in the Insight Details Pane
You can also translate content while reviewing an insight in the details pane.
- Open an insight.
- In the details pane header, select the View Translation icon.

A tooltip identifies the icon as View Translation. Supported insight content appears in the language associated with your locale.
To return to the English content, select View Original.
Content That Is Translated
Insights Hub translates the following AI-generated content:
- Insight title
- Description
- Formatted description
- Recommendations
- Actionable insight title and description
- Root cause title and description
Content That Remains Unchanged
The translation action doesn't translate the following content:
- Static UI text and system labels
- Case details
- Infographics and charts
- Metric names
- Dimension names
For example, a translated insight can display its title and root cause descriptions in the locale language while the Case Count metric and chart labels remain in their original form.
Note: Localized interface labels and translated insight content are separate. The application interface can already display localized labels based on the platform locale. View Translation applies specifically to supported AI-generated insight content.
Translation Availability
The View Translation option appears only when Insights Hub detects a supported non-English locale.
The option isn't available when:
- Your locale is English.
- Insights Hub can't determine your locale.
- The translation service doesn't support the language associated with your locale.
You can't manually select a different translation language.