Leadership Dashboard
Updated
This report summarizes the overall Inbound and Outbound call center performance that are necessary for a leadership view.
Inbound KPIs
Total Calls Funnel View
This is a funnel level view of all the major call centre KPIs for a quick reference.
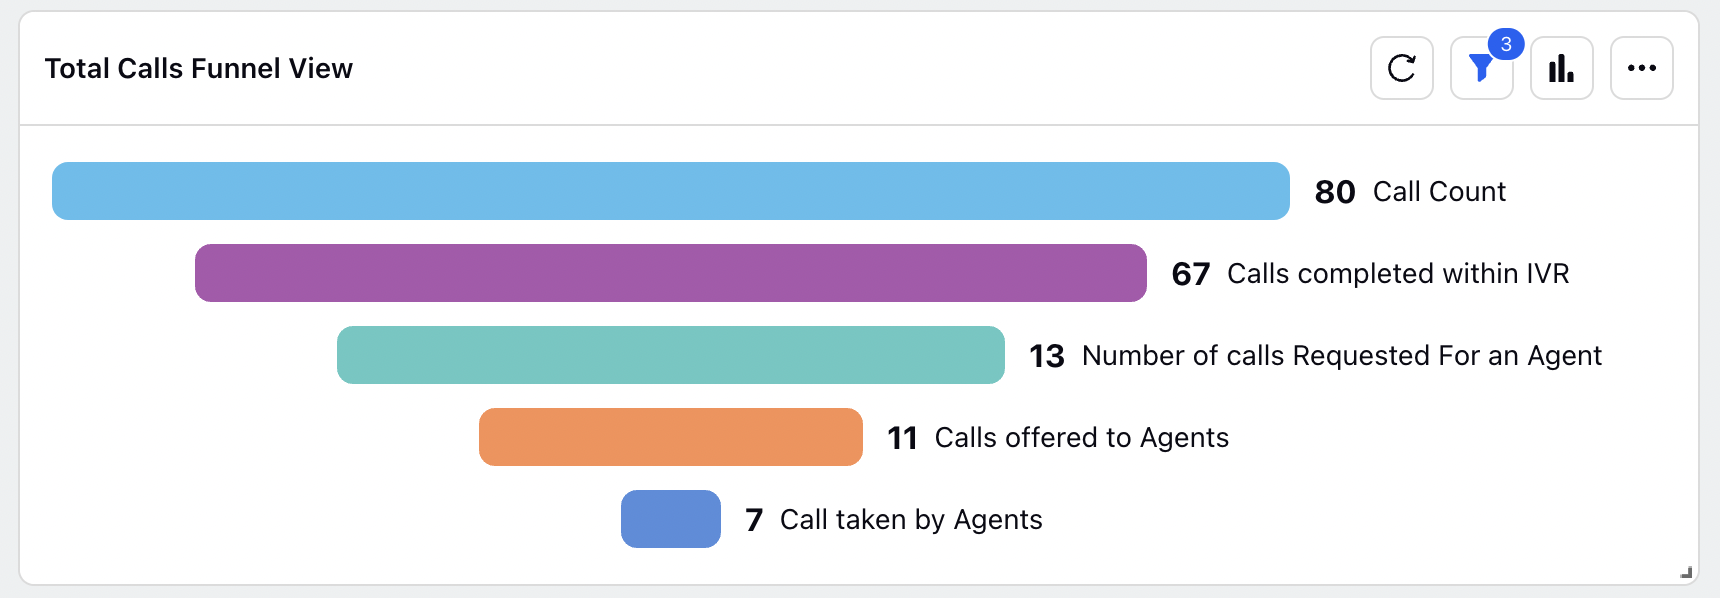
Call Count - Total Inbound Calls that landed to the IVR
Calls completed within IVR - Total number of calls that were completed within IVR
Number of calls requested for an agent: Number of calls that were requested to connect with an agent
Calls offered to Agents - Number of calls which were offered to agent to connect
Calls taken by Agents - Calls which are accepted by agent and customer and agent are both connected on the call
Total Call Count Trend
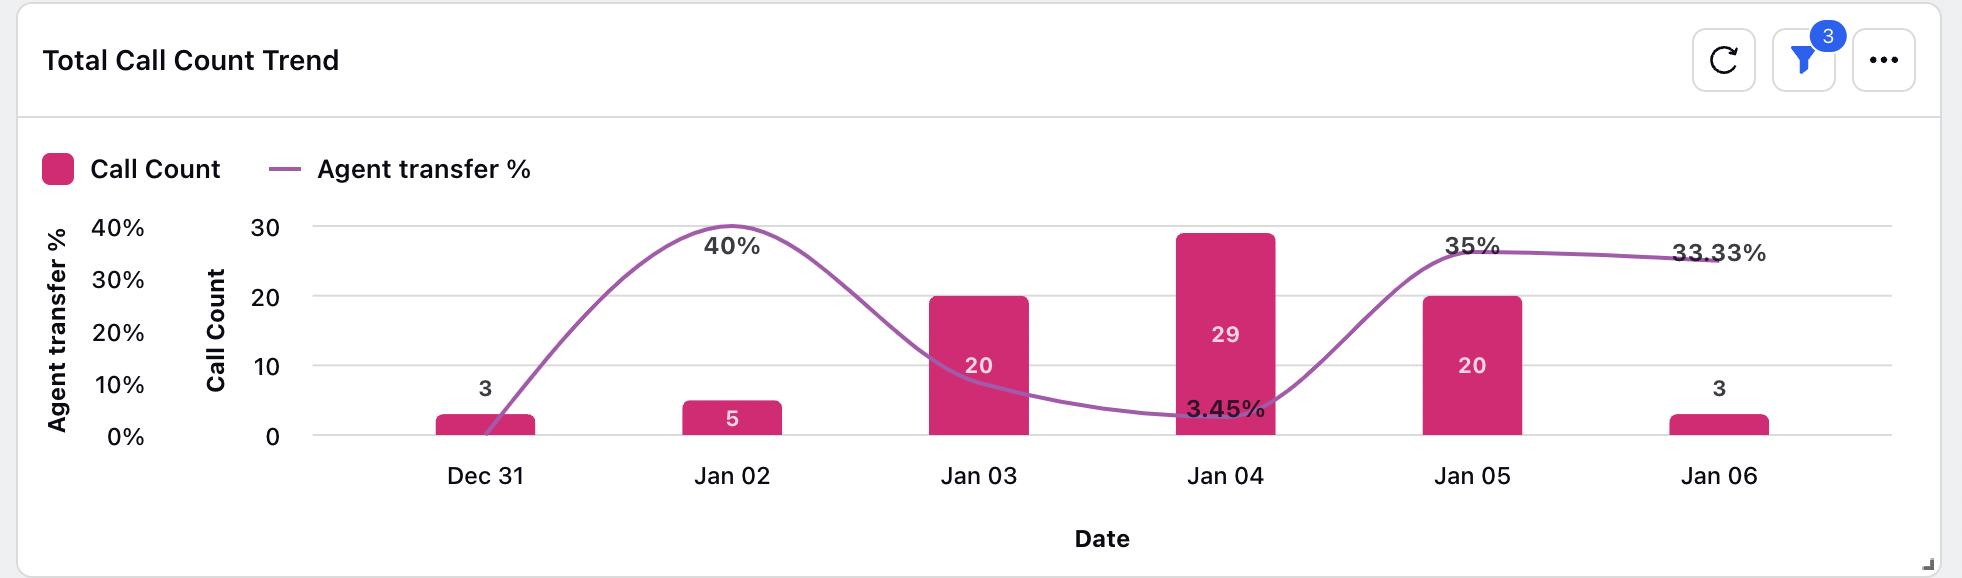
Call Count - Day wise trend of total inbound calls that landed to the IVR
Agent Transfer % - % of calls which have been transferred to the agents i.e number of calls requested for an agent / inbound call count
Unique Customers Summary
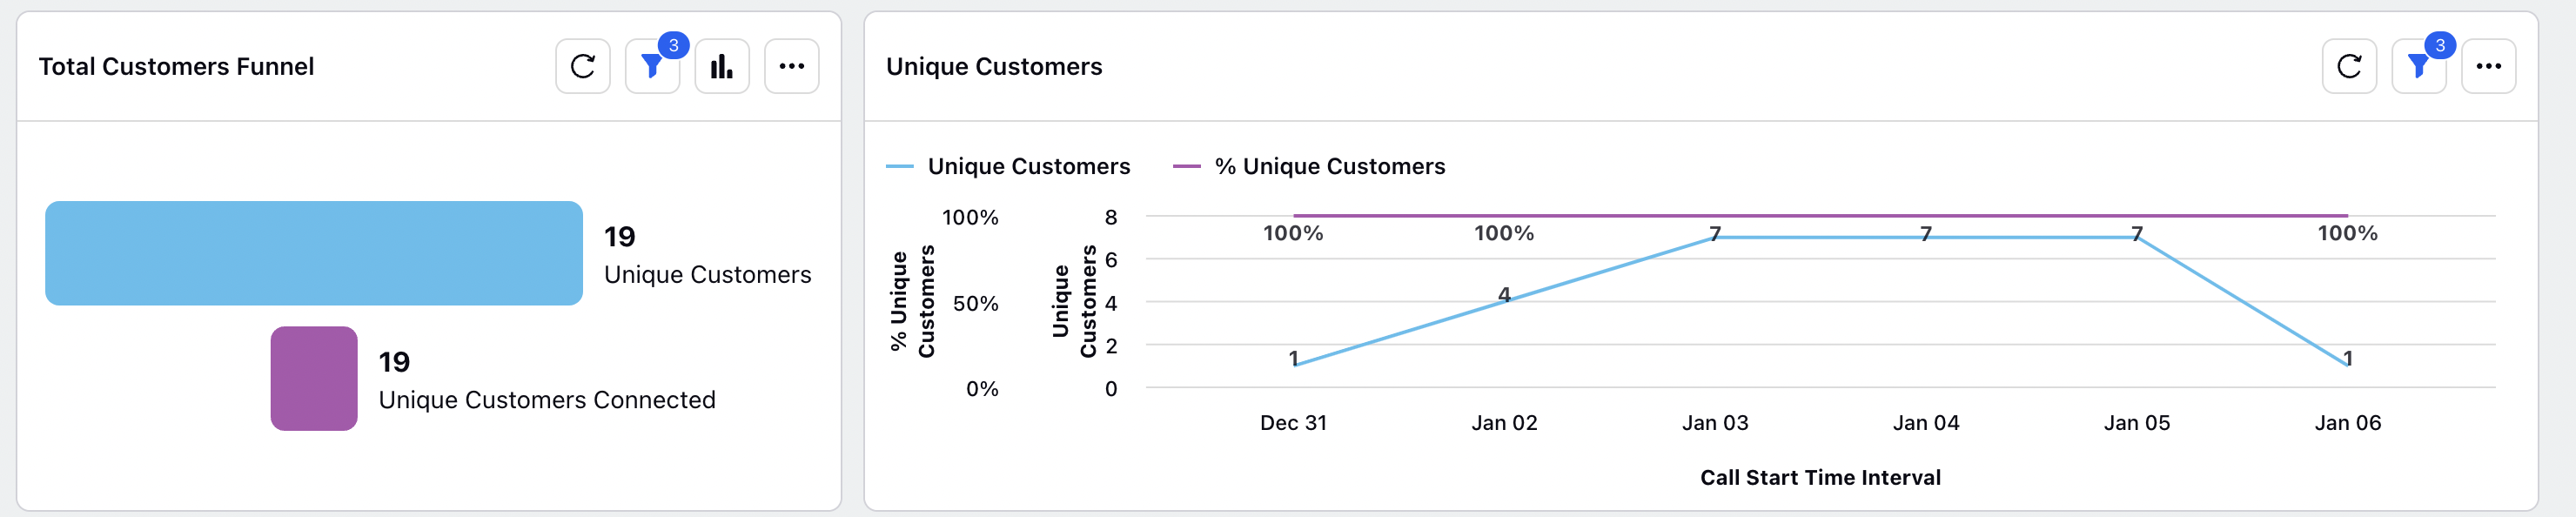
Unique Customers - Unique customer phone numbers that were dialed to IVR
Unique Customers Connected - Unique customer phone numbers that were connected to the agents
% Unique Customers Connected - Daily Trend of % of unique customers that were connected to the agents
% Abandoned and Trend
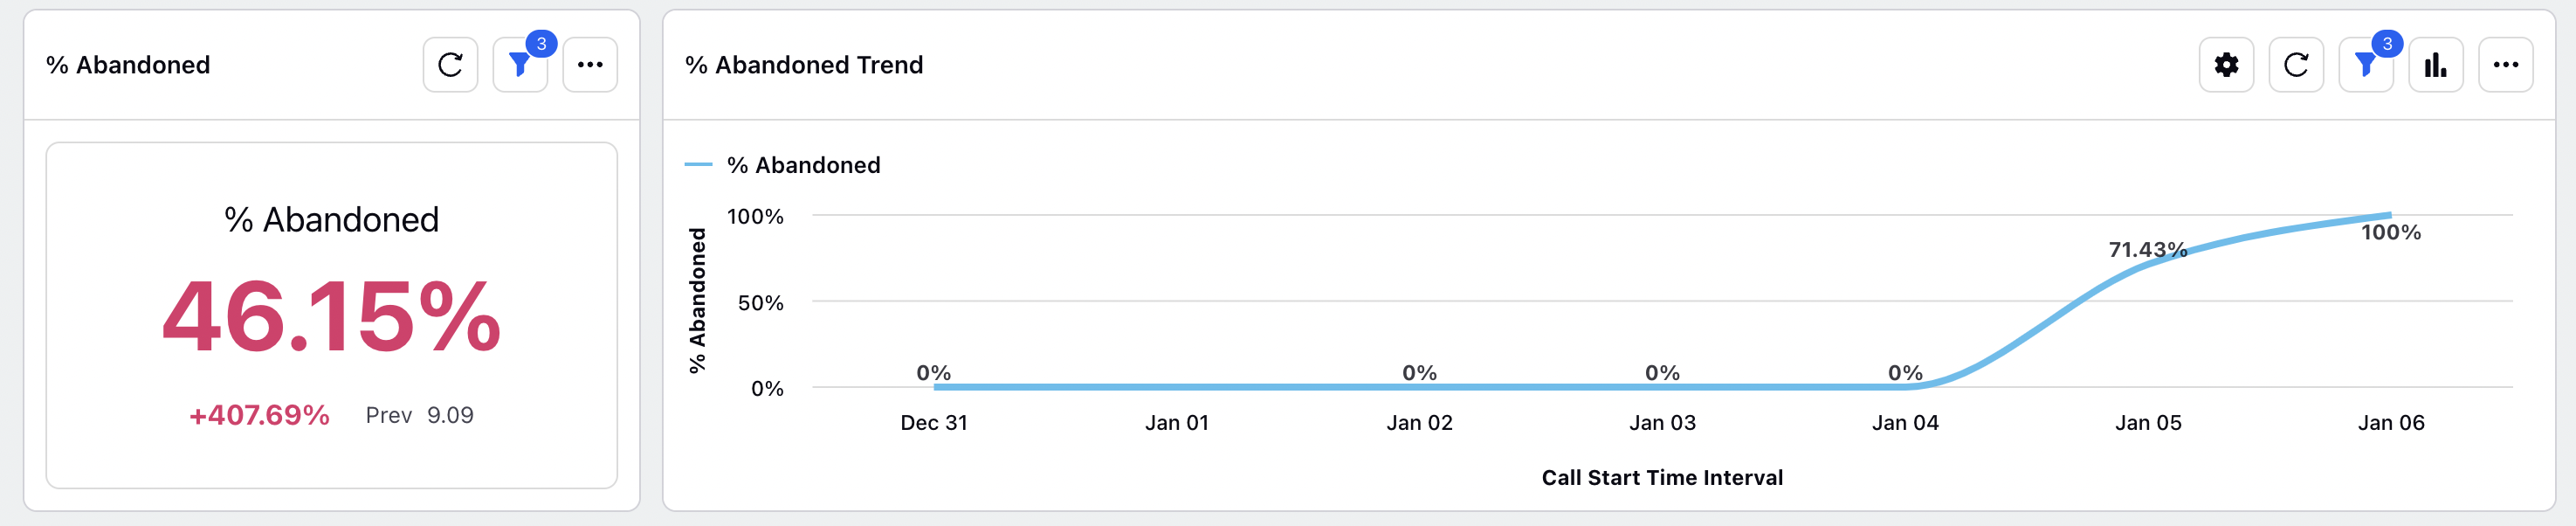
% Abandoned - % of calls which were abandoned after requesting for an agent i.e ( number of calls requested for an agent - calls taken by agent ) / inbound call count
% Abandoned Trend - Daily trend of % abandoned calls
SLA and Agent Count Summary / Trend
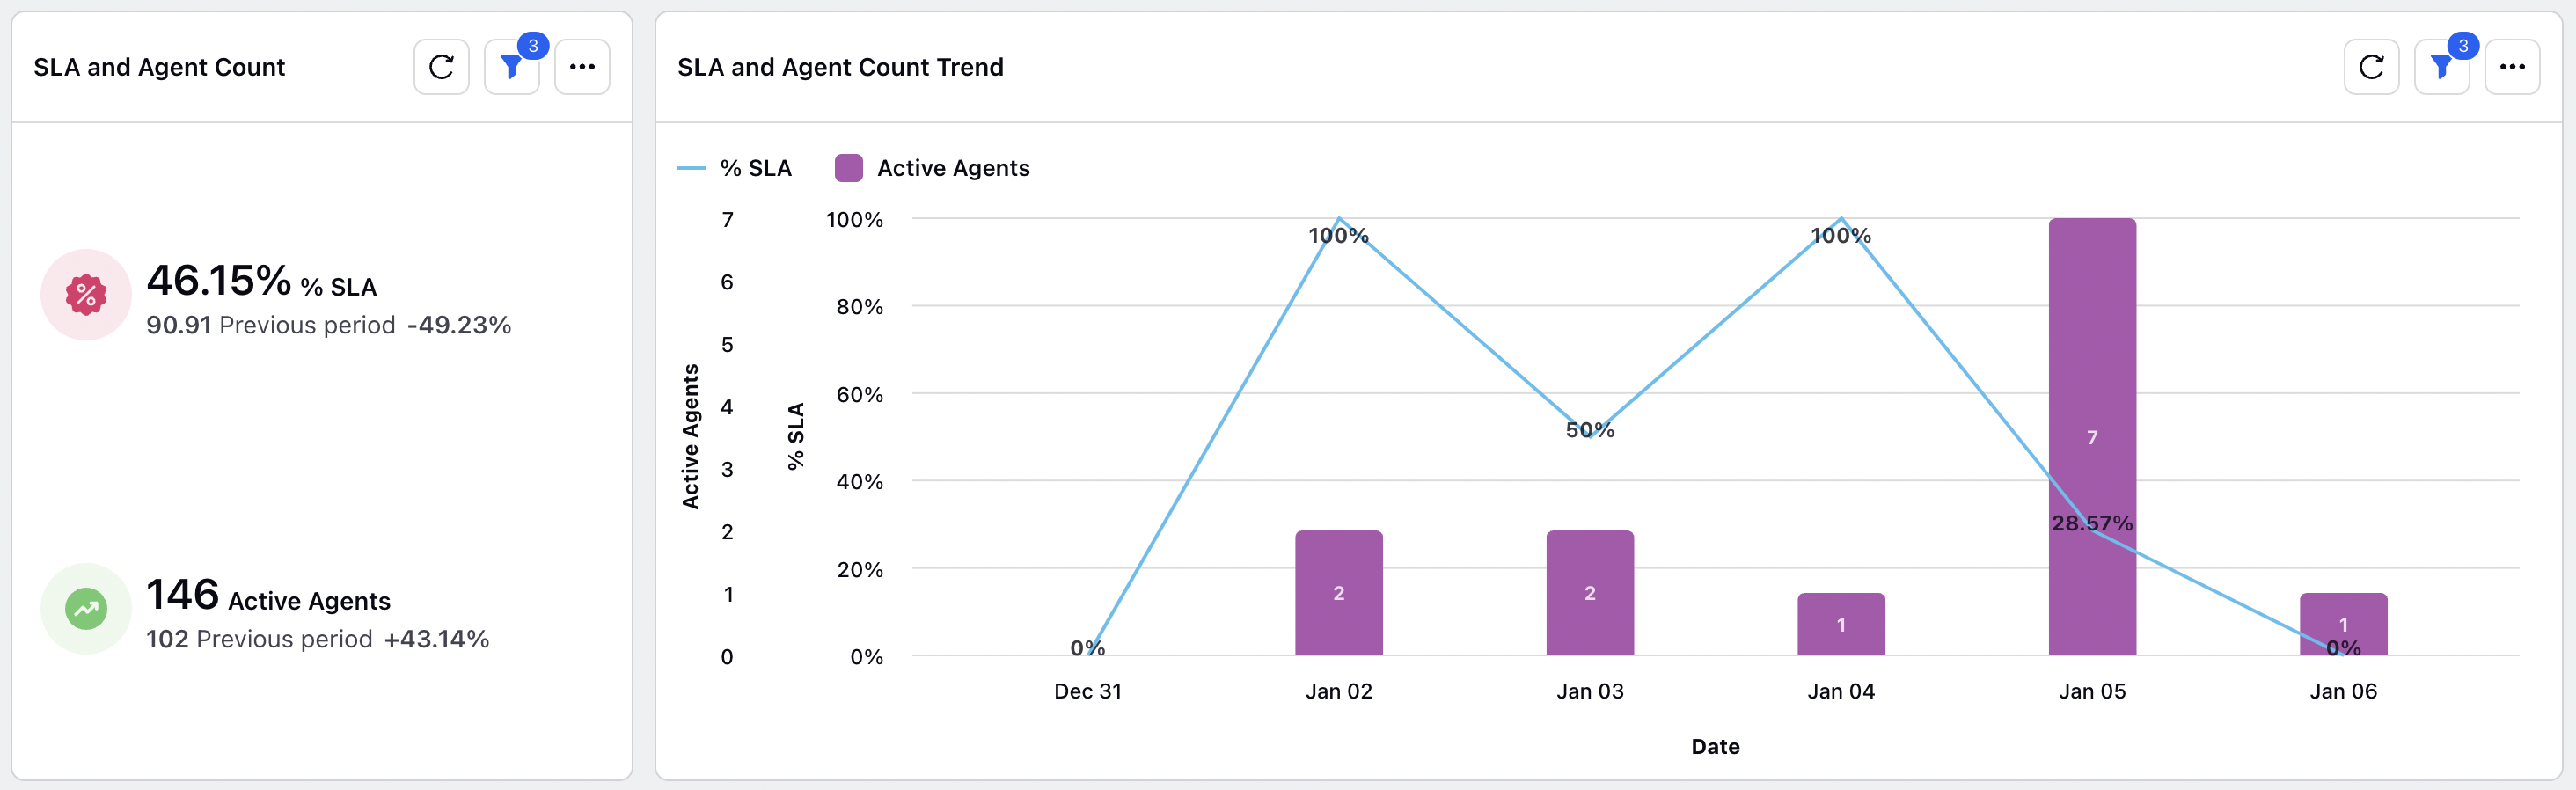
% SLA - Number of calls answered within SLA / Number of calls requested for an agent - Number of calls abandoned within SLA. *SLA preset is configurable and can be changed
Active Agents - Count of agents active to connect with the customers on the call
Average Handle Time Summary / Trend
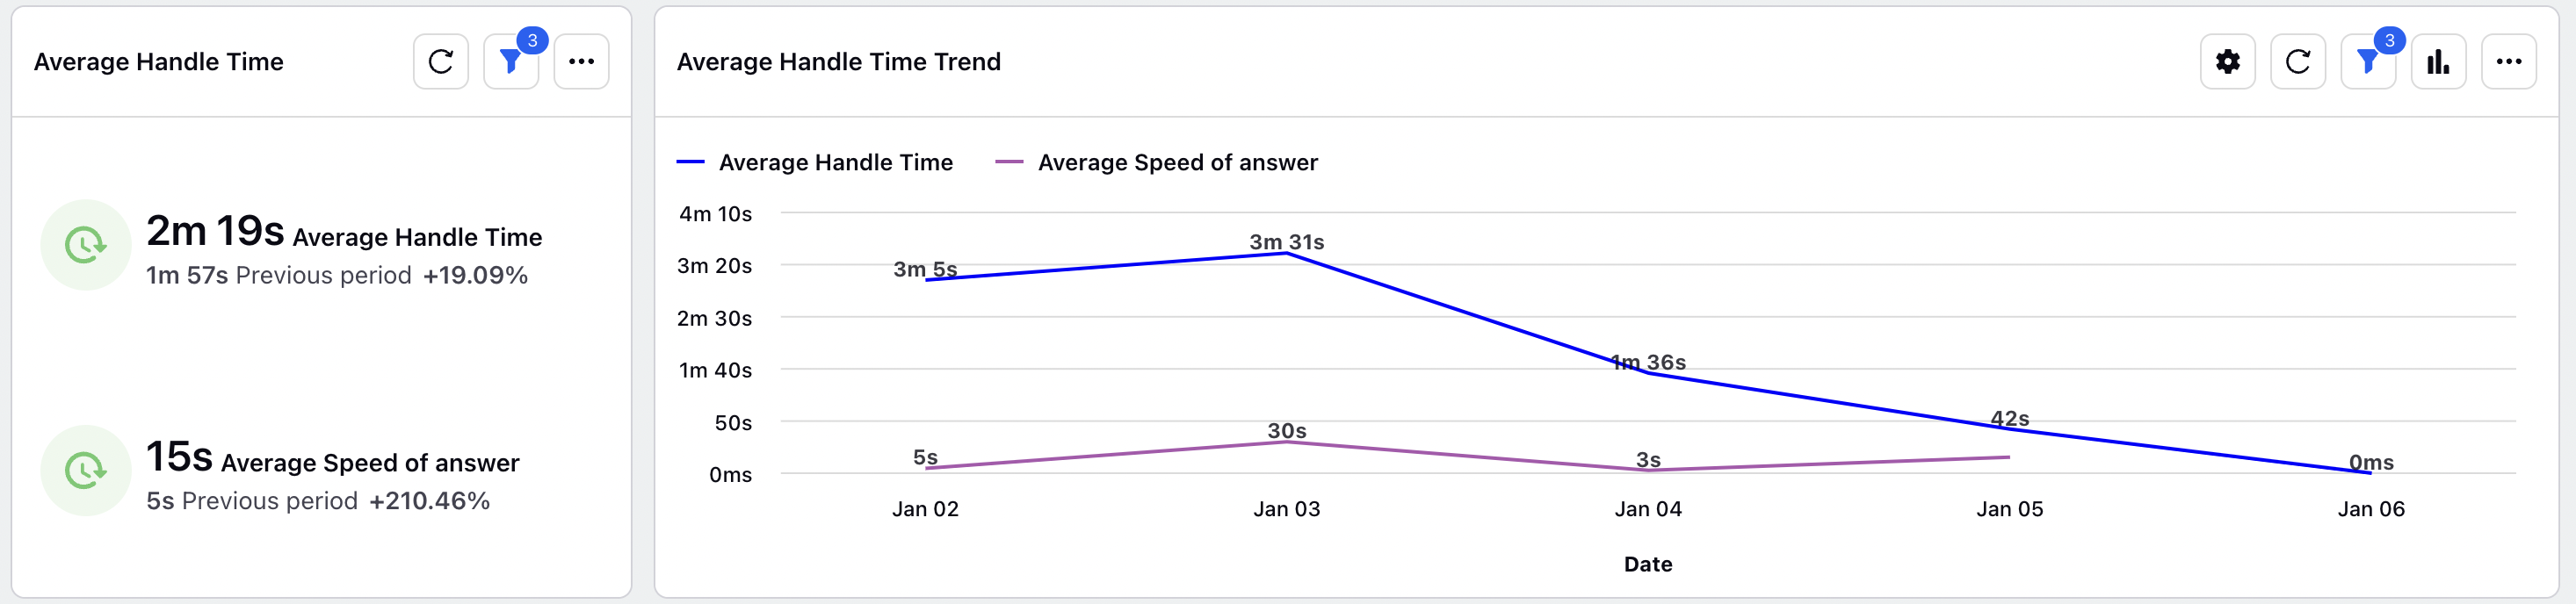
Average Handle Time - Average time taken to handle the customer on the inbound call ( handle time = talk time + hold time + after call wrap up time)
Average Speed of Answer - Average time taken by the agent to connect with the customer post the customer requests to connect with the agent
Overall Call Centre KPIs
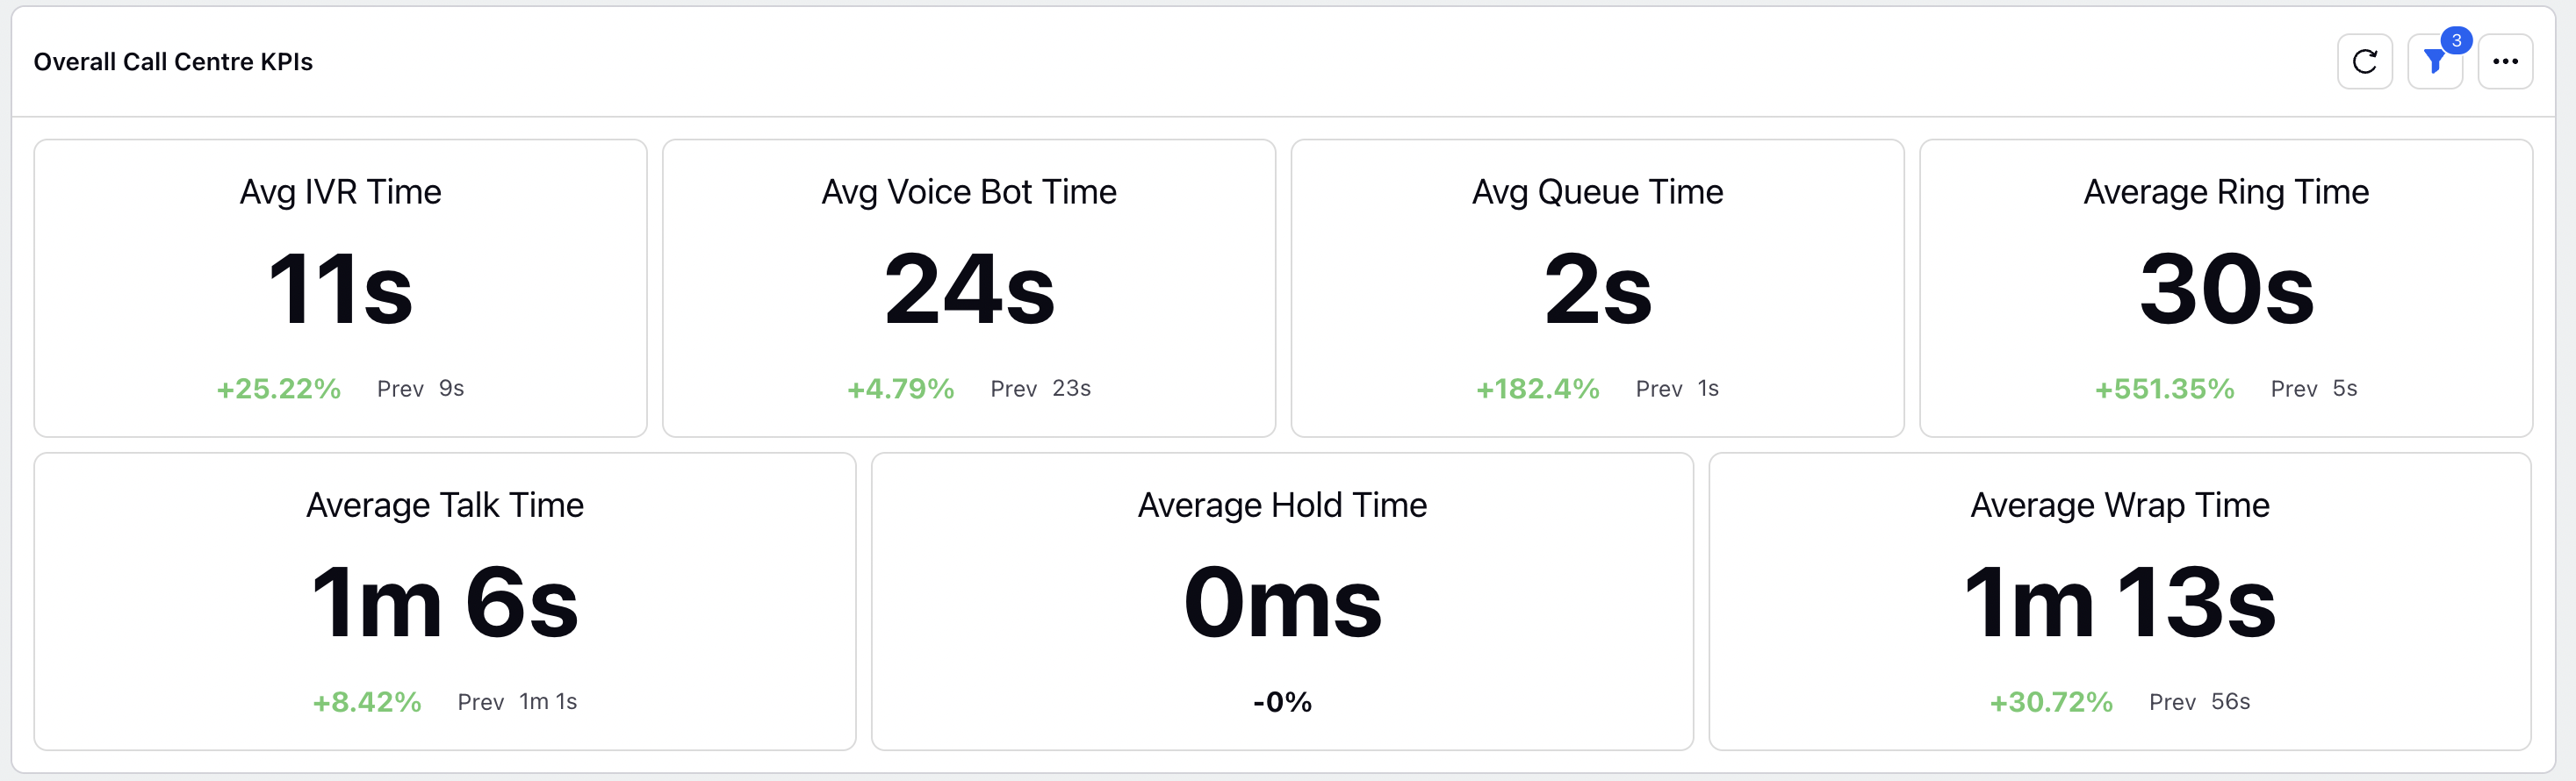
Avg IVR Time - Average time taken by customers in IVR
Avg Voice Bot Time - Average time taken by customers with Voice Bot (* if applicable)
Avg Queue Time - Average time customers waited in queue to be answered by the agents
Average Ring Time - Average time the call rang for customers waiting for agents to answer
Average Talk Time - Average talk time between customer and agent on the call
Average Hold Time - Average time the customer was put on hold during the call
Average Wrap Time - Average time the agent took to wrap up/ fill the ACW for the customer call
%FCR and Reapeat Caller Trend
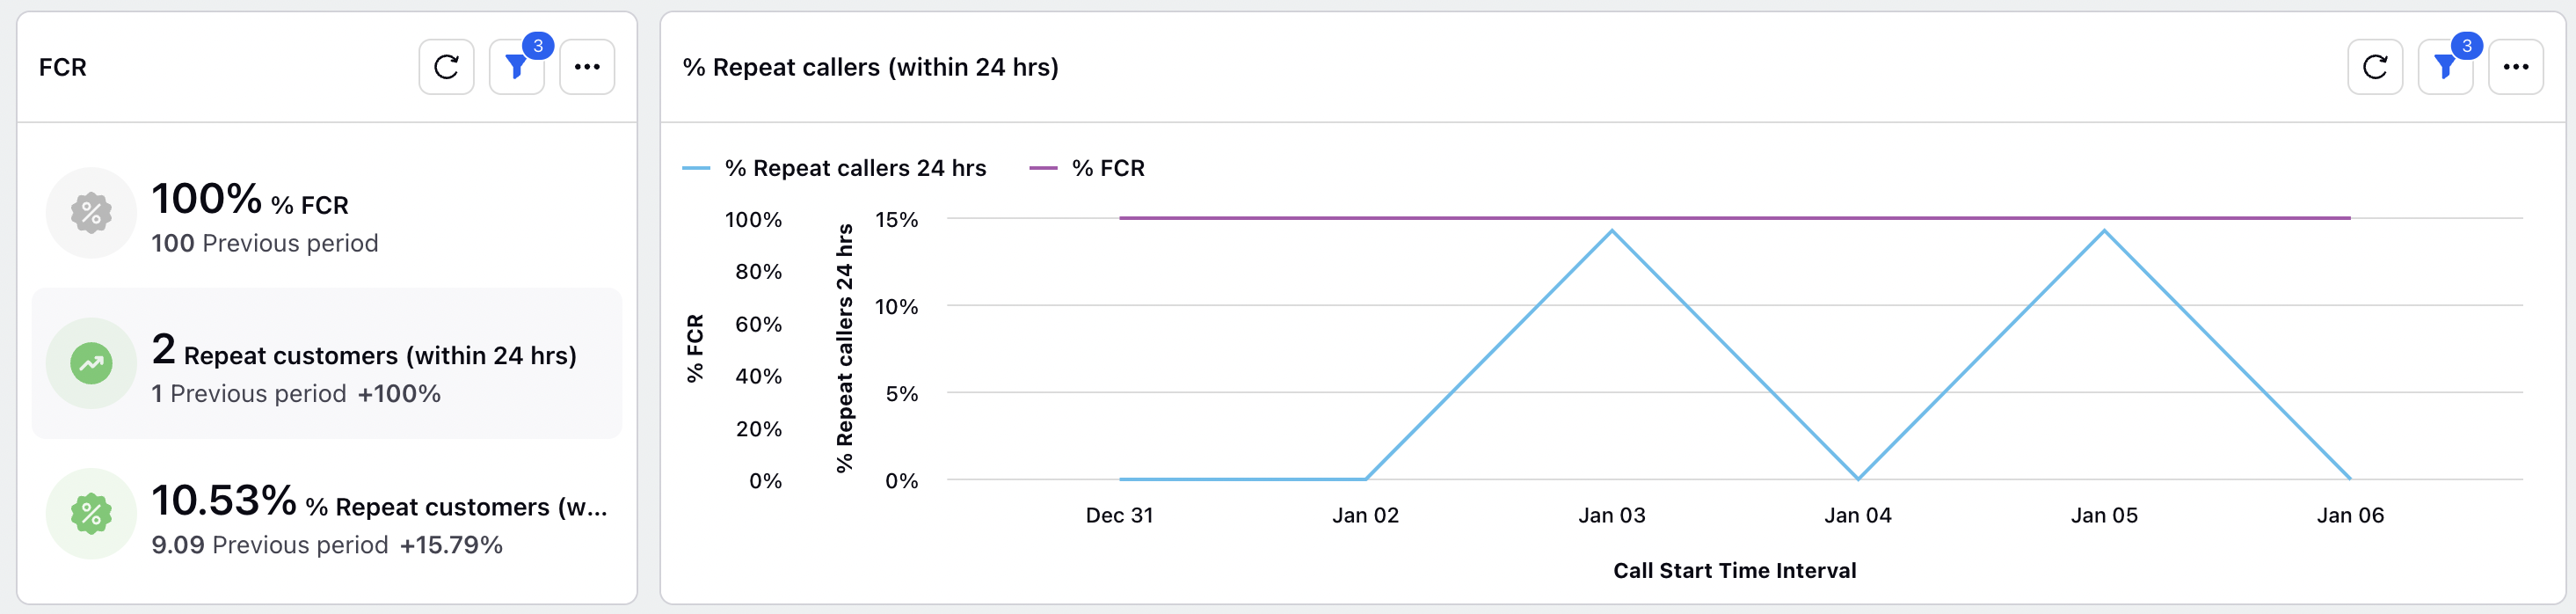
% FCR - % unique customers who called only once
Repeat Customers (within 24hours) - Count of unique customers who called back within 24 hours since their last call
% Repeat Callers 24hrs - Daily trend of % of repeat customers who reach out within 24 hrs
Disposition Summary
Column Chart indicating the various dispositions that have been filled on different number of calls
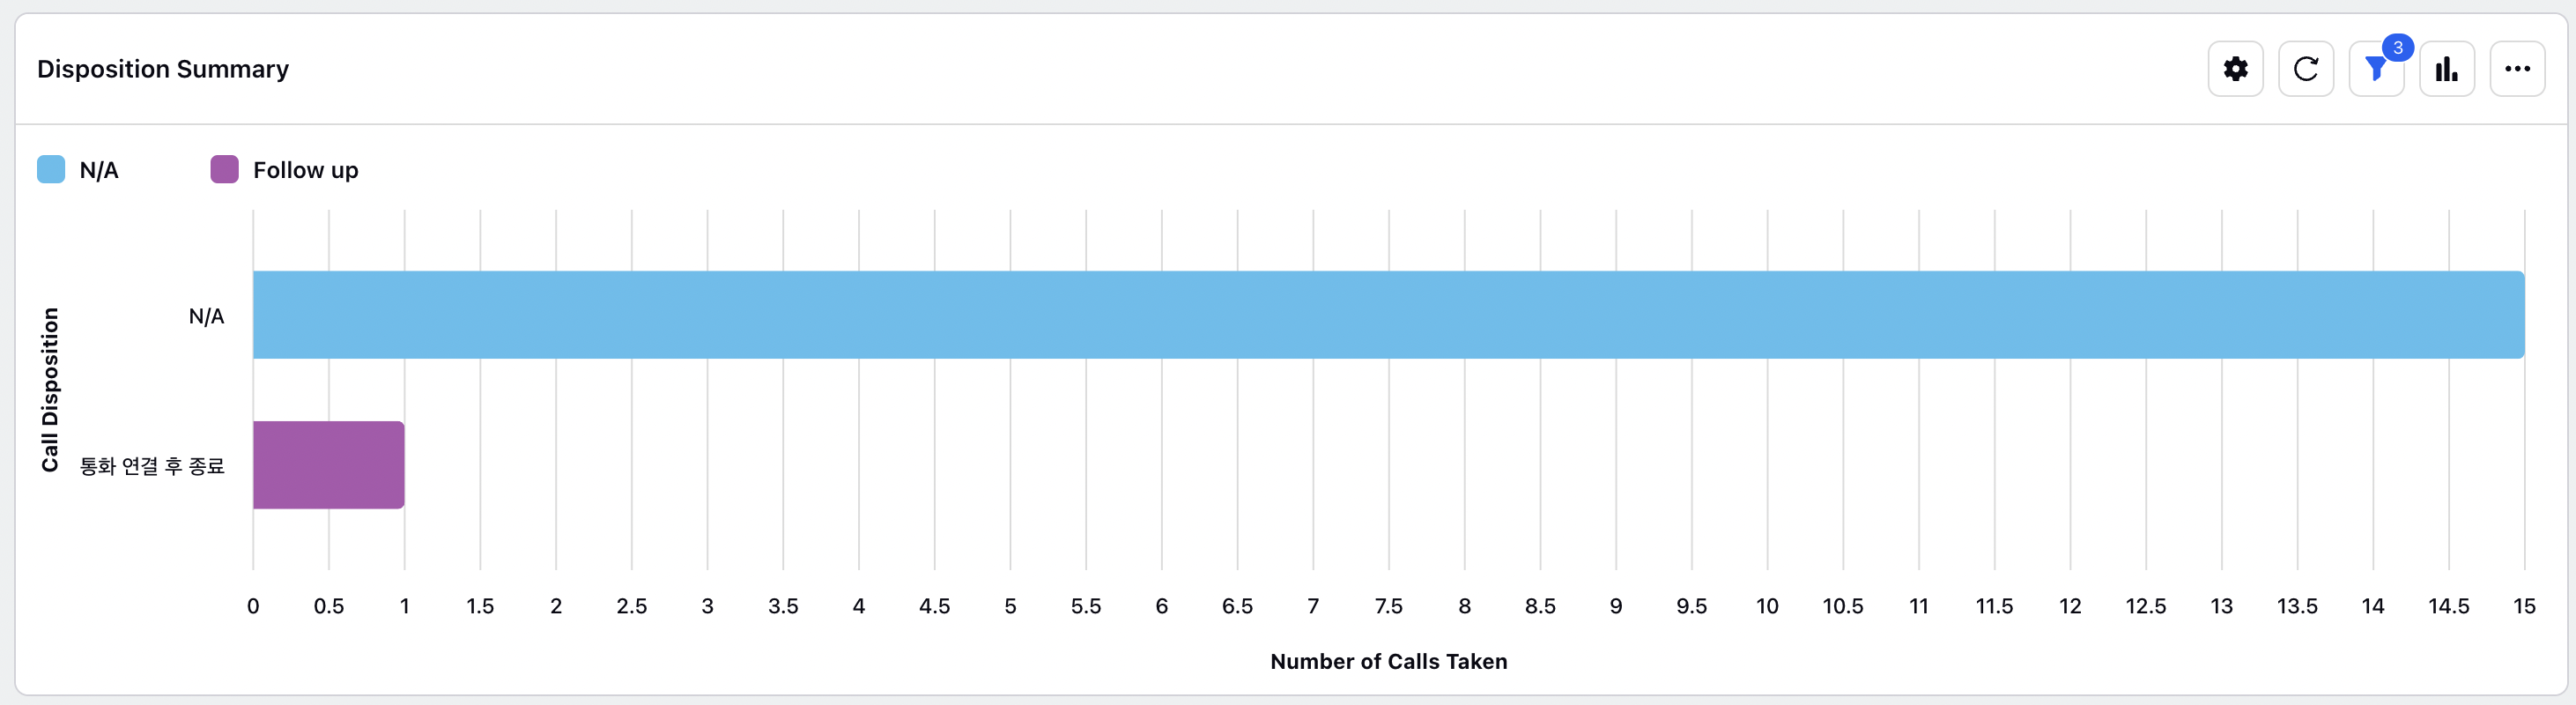
Call Disposition - The name of call disposition that is filled by the agent on the inbound customer call
Number of Calls Taken - Number of calls that were connected to the agent with the specific dispositionverage time the customer was put on hold during the call
Outbound KPIs
Volume Analysis and Trend
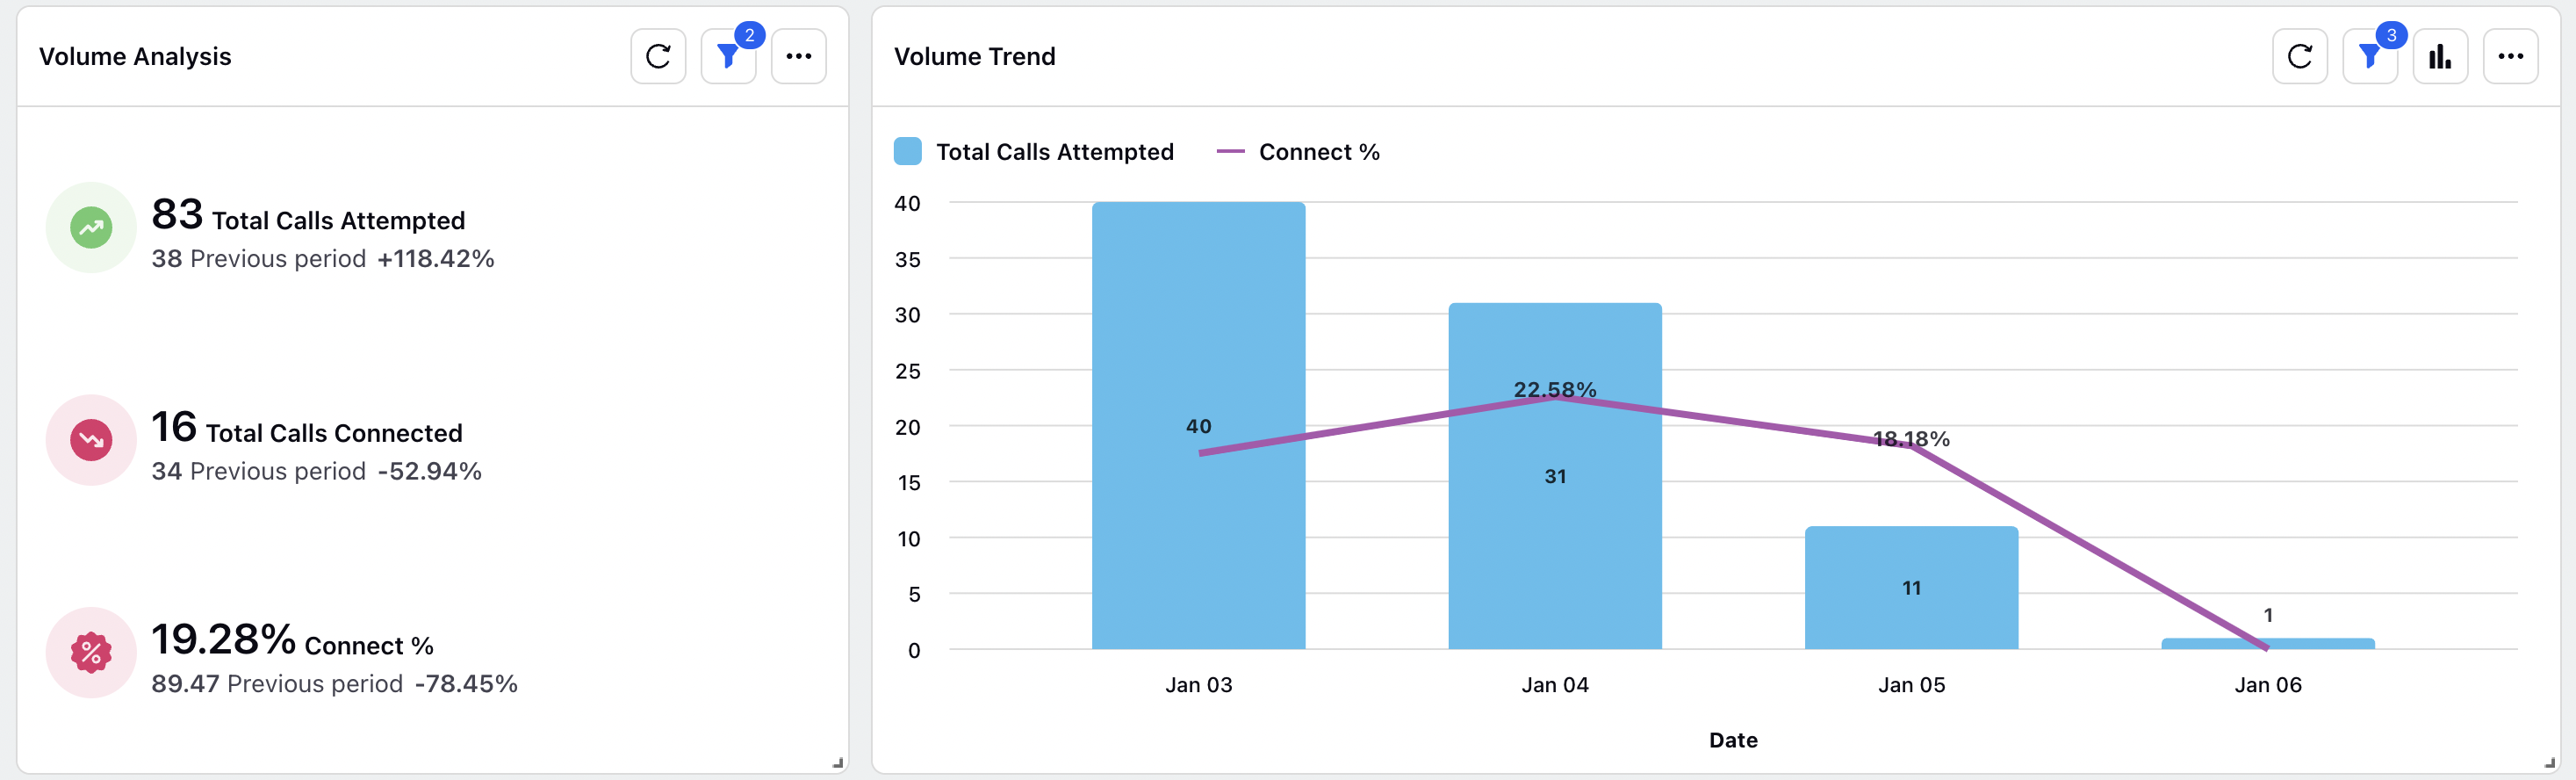
Total Calls Attempted - Number of outbound calls attempted by the agent/ dialer
Total Calls Connected - Number of outbound calls which got connected with the customer
Connect % - % of calls which got connected out of all the attempted calls
Dialer Type Summary
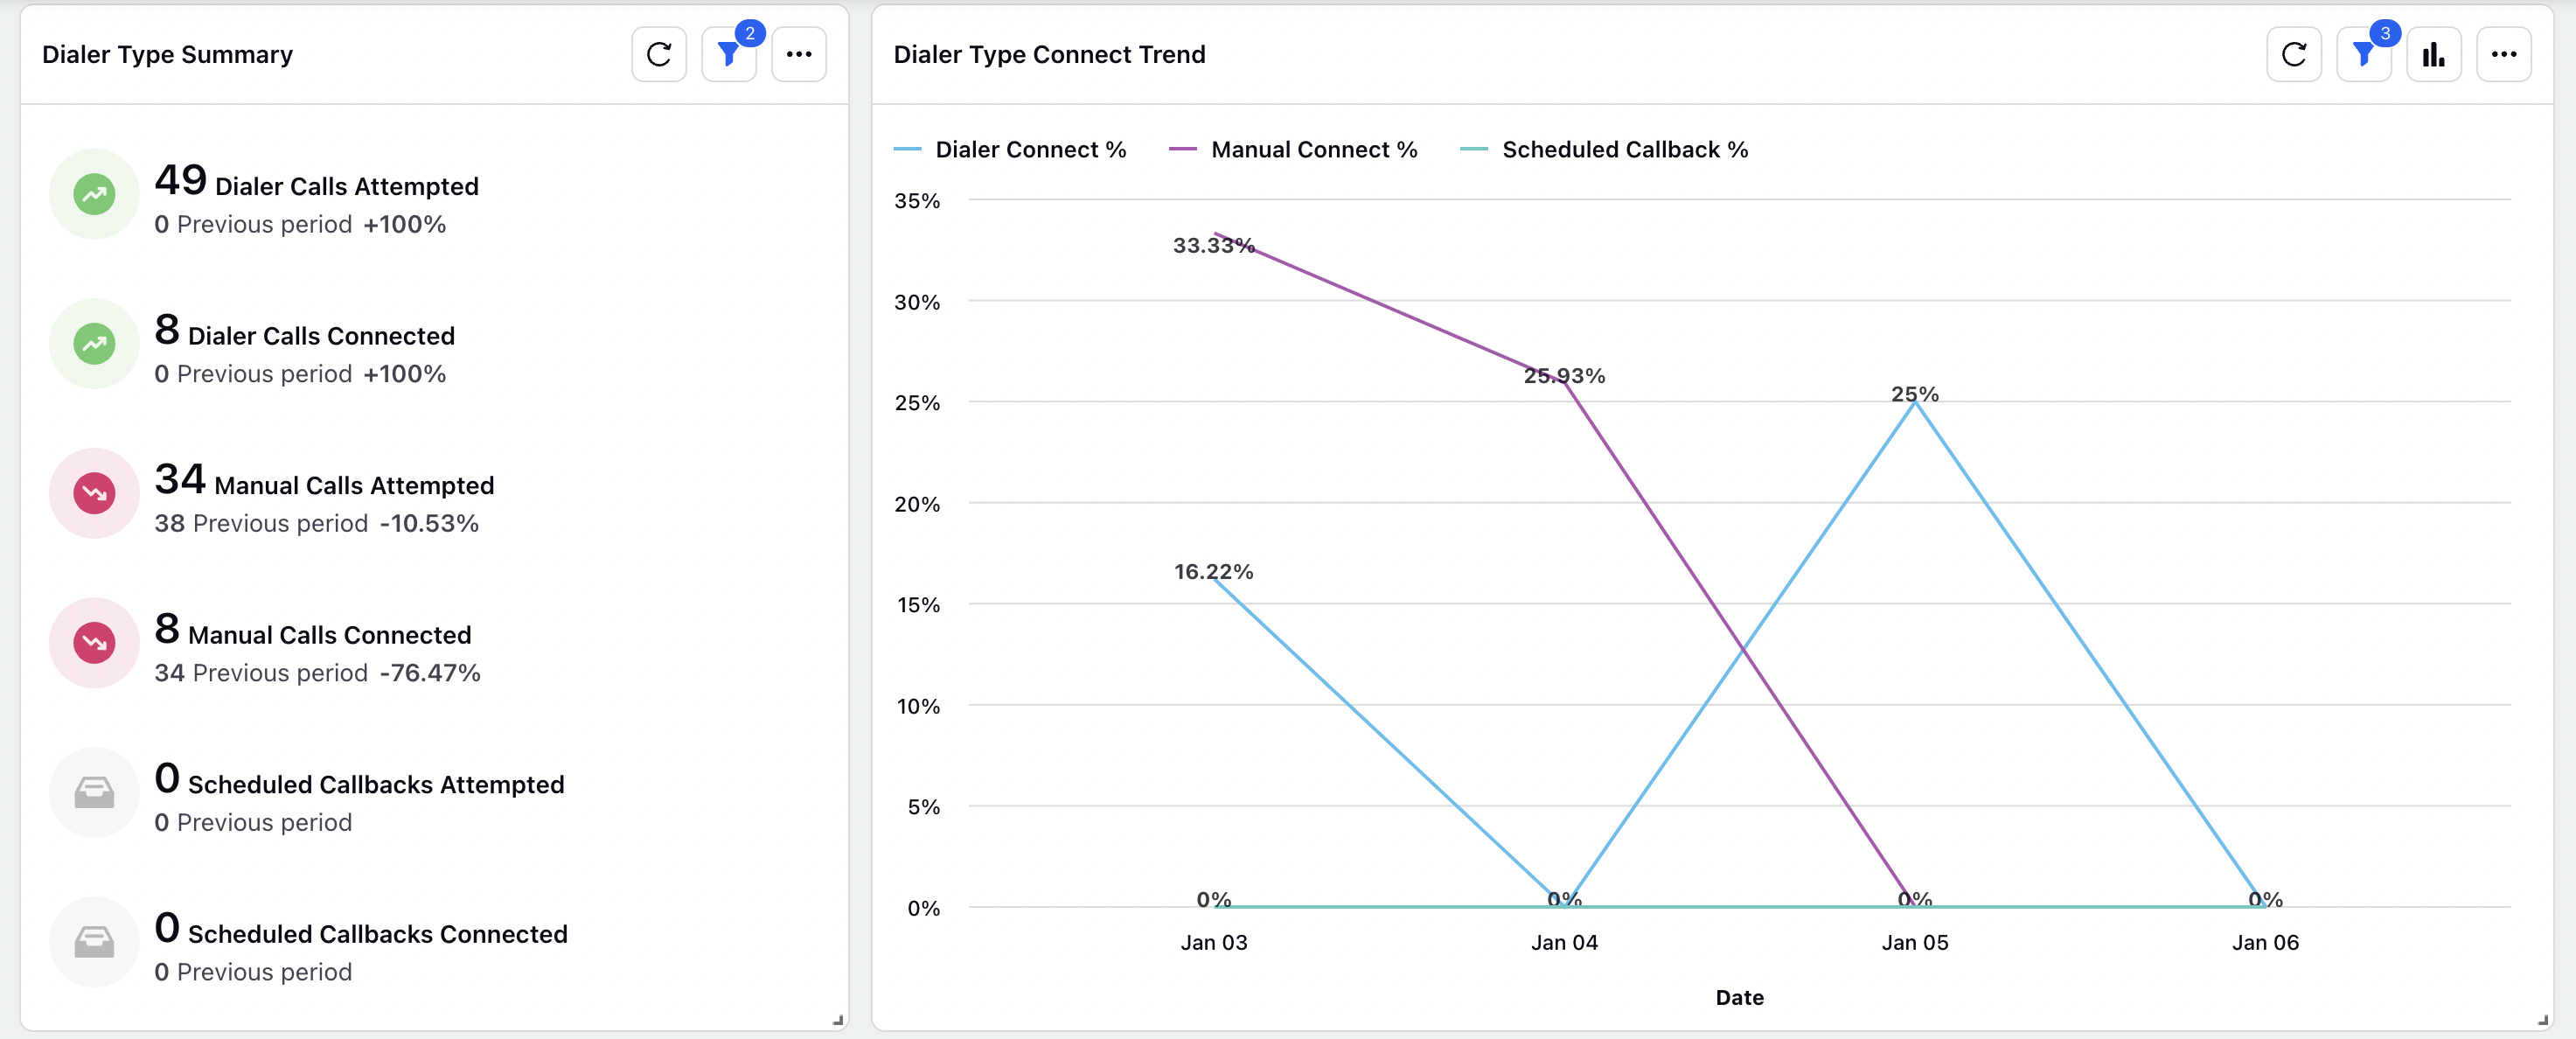
Dialer Calls Attempted - Number of outbound calls which got attempted via a dialer
Dialer Calls Connected - Number of outbound calls which got attempted via a dialer and later got connected with the customer
Manual Calls Attempted - Number of outbound calls which got manually dialed / attempted
Manual Calls Connected - Number of outbound calls which got manually and got connected with the customer
Scheduled Callbacks Attempted - Number of scheduled callbacks that were attempted by the agent
Scheduled Callbacks Connected - Number of scheduled callbacks that got connected with agent and customer both connected
Dialer Connect % - % of dialer calls which got connected with customer and agent both over total dialer attempted calls
Manual Connect % - % of manual calls which got connected with customer and agent both over total manual attempted calls
Scheduled Callback % - % of scheduled callbacks which got connected with customer and agent both over total scheduled callbacks
Abandoned Calls Trend
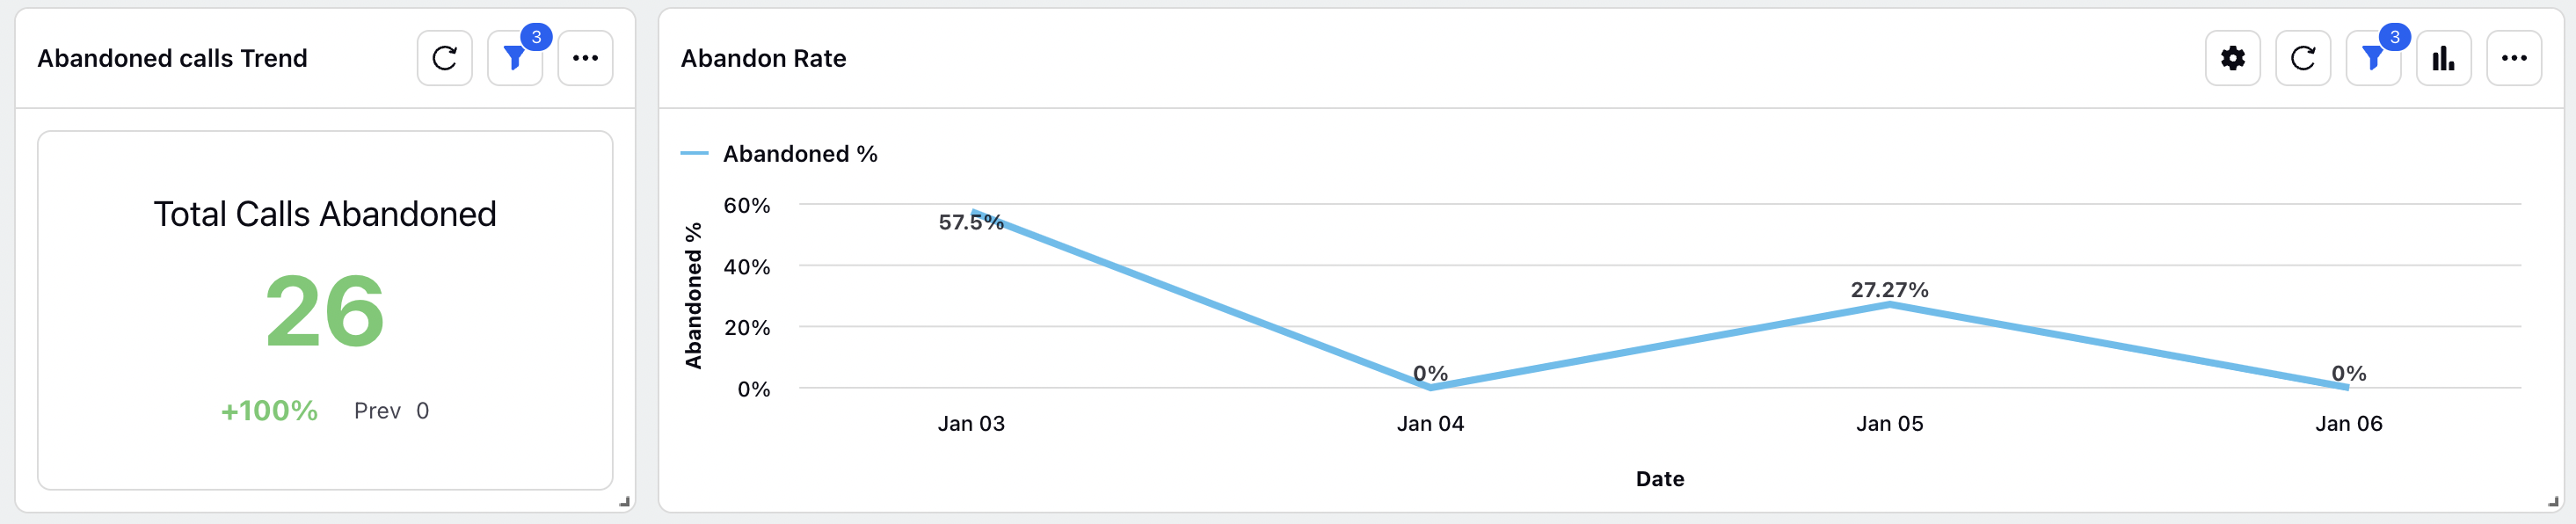
Total Calls Abandoned - Number of outbound calls where customer and agent didnt connect on the call
% Abandoned - Daily trend of number of abandoned outbound calls / Total number of outbound attempted calls
Average Call Time Stats
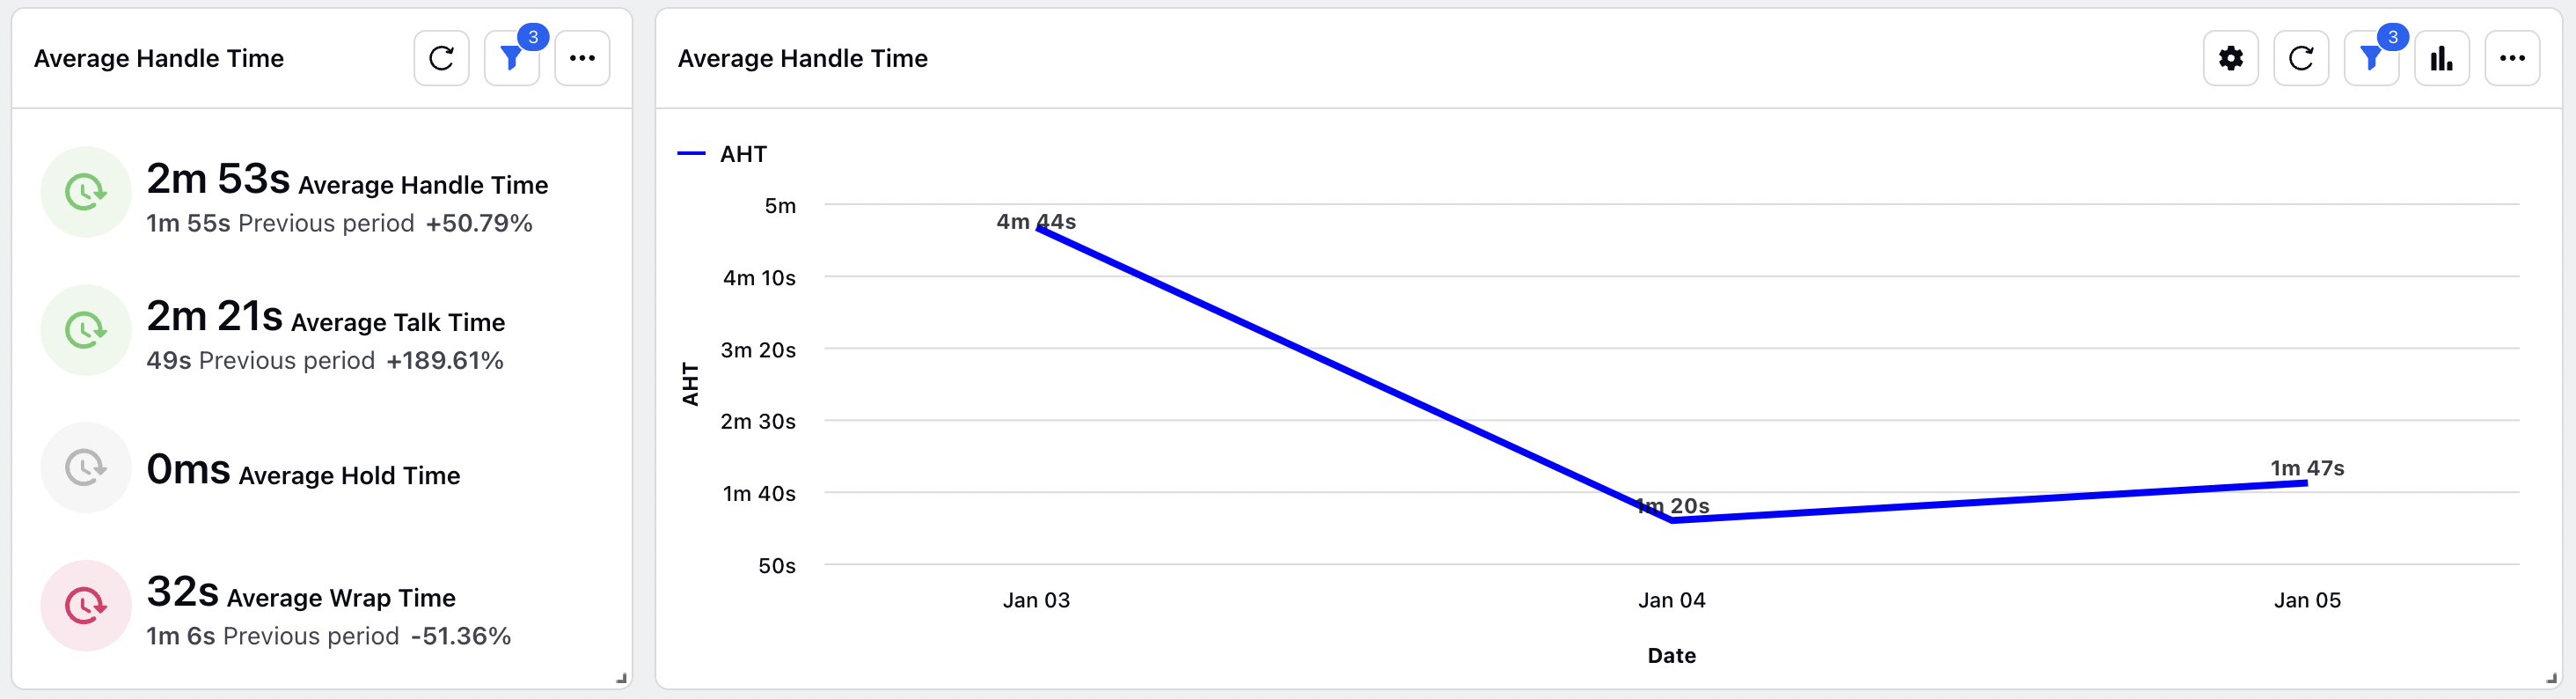
Average Handle Time - Average time of talk + hold + wrap time of the outbound call i.e overall duration of the call
Average Talk Time - Average talk time between customer and agent on the outbound call
Average Hold Time - Average time the customer was put on hold during the outbound call
Average Wrap Time - Average time the agent took to wrap up/ fill the ACW for the customer call
Disposition Summary
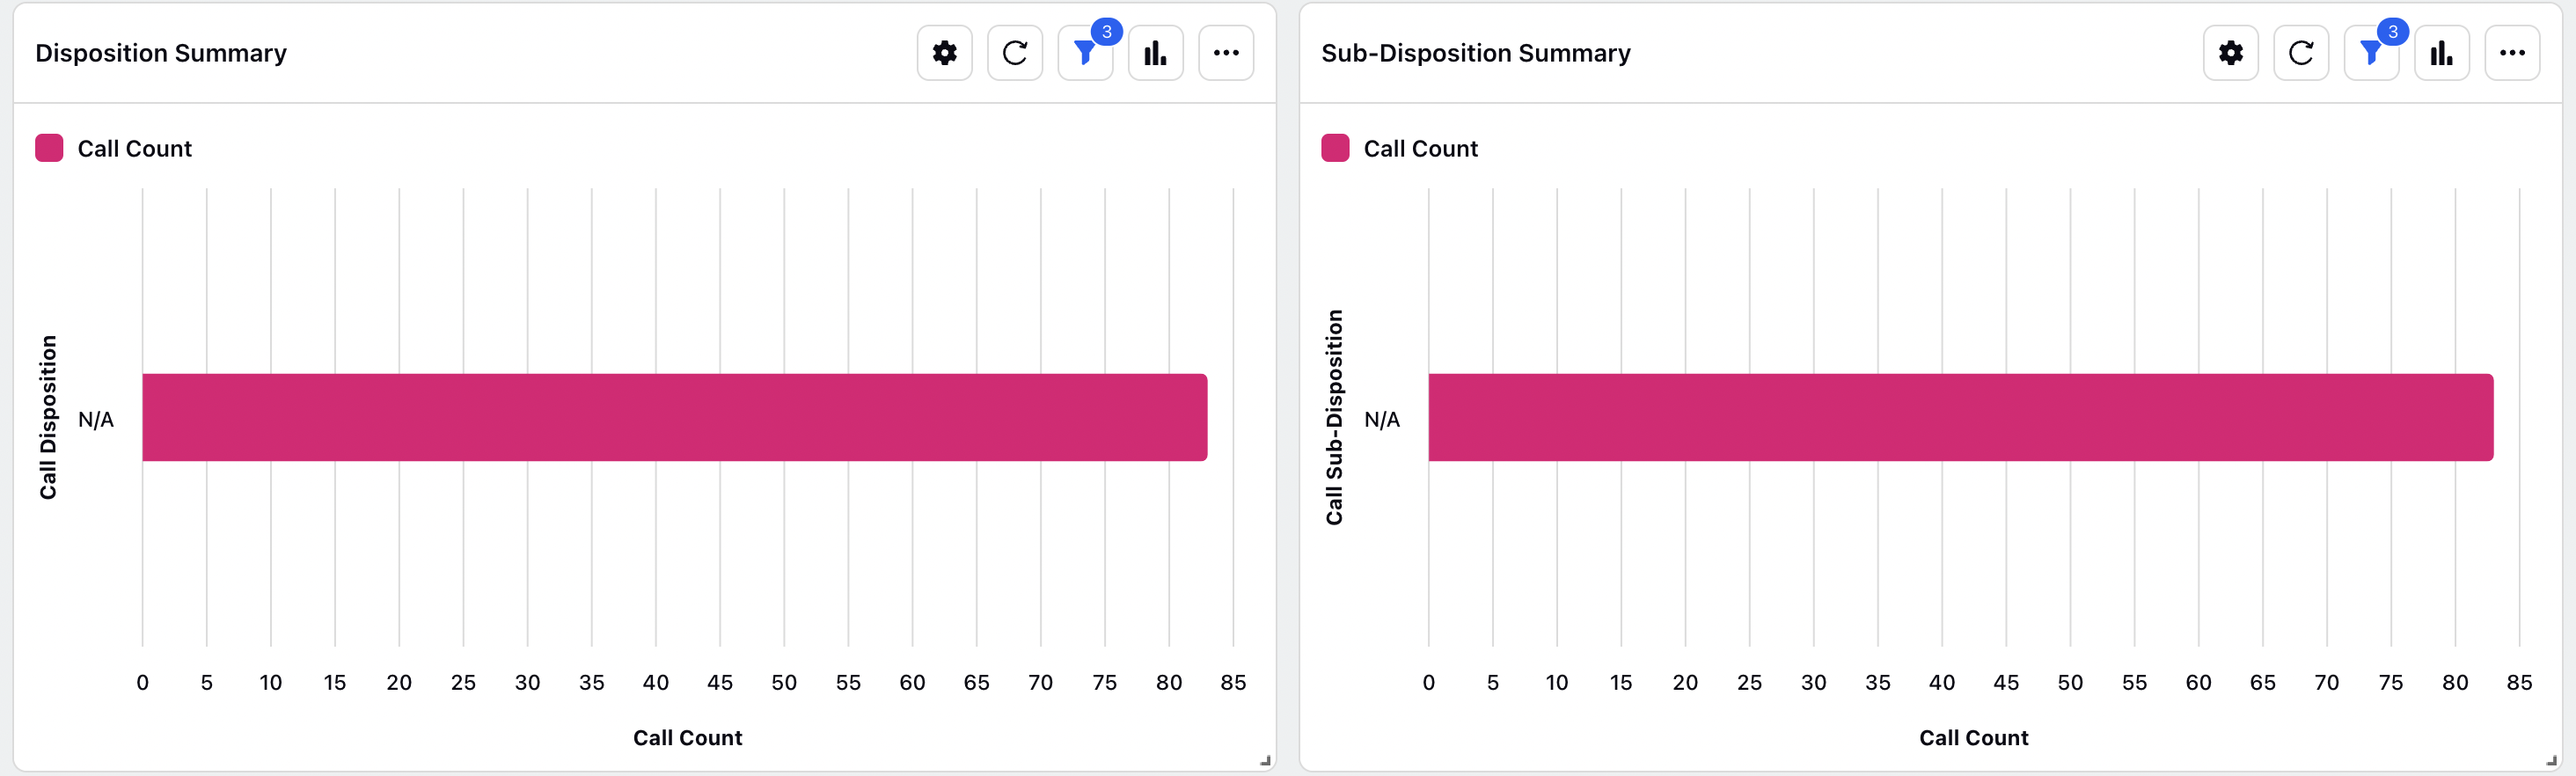
Call Disposition - Disposition/ ACW details that is being filled by the agent on the call
Call Sub Disposition - Sub Disposition/ ACW details that is being filled by the agent on the call
Call Count - Trend of calls which have varioud dispositions and sub-dispositions being filled
Call Status and Idle Time
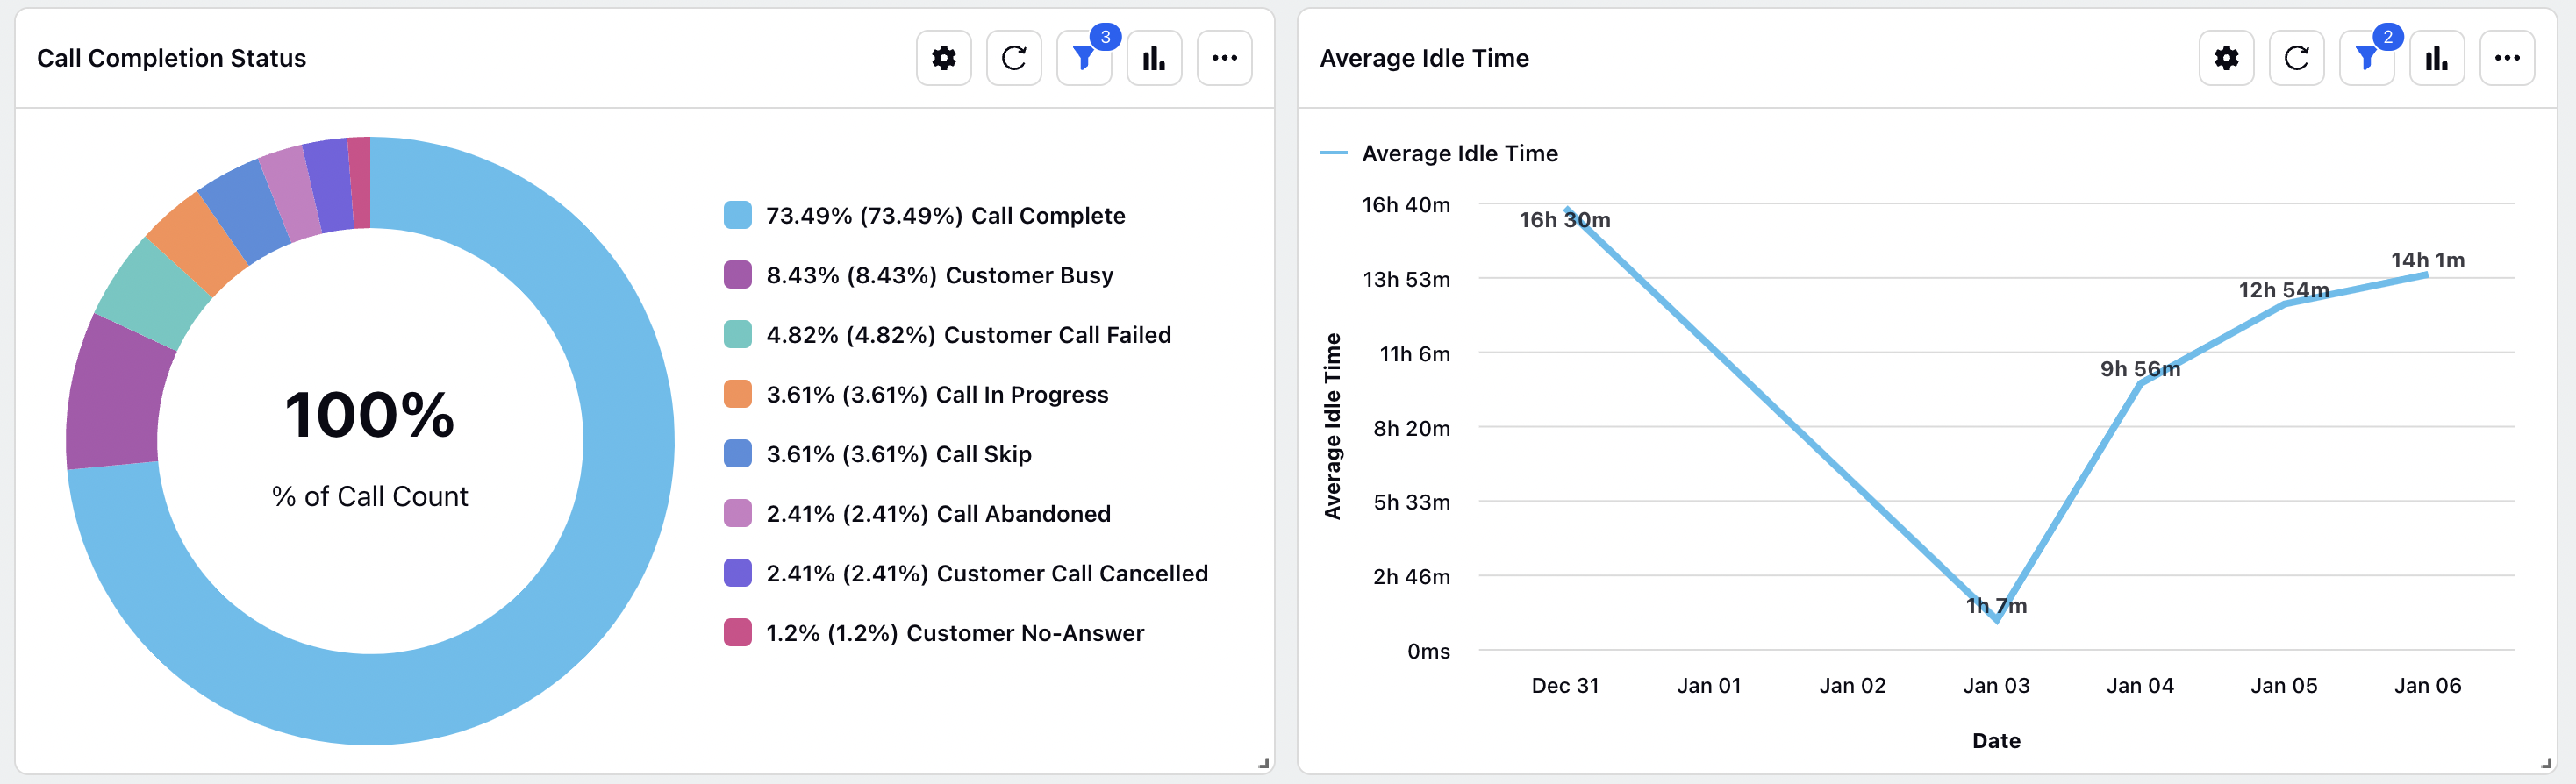
Call Completion Status - Trend of % of calls with different call completion status
Idle Time Trend - Daily trend of average idle time of the agents
Login Trend
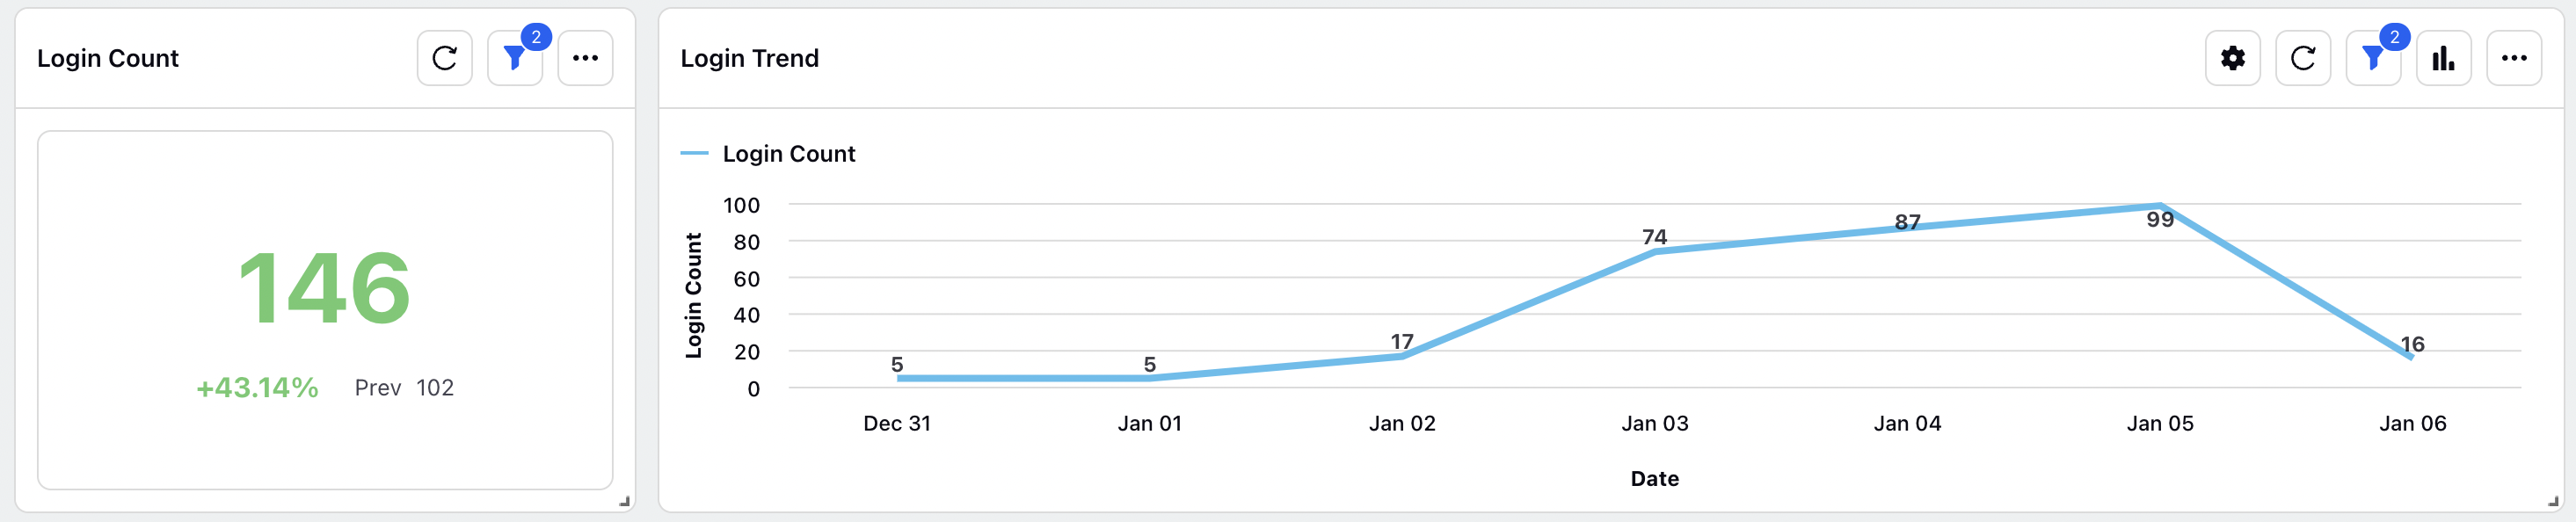
Login Count - Count of agents who are logged into the system
Login Trend - Daily trend of count of agent who logged into the system