


THE 2026 SPRINKLR SOCIAL INDEX REPORT
Winning the moments that matter
Customers today don't experience brands through channels; they experience them through moments. In this report, you’ll find out how brands across five industries are winning or losing those moments, and what it takes to reach the top.
Snapshot of the study
Brands analyzed
Owned and earned social posts on three social platforms — X, Instagram and Facebook — were scrutinized for various metrics using Sprinklr Insights
Data points collected
Social data across the three channels over a period of 11 months (January 1–December 5, 2025) was taken into consideration for our analysis
Industries covered
Businesses spanning technology, financial services, retail, telecommunications, and consumer packaged goods have been examined in the report
Most brands are active on social. Very few are actually seen.
Constant posting doesn't always translate into lasting relevance or engagement as audiences respond to how brands show up in the moments that matter.
Across industries, the median Social Index score sits below 2.2 on a 10‑point scale. What does this mean?
When a brand scores below 2.2, it signals a blind spot: activity is being mistaken for impact. These brands work harder for diminishing returns while the ones with a higher Social Index score outperform by showing up when it matters the most.


The Sprinklr Social Index gives leaders a more complete view of their social presence, revealing strengths, blind spots, and the moves needed to earn trust, loyalty, and cultural relevance.
Karthik Suri
Chief Product Officer, Sprinklr
5 industries. 5 different gaps.
Brands enjoy 2.3x lift in engagement when they publish 10-30posts/week with content that go beyond product updates.

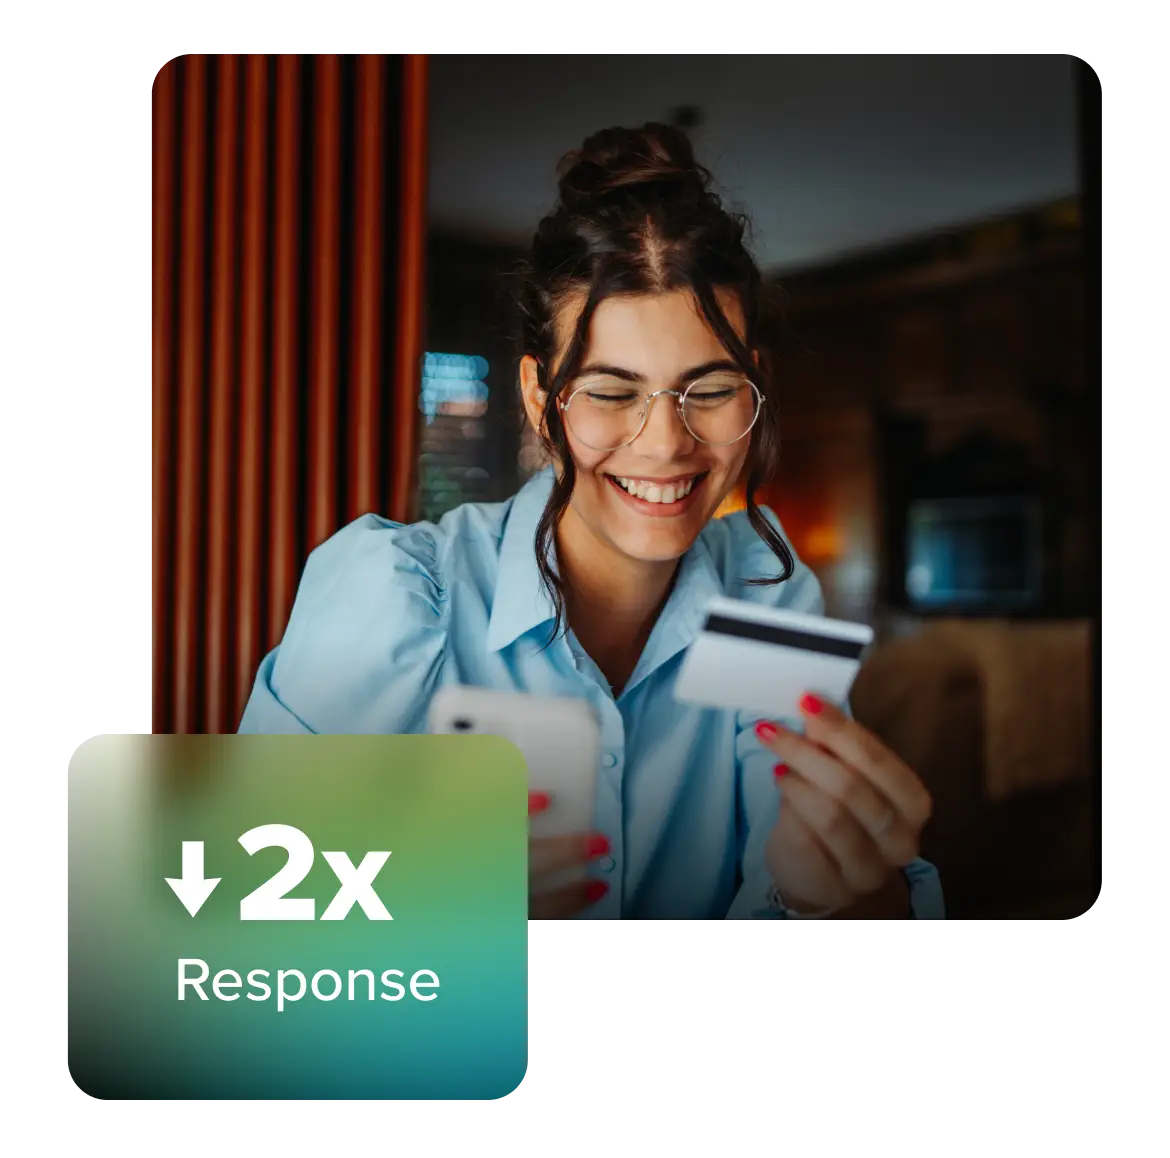
The most-loved FSI brands respond 2x slower than average performers. Because in FSI, trust is built when the problem is truly solved even if it takes time.
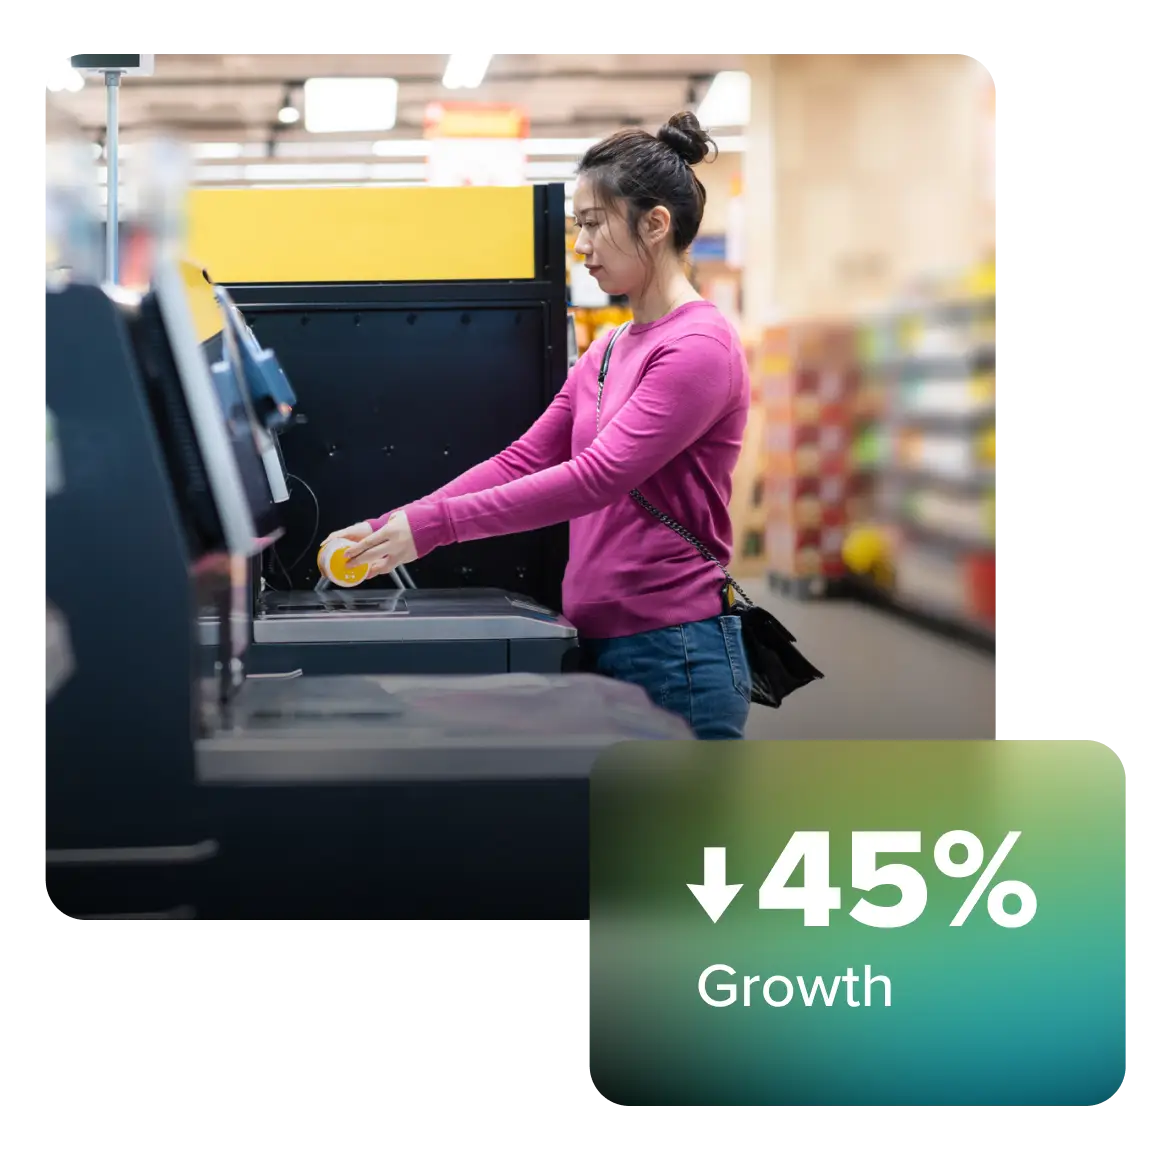
Followers grow 45% slower if brands flood them with 60+ posts/week. Publishing around 24 posts/week is ideal for driving engagement.
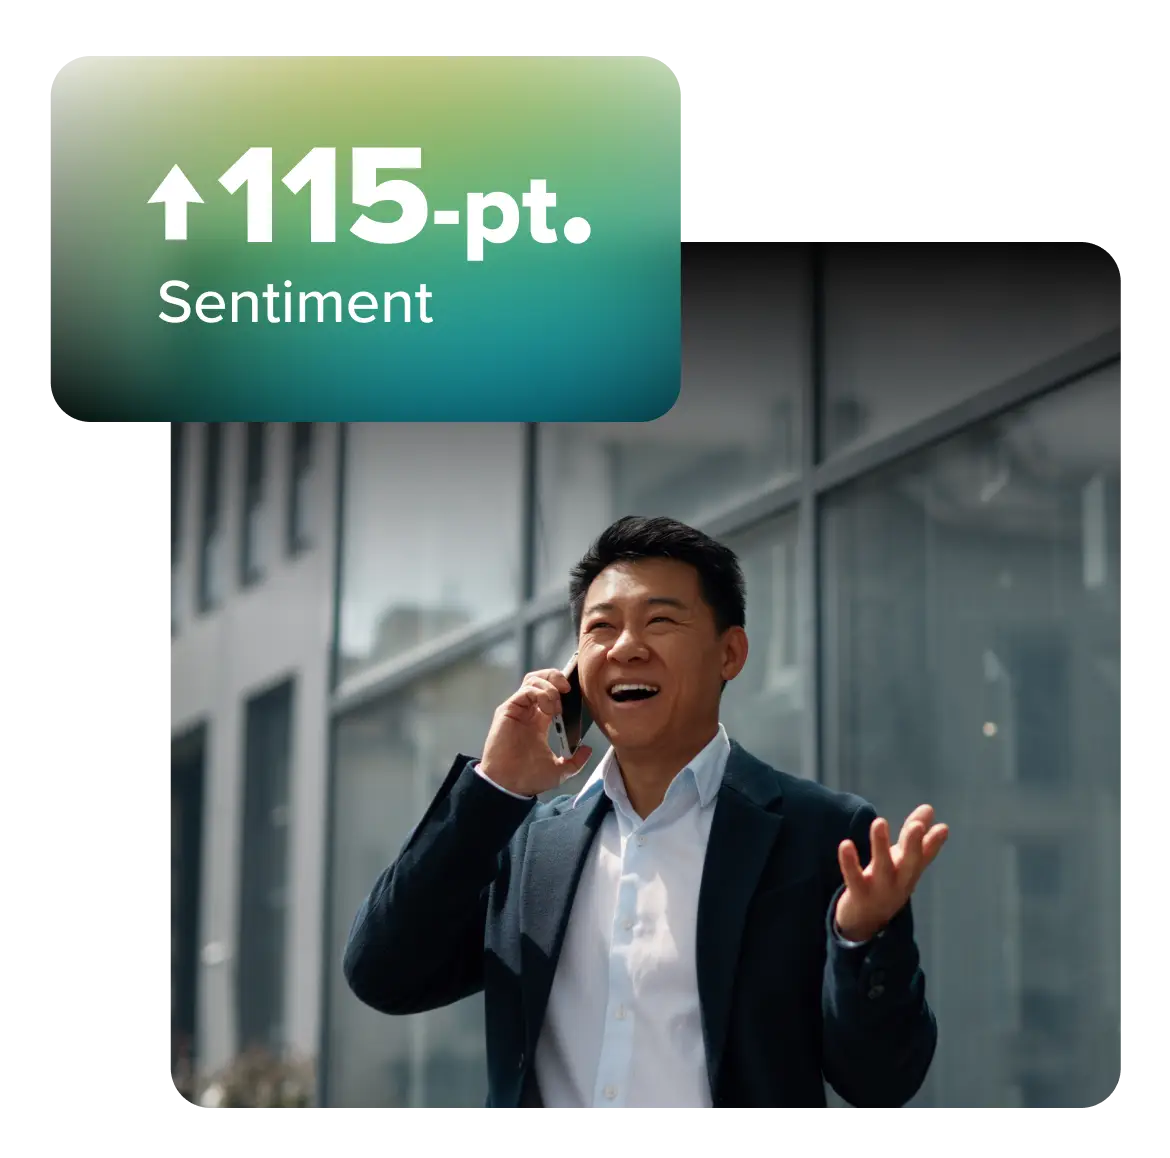
There's a sentiment gap of 115 percentage points between owned media and earned media, meaning many brands are oblivious to their reputation beyond their own handle.
Leading brands post only 4 times but still outperform average performers who post 6. In CPG, narrative intent beats content volume every time.
Find your moment.
Winning the moments that matter starts with measuring them. Download the full report and find out exactly where your brand stands. (If you'd like to understand the method behind the numbers, head to the Appendix.)
Download the Social Index Report
Welcome Back,
No need to fill out any forms — you're all set