Accessing Visual Insights
Updated
To access Visual Insights
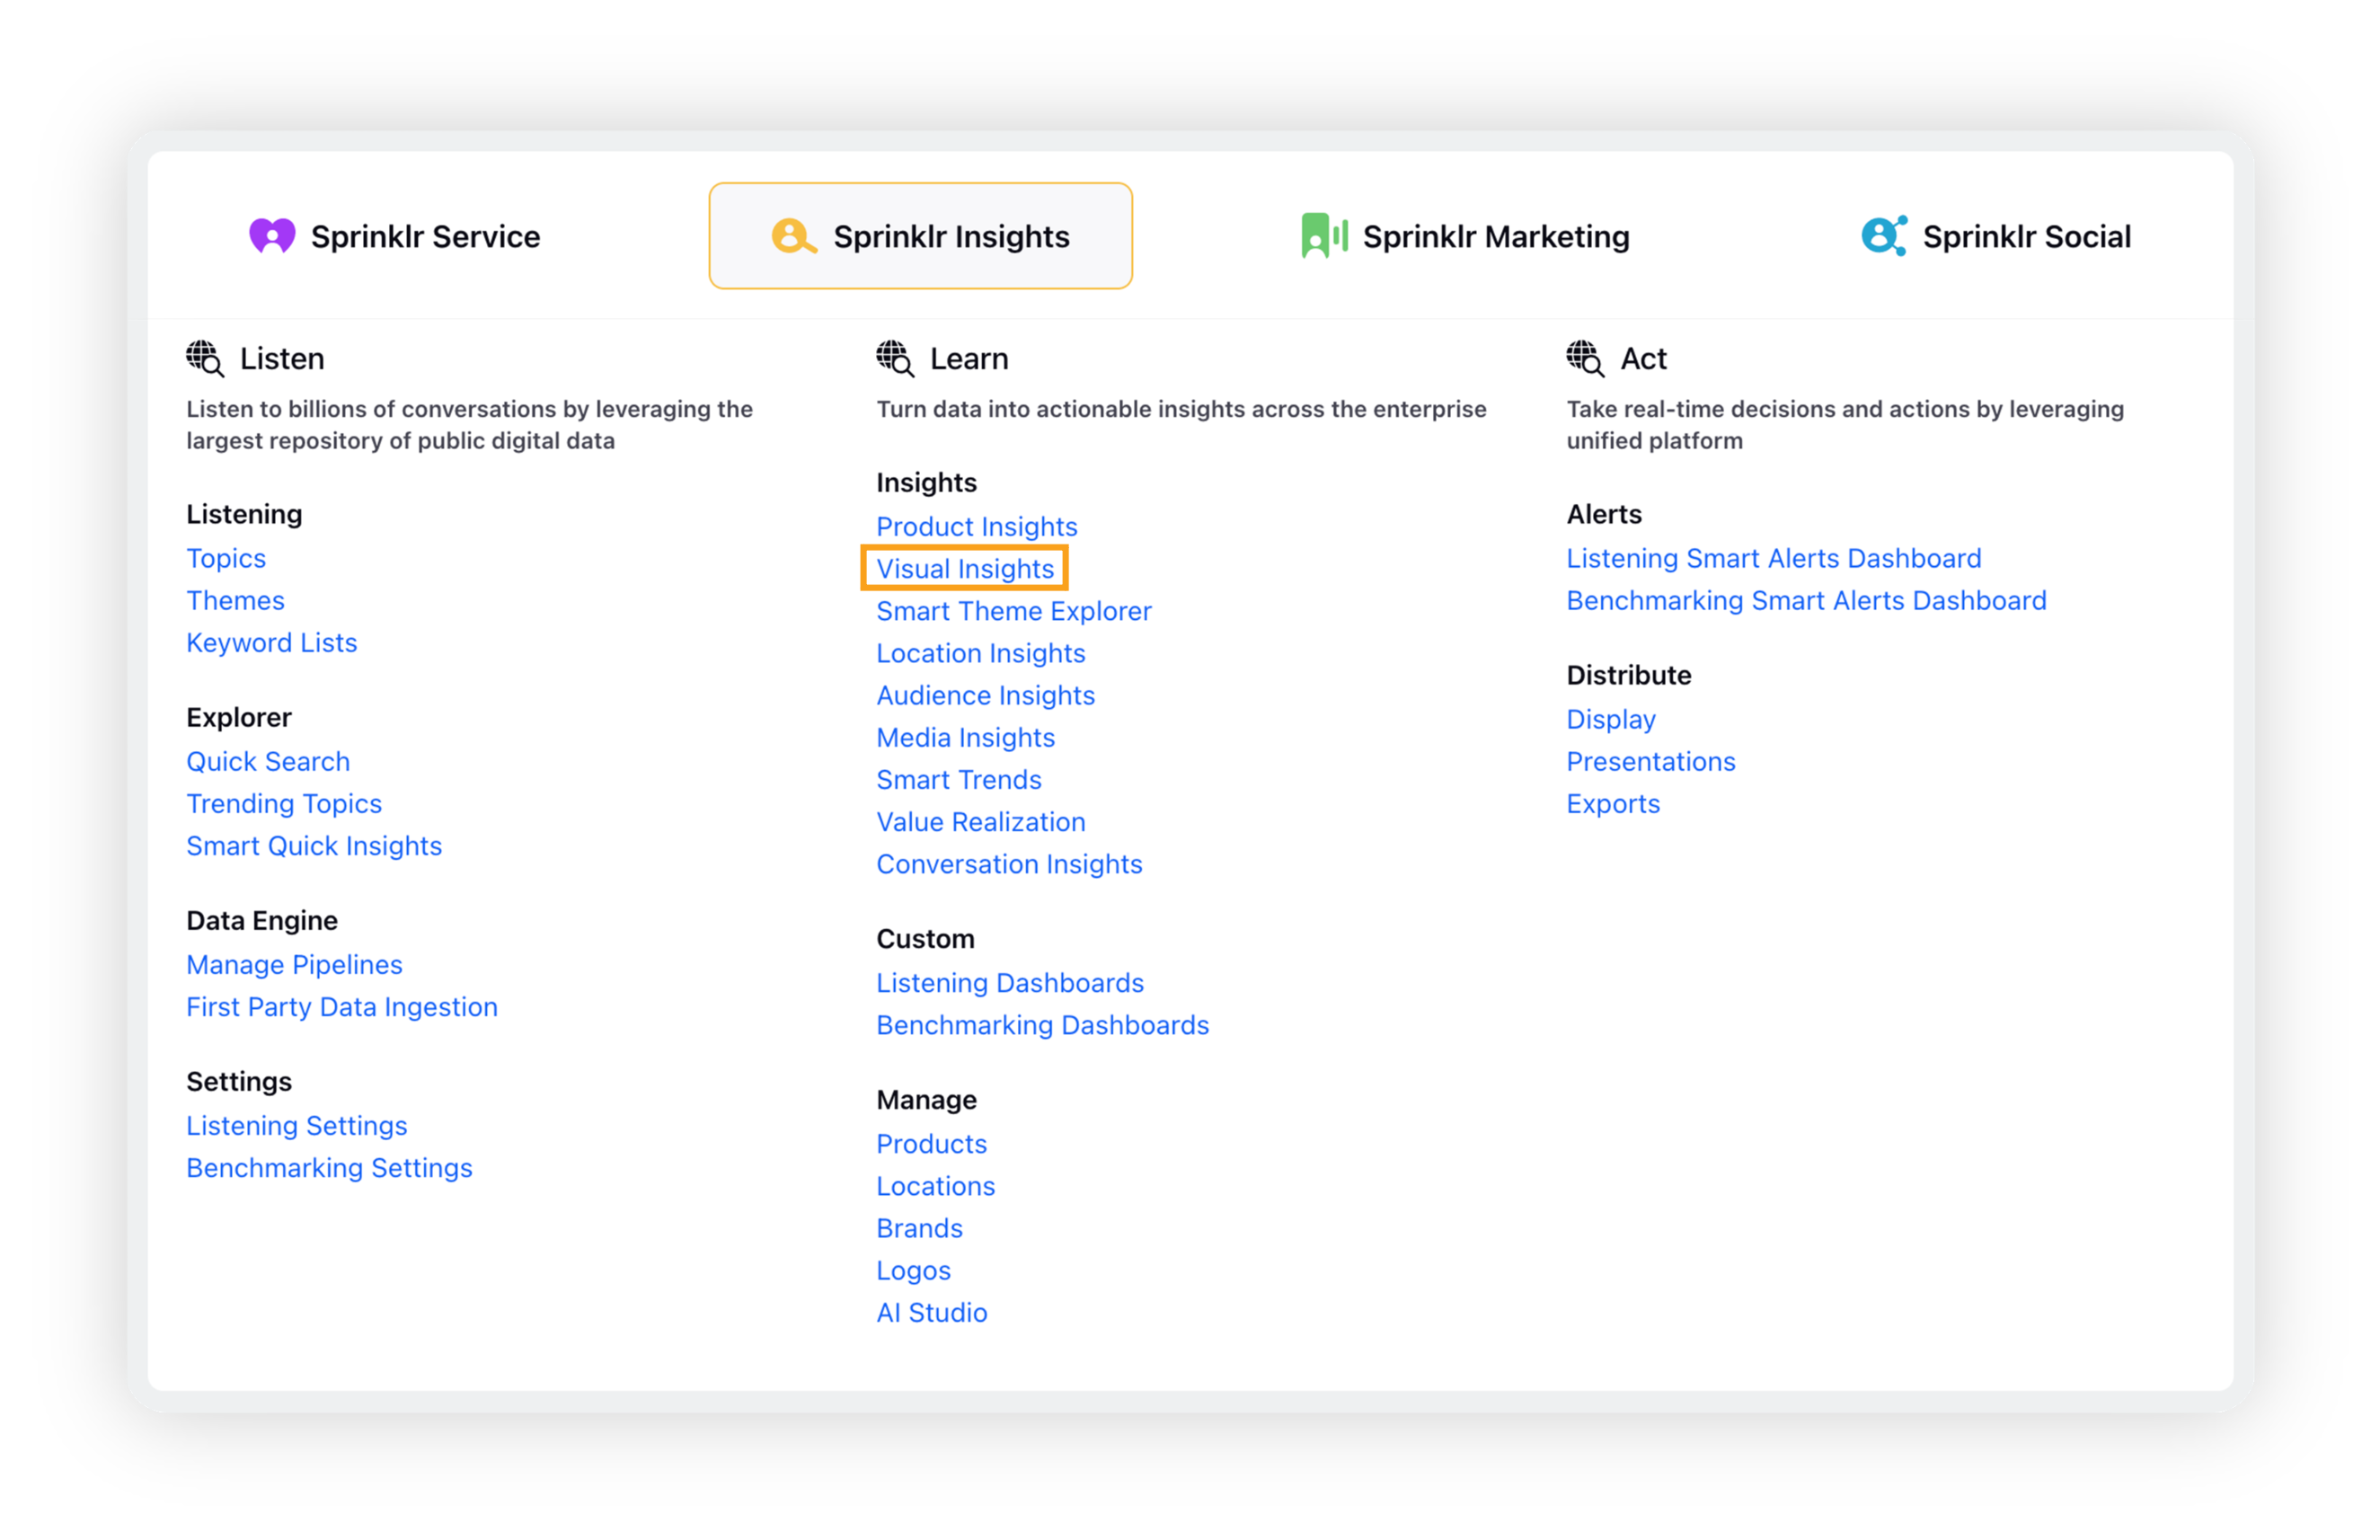
Click the New Tab icon. Under Sprinklr Insights, click Visual Insights within Learn.
This will take you to the Visual Insights standard dashboard.
Here, click Add Filter and select topic(s) for which you would like to see visual insights.
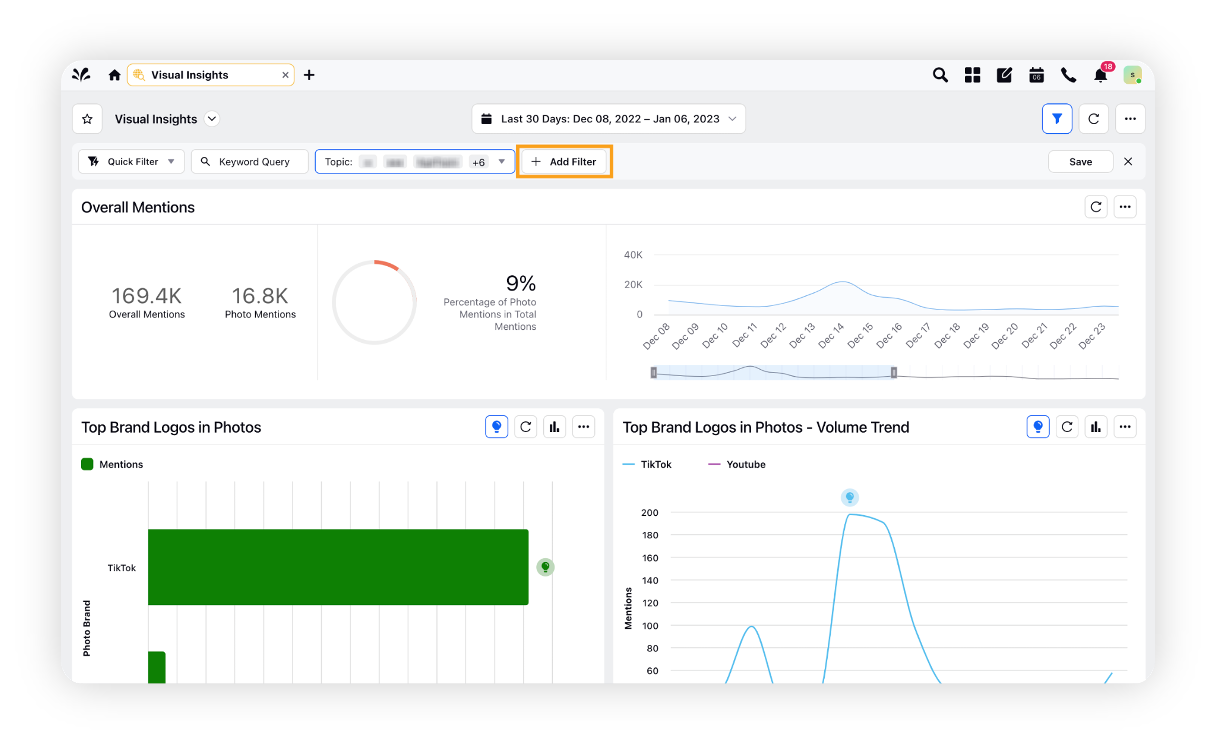
Note: You can use either a visual topic or a Listening topic to select data on which you want to perform your analysis –
Visual Topic: It allows live fetching of those images which has your brand logo in them.
Listening Topic: It can be used to select a dataset on which image processing is performed.