Sprinklr API Usage Reporting Dashboard
Updated
You can create a custom API Usage Report in Sprinklr to monitor your Sprinklr API usage. The report uses the Unified Log Reporting data source to provide real-time and historical insights into your Sprinklr API usage.

Key Features
The API Usage Report offers the following features:
Captures real-time and historical data for comprehensive API usage tracking.
Logs error codes, API endpoints, call counts, and error messages for detailed failure analysis.
Provides visibility into API performance through metrics like call counts and response time.
Supports filtering by various API-related dimensions and metrics, such as HTTP Method, Status Code, and Response Time, to enable precise and targeted analysis.
Key Benefits
The API Usage Report offers the following key benefits:
Comprehensive Visibility: Gain visibility into API usage by monitoring key dimensions such as API Key, Application Name, Endpoint, and User, alongside metrics like API Call Count to understand usage patterns and identify high-traffic sources.
Proactive Issue Detection: Detect failures early by tracking Response Status Codes and analyzing Average Response Time to uncover latency or error spikes before they impact operations.
Efficient Troubleshooting: Quickly diagnose problems using detailed error data including Response Status Codes, Error Messages, and Request Timestamps to pinpoint when and where issues occur.
Performance Optimization: Use trends in Response Times and API Call Volumes across different Endpoints and HTTP Methods to optimize API performance and resource allocation.
Prerequisites
You must have the Create permission under Reporting > Dashboards.
![]() Note: If you do not have this permission, reach out to your Sprinklr Administrator to request access.
Note: If you do not have this permission, reach out to your Sprinklr Administrator to request access.
To check your permissions:
1. Click your user profile in the top-right corner of the Sprinklr platform.
2. Go to the Permissions tab and search for Reporting.
Create API Usage Reporting Dashboard
To create an API Usage Reporting Dashboard, follow these steps:
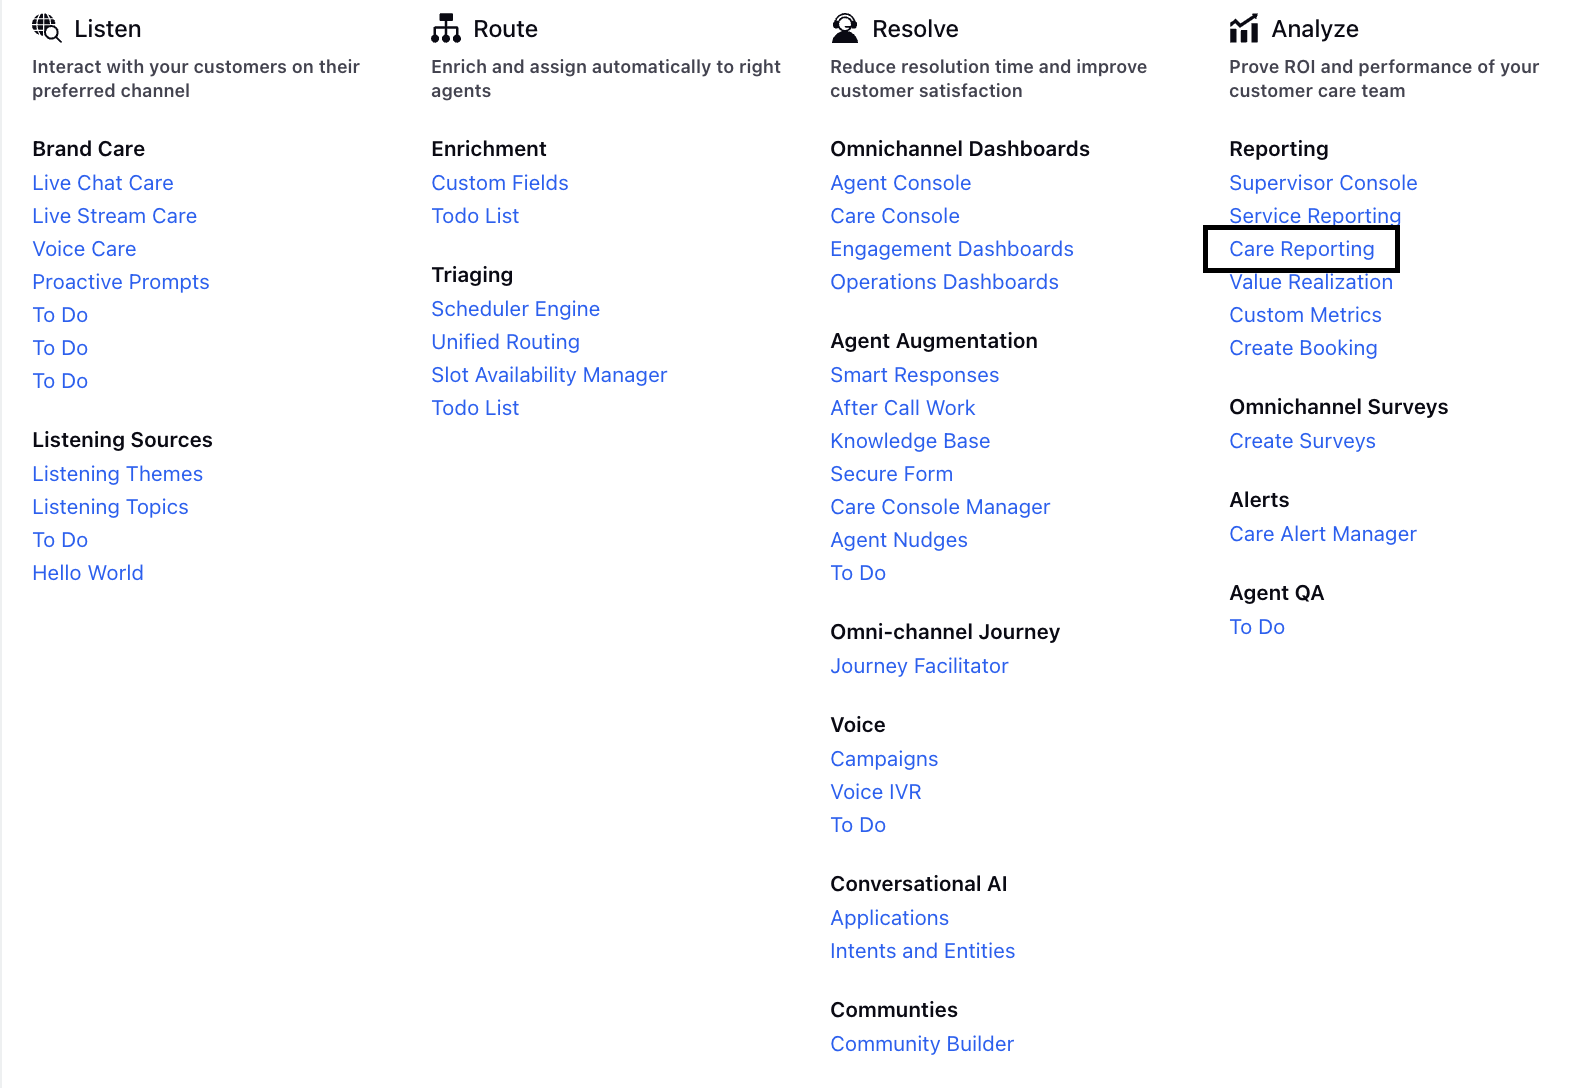
1. Click the New Page (+) icon to open the Launchpad.
2. On the Launchpad, under Analyze > Reporting, click Care Reporting.
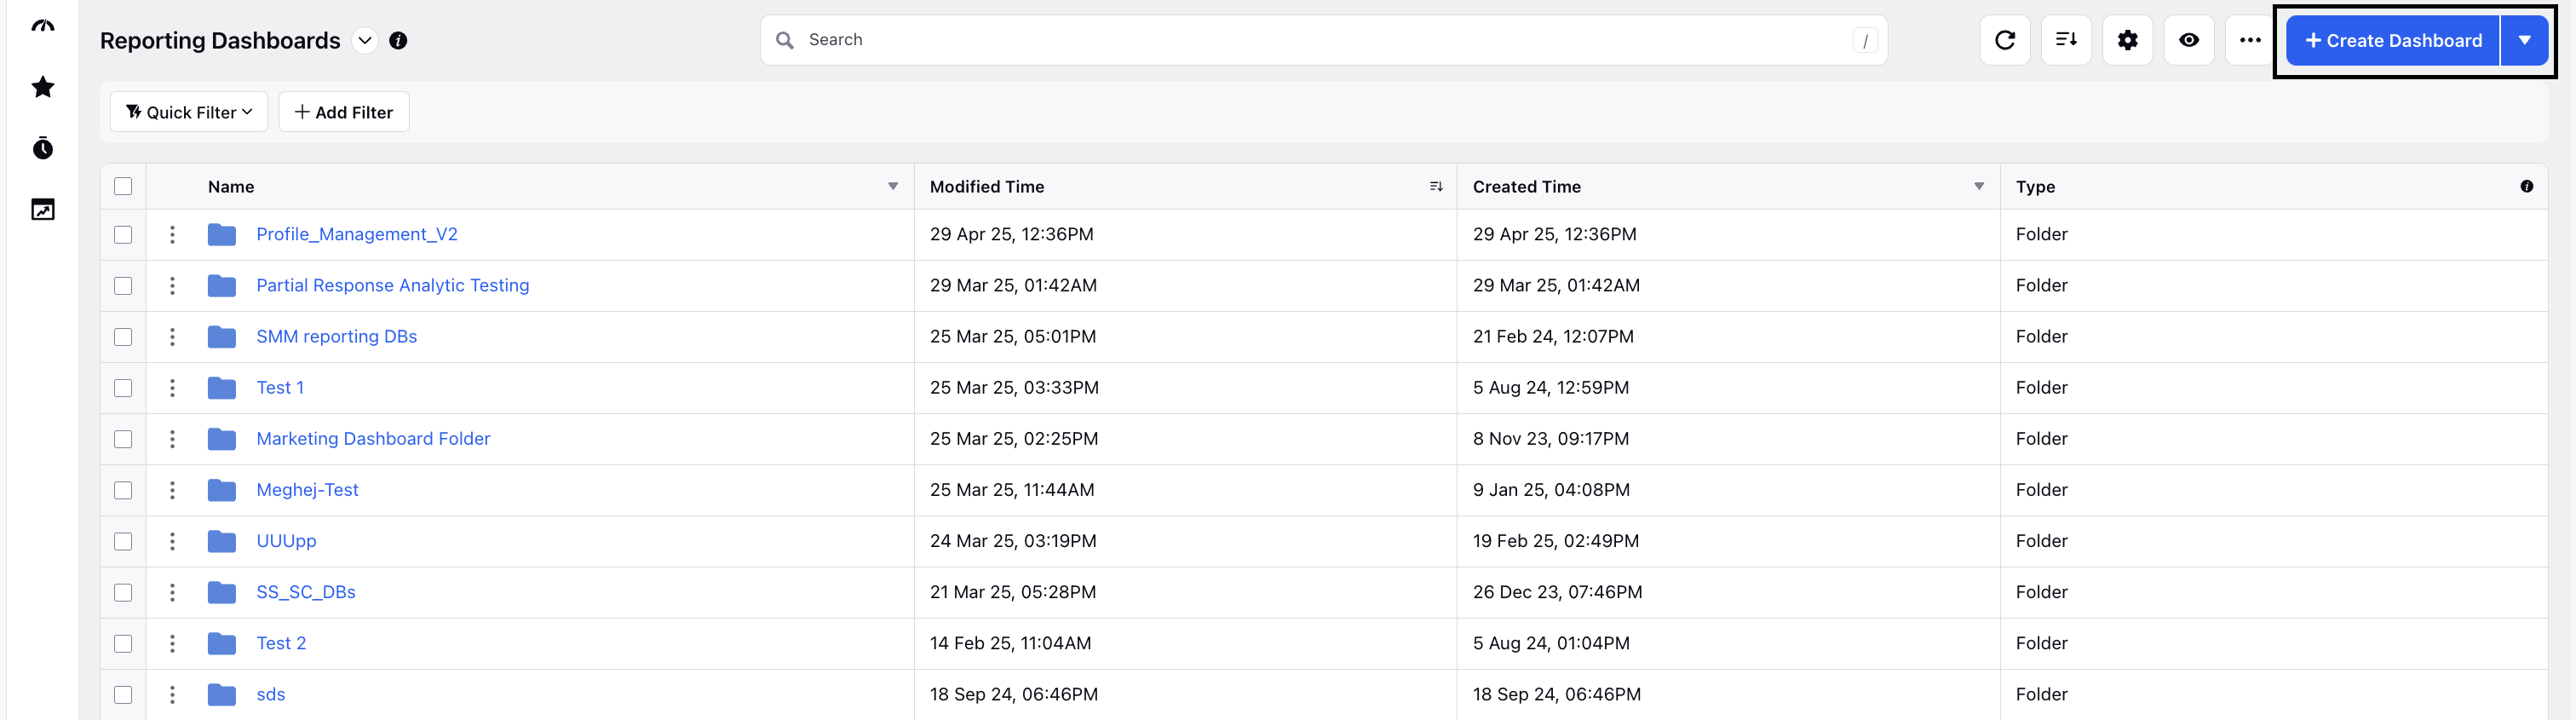
3. On the Reporting Dashboards screen, click Create Dashboard.
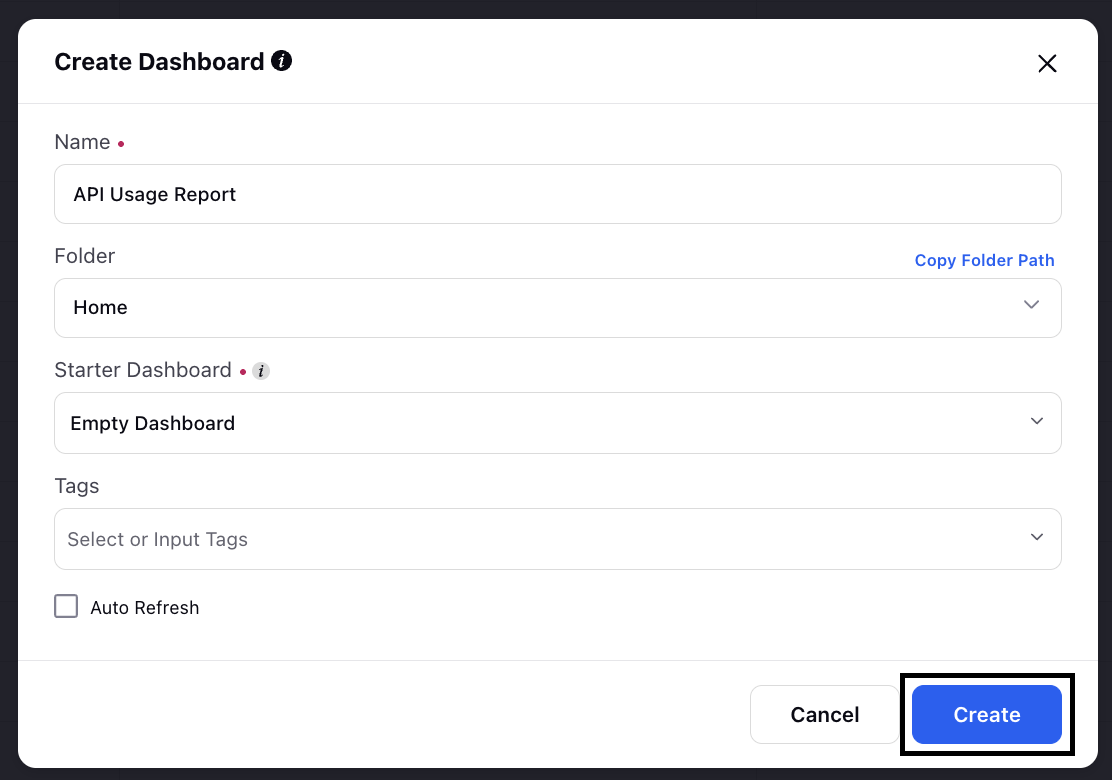
4. On the Create Dashboard window, enter the required details and click Create.
5. Next, add and configure a widget to monitor API usage. For detailed steps, see the Widget Configuration in Reporting article.
While configuring the widget, consider the following points:
In the Data Source drop-down, select Unified Log Reporting.
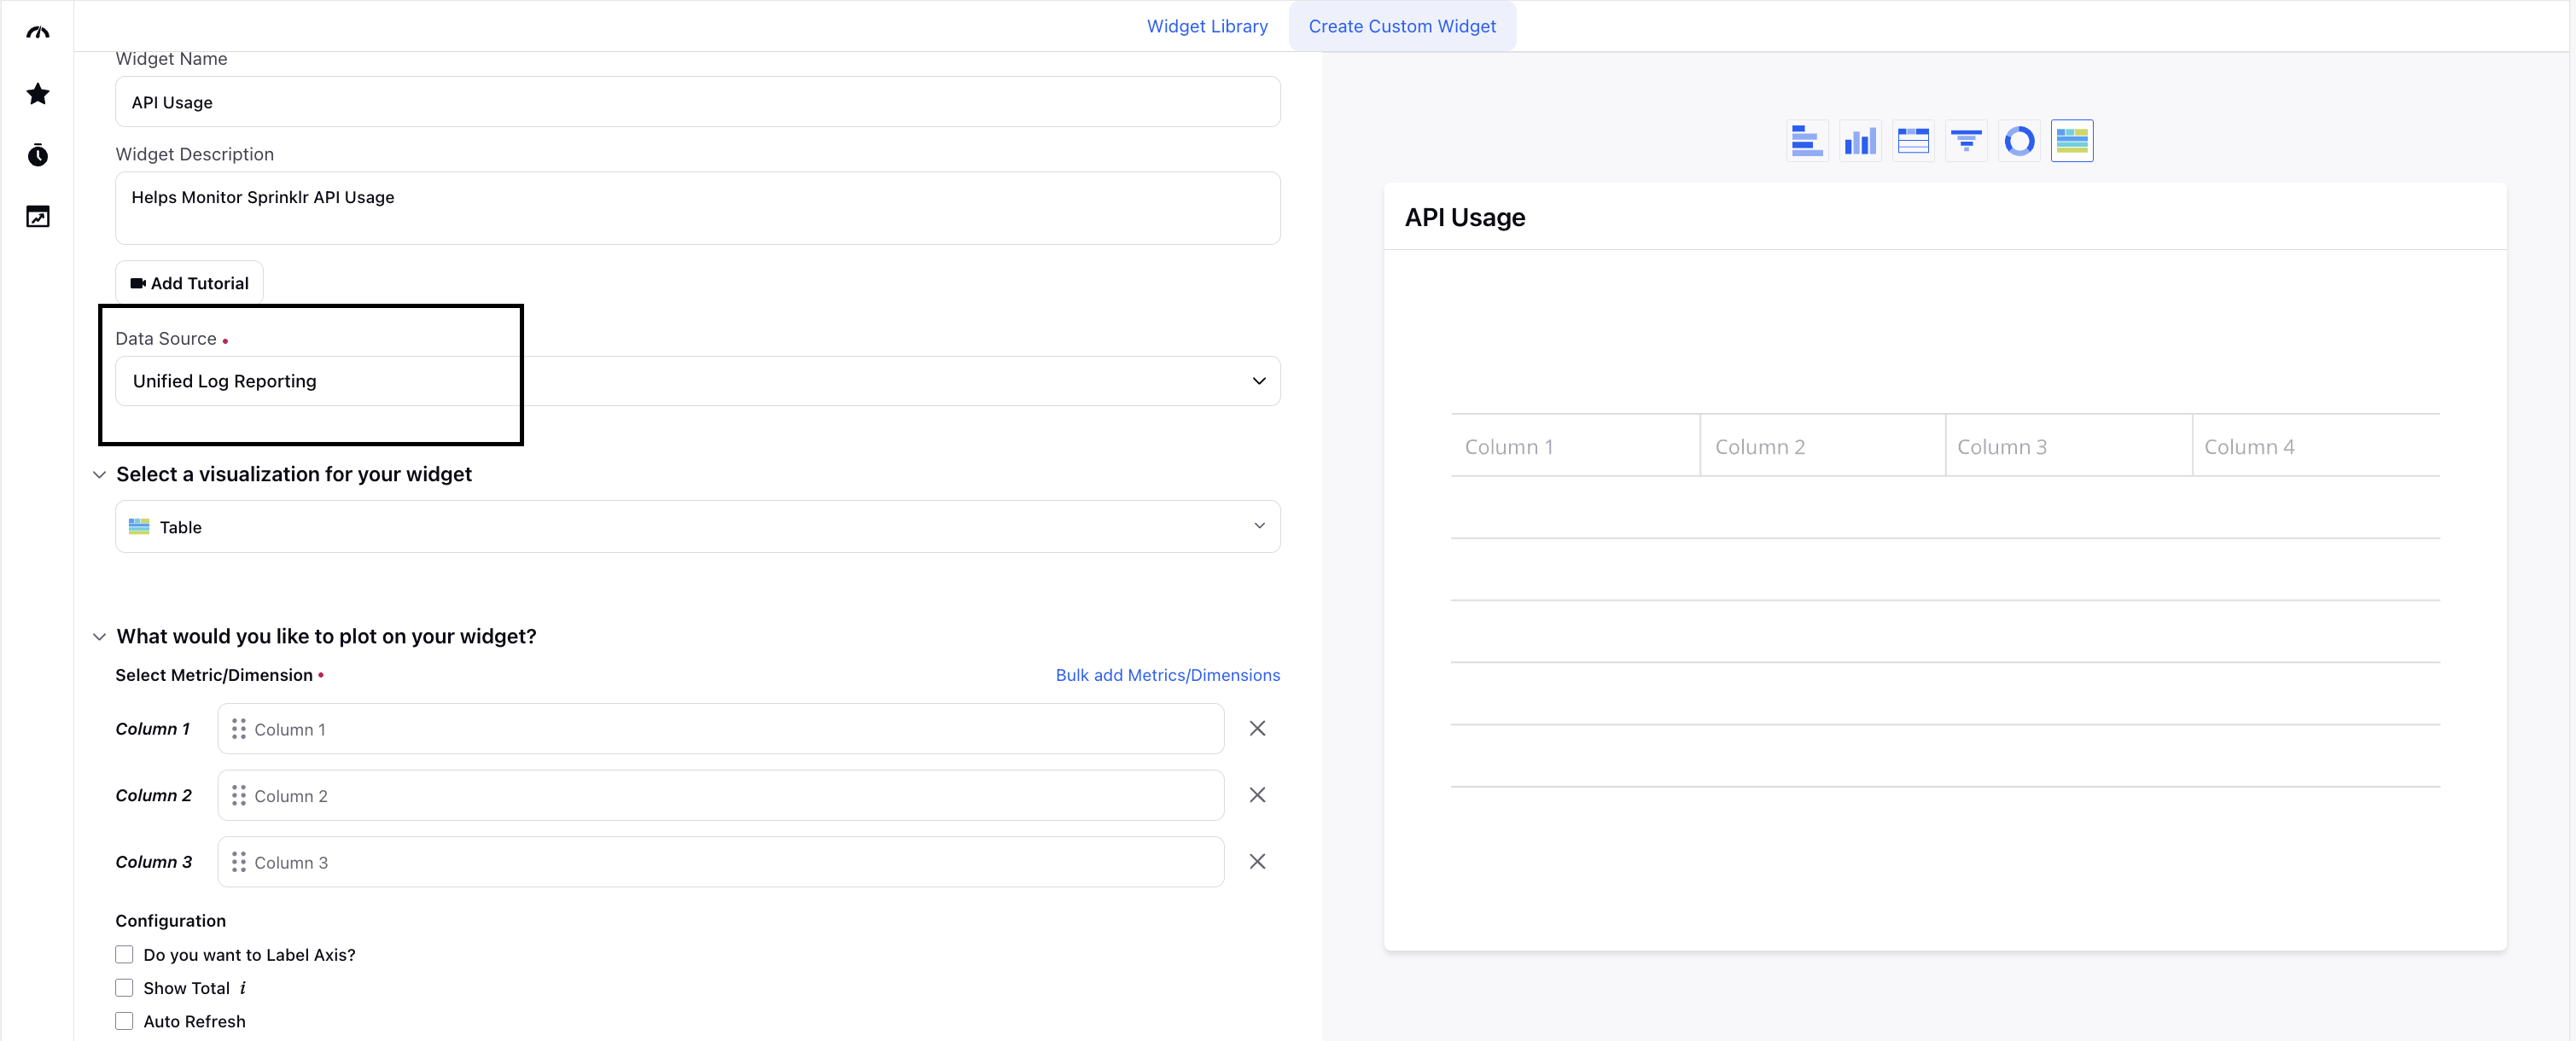
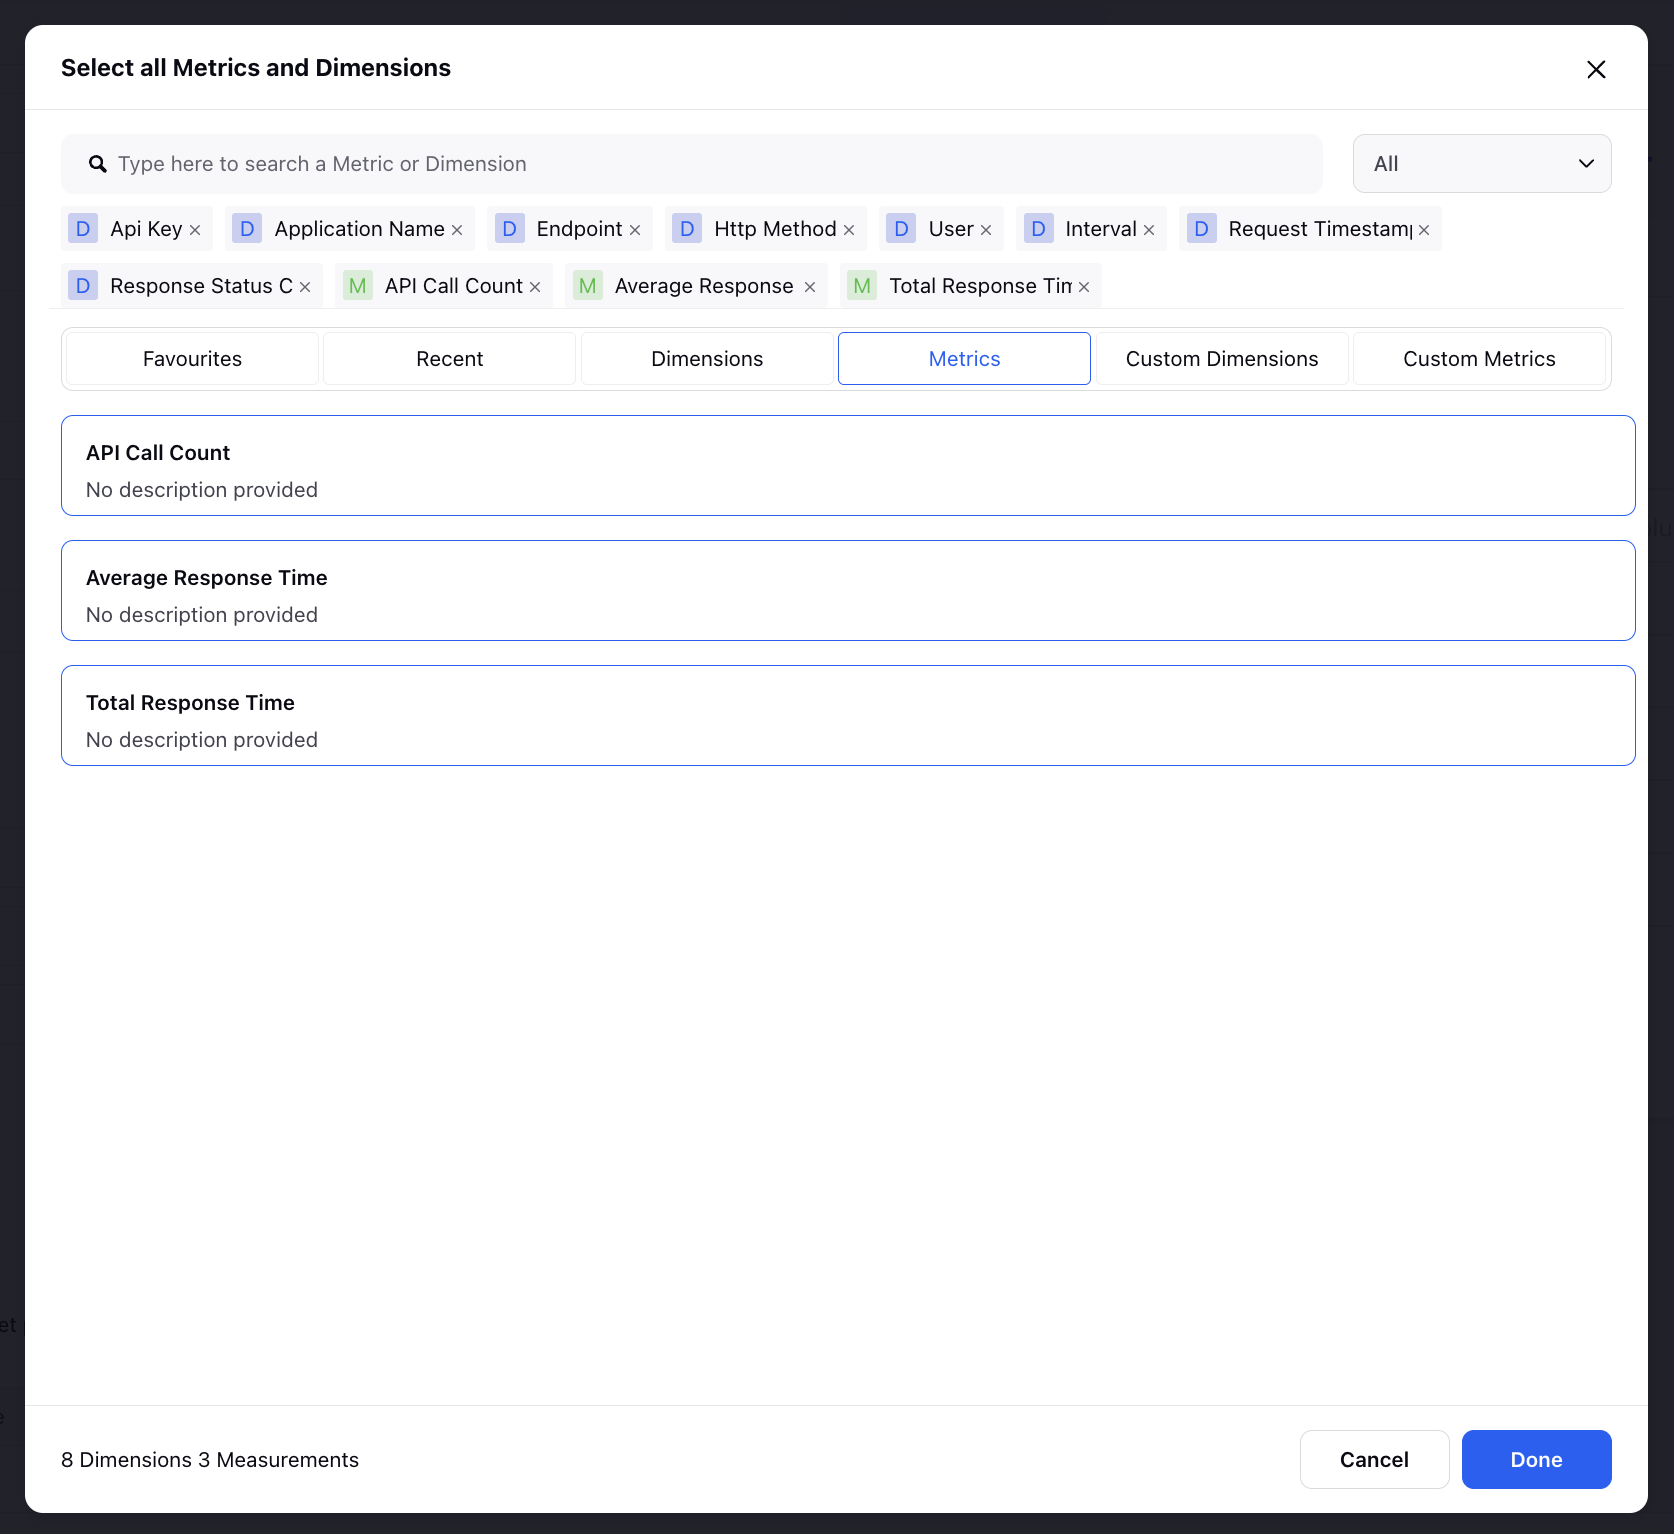
In the What would you like to plot on your widget section, select from the supported metrics and dimensions. For more details, see the Supported Dimensions and Metrics section.
Once configured and added, your widget will appear on the dashboard as shown below:

Supported Dimensions and Metrics
The following are the dimensions and metrics supported for API Usage Reporting:
Use Cases of API Usage Reporting Dashboard
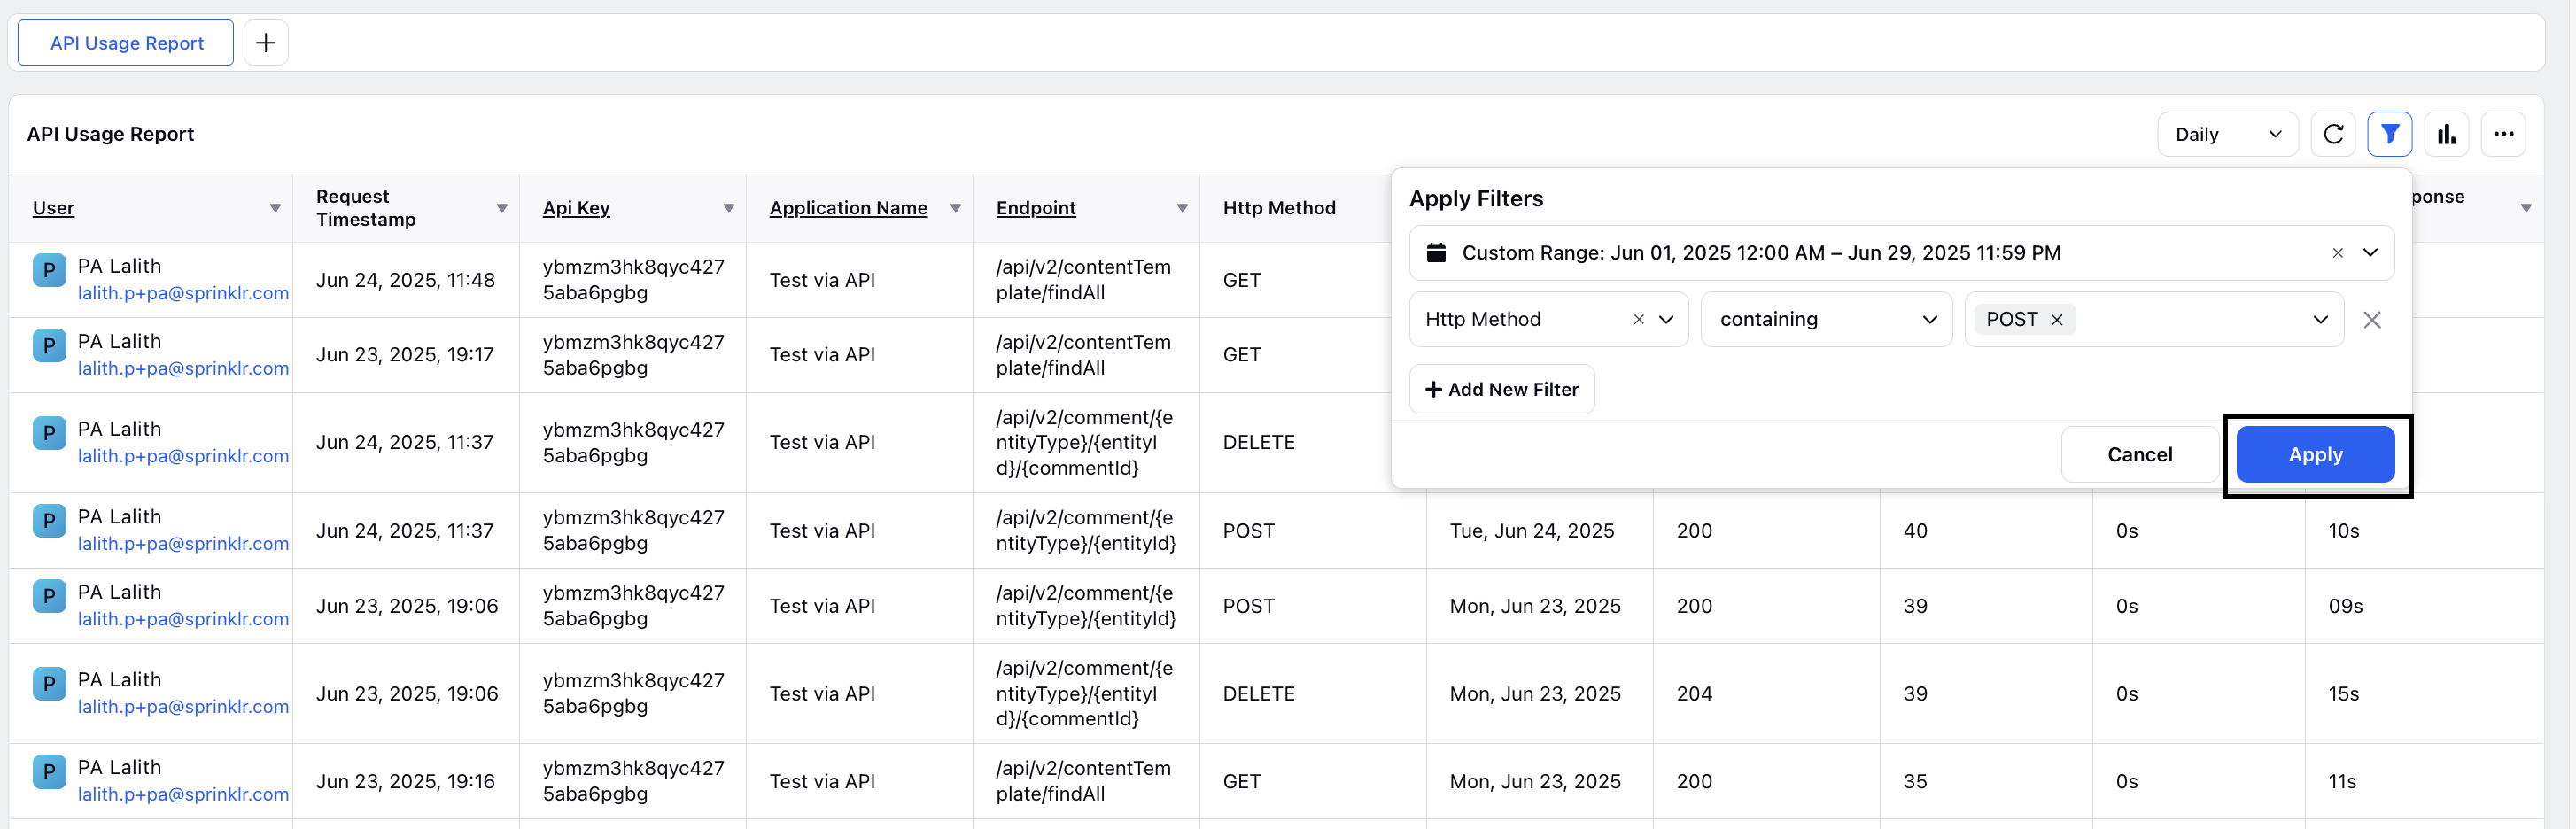
You can filter the dashboard based on the supported dimensions and metrics to gain valuable insights across multiple scenarios, including performance monitoring (such as failures and latency), usage analysis, and troubleshooting.
To filter the dashboard, follow these steps:
1. Click the Filters (![]() ) icon located at the top-right corner of the widget.
) icon located at the top-right corner of the widget.

2. Choose the time duration you want to analyze.
3. Select the dimension you want to filter by, such as Http Method.
4. Choose the appropriate type and values. Then, click Apply.
Analyzing Latency Issues
You can filter the dashboard by the Http Method dimension values such as GET, POST, PUT, and DELETE, and review the Average Response Time metric for each.
This helps identify which request types are slower. For example, if POST requests take longer than GET requests, you can prioritize optimizing the POST requests.
Dimension: Http Method
Metric: Average Response Time
Identifying and Reducing API Failures
Filter by Response Status Code to find error codes like 500 or 429 (rate limits). A spike in these errors signals backend issues or rate limit problems users need to address.
Dimension: Response Status Code
Metric: API Call Count
Detect Server-Side Failures
Filter by Response Status Code = 500 and monitor the volume using API Call Count. Frequent or repeated 500 errors suggest backend failures that need investigation.
Dimension: Response Status Code
Metric: API Call Count
These use cases highlight just a few ways to take advantage of the API Usage Reporting Dashboard in Sprinklr. With useful metrics and dimensions, the dashboard helps you uncover insights, monitor performance, troubleshoot issues, and improve API efficiency, supporting smoother and more reliable integration workflows.