Extension Reporting
Updated
The Extension Reporting feature in Sprinklr enables you to create robust dashboards that provide granular visibility into external API calls made through Sprinklr Extensions.
By using this capability, you can:
Track the performance of API integrations.
Monitor real-time status codes and latency.
Isolate and troubleshoot integration issues efficiently.
Enable enterprise-grade observability across environments.
This guide walks you through the configuration steps and lists the supported dimensions and metrics available in the Unified Log Reporting data source for Extension Reporting.
Benefits
Extension reporting offers the following benefits:
Proactive Monitoring: Identify issues in near real-time using status codes and response times.
Integration Reliability: Ensure all extensions are functioning as expected across production and non-production environments.
Performance Optimization: Drill down into specific methods and sources to identify bottlenecks or failures.
Data-Driven Decisions: Use accurate, aggregated logs to fine-tune extensions or trigger alerts based on performance thresholds.
Configure Extension Reporting
Follow these steps to configure Extension Reporting:
Step 1: Create a Reporting Widget
• Navigate to Care Reporting.
• Click + Create Widget button under a reporting dashboard to build a new report.
• For detailed steps, refer to Create a Reporting Widget.
Step 2: Select the Data Source
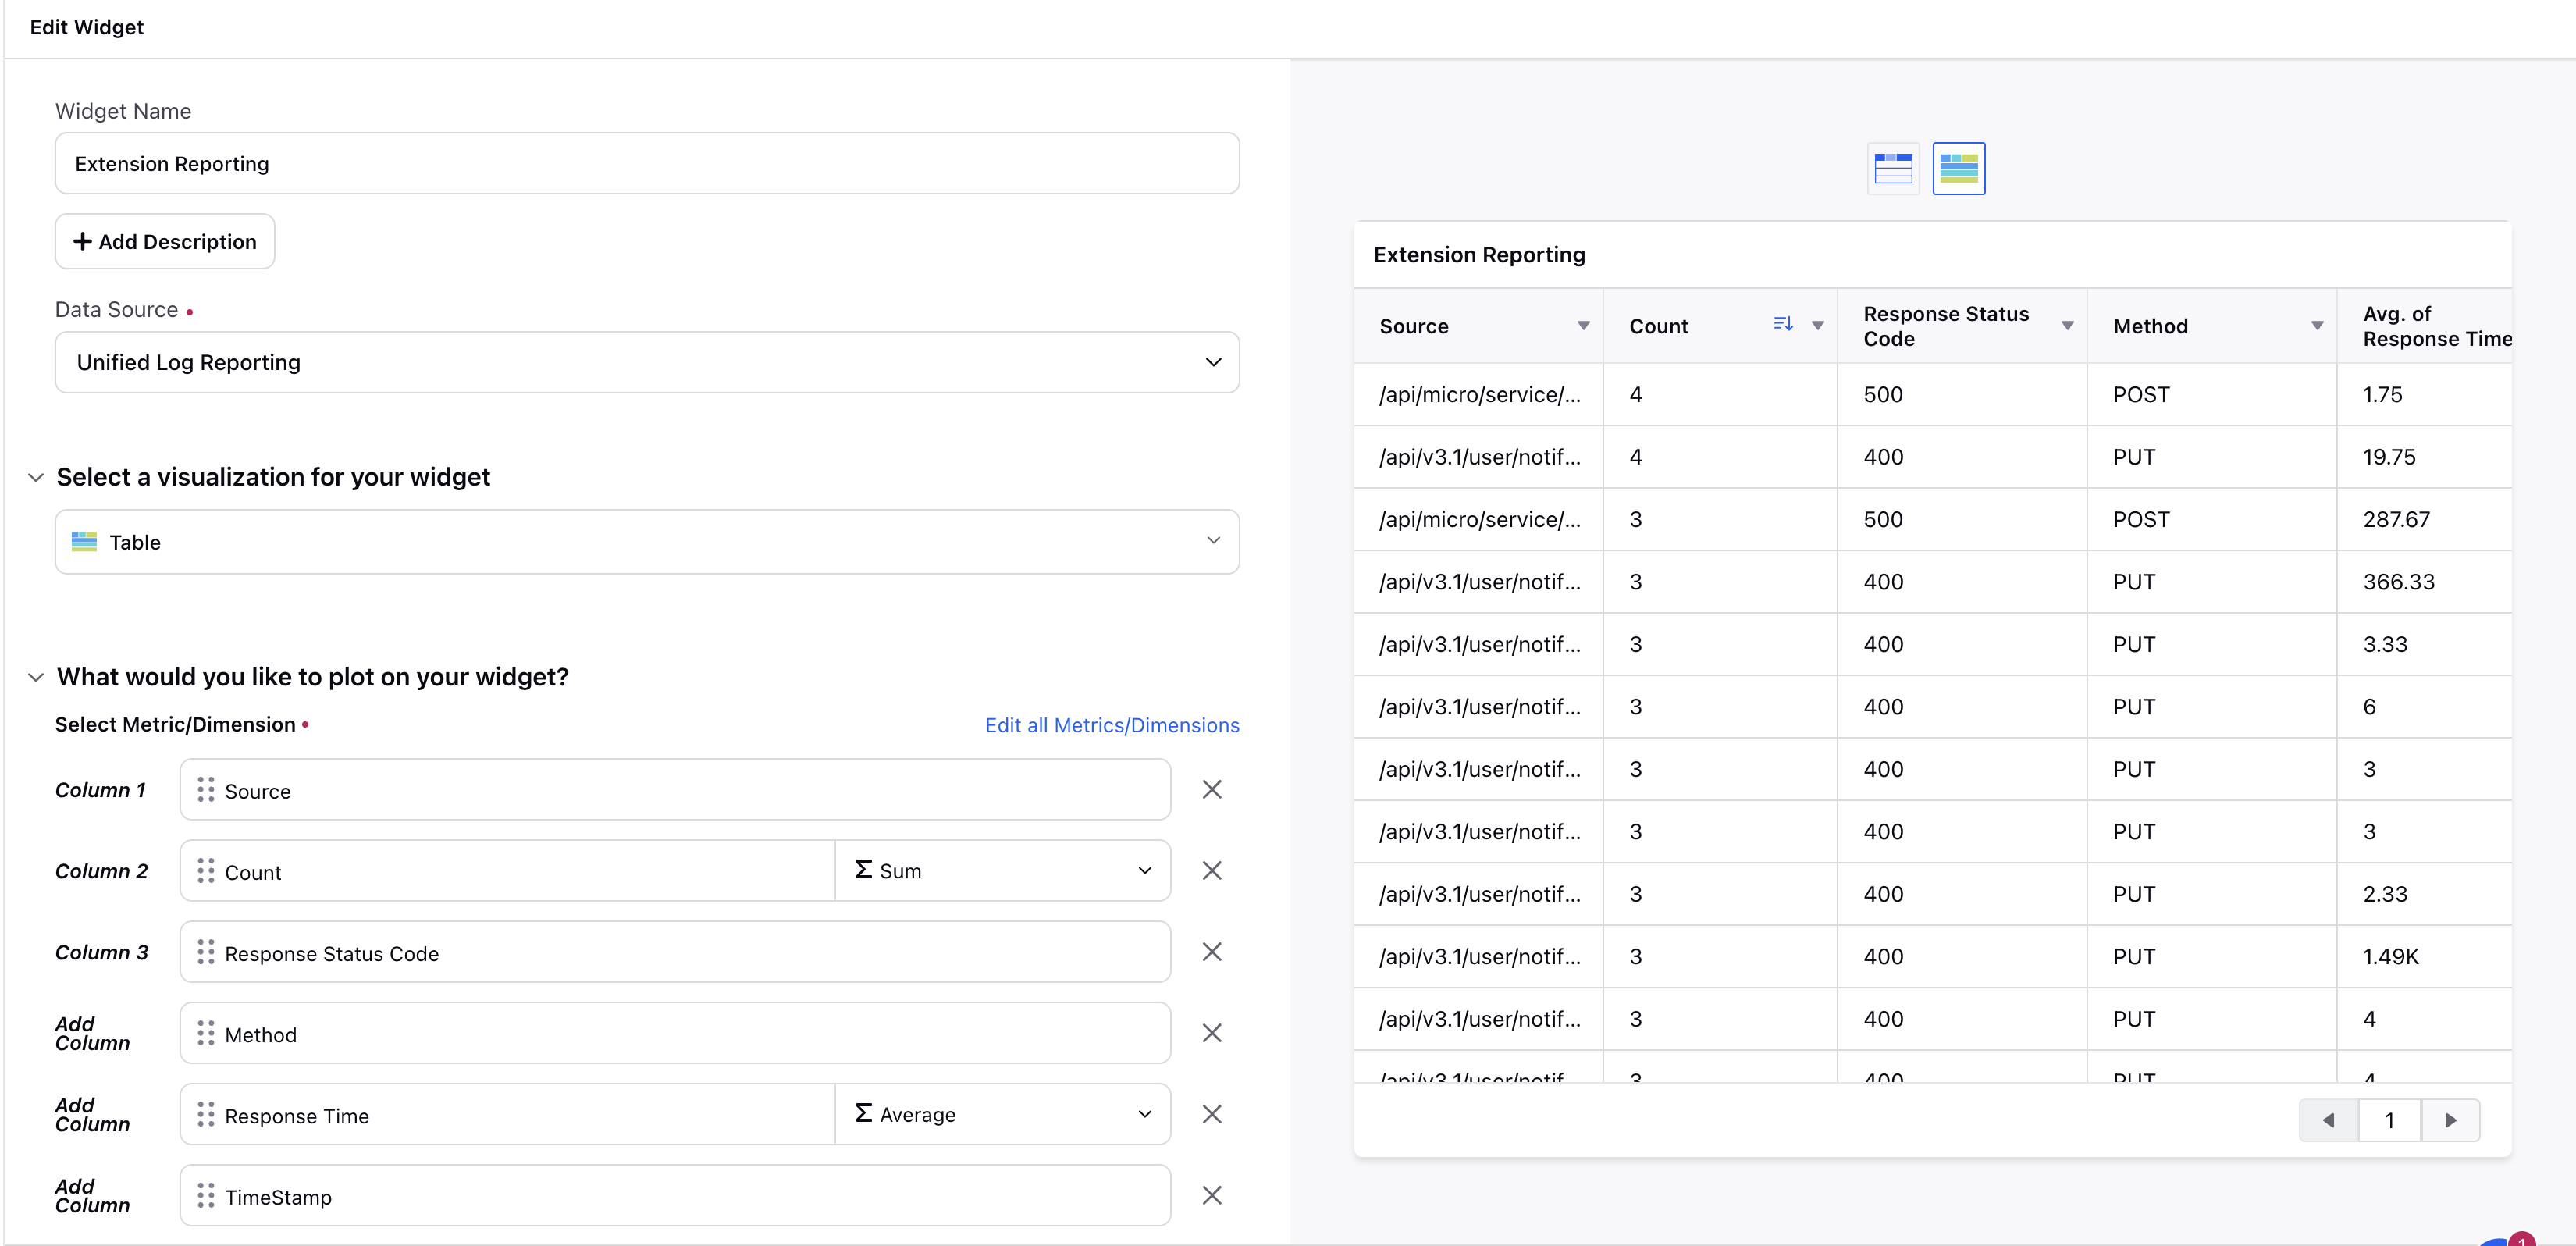
In the widget setup screen, choose Unified Log Reporting in the Data Source field from the dropdown.

Step 3: Add Metrics and Dimensions
Add relevant Metrics and Dimensions from the Unified Log Reporting source based on what you want to monitor.
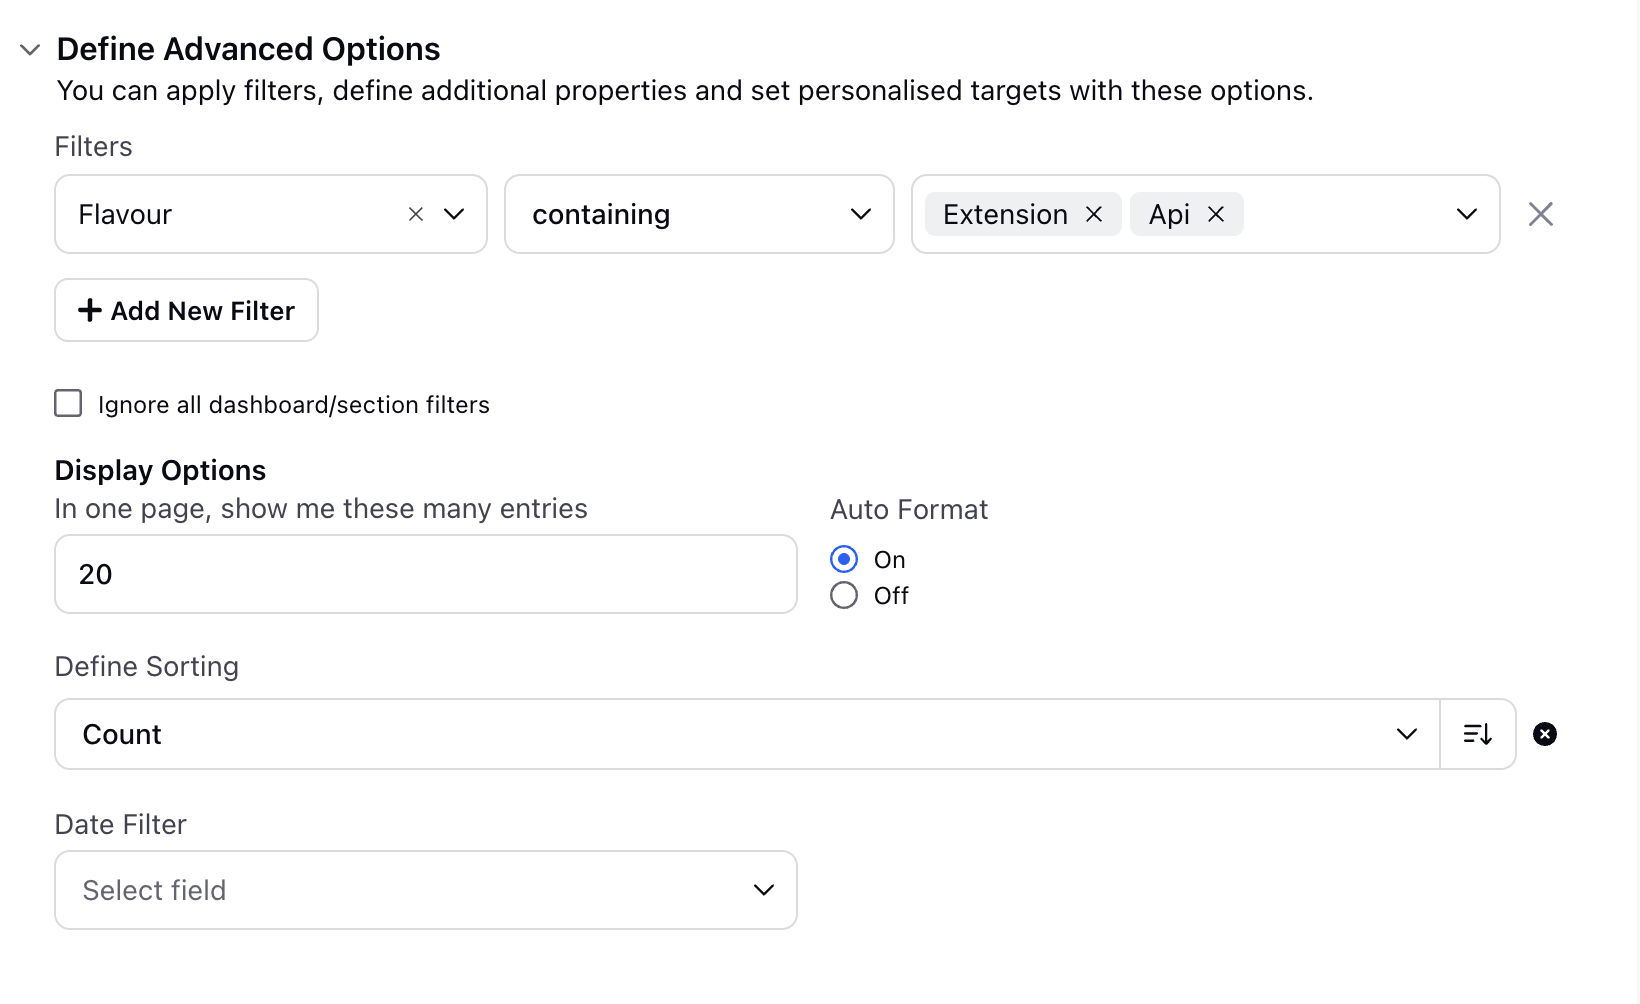
Apply filters (optional) to narrow down by method, status code, or specific extension source.
Supported Dimensions
These dimensions allow you to slice data for deeper insights into extension-based API interactions.
Name | Description |
Source | Name of the extension |
Status Code | HTTP response code returned by the API call (e.g., 200, 400, 500). |
Method | The HTTP method used for the request (GET, POST, PUT, DELETE) |
TimeStamp | Timestamp indicating when the API call was triggered. |
Flavour | Identifies the log type. |
Supported Metrics
These metrics help quantify API behavior for monitoring and alerting.
Name | Description |
Count | Total number of API calls triggered via Extensions. |
Response Time | Time taken by the external API to respond to the request |

Status Codes
The following Status Codes are supported:
Status Code | Description |
200s | Success |
400s | Client related errors |
500s | Server related errors |
-130 | Connection failure. |
For more details refer to API Errors and Status Codes.
Example Use Cases
You can use the extension reporting for the following example use cases.
1. Monitor API Failure Trends
Dimension: Status Code
Metric: Count
Use: Visualize spikes in 4xx or 5xx status codes to identify failing endpoints.
2. Analyze Latency Across Environments
Dimensions: Source, Flavour
Metric: Response Time
Use: Compare response times of the same Extension across staging and production.
3. Audit Extension Usage
Dimension: Method
Metric: Count
Use: Identify the most frequently called API methods by your Extensions.
Extension Reporting equips you with tools to monitor, debug, and improve your external API integrations using Sprinklr Extensions. With real-time visibility and actionable insights, organizations can maintain robust system health and deliver superior operational efficiency.