Define Y-Axis Scale in widgets
Updated
While creating or adding a widget to any of your dashboards, you can use the Define Y-Axis Scale feature (available under the Configuration section). It will help you define the custom values for minimum and maximum Y-Axis along with the step size for the number of divisions.
The dashboard widgets supporting this feature are Column, Stacked Column, Bar, Stacked Bar, Line, Spline, Area, Area Spline, Bubble, Stacked Twin Axis, Combination, and Dual Axis.
Using this feature, you will get better control over the Y-axis scales for the above-supported dashboard widgets.
To define Y-Axis Scale in widgets
To drill down on a widget, you can use any existing editable dashboard with widgets present. You can also create a new custom dashboard and add a widget.
Once you have the dashboard, follow the steps given below –
Click the New Tab Icon. Under Sprinklr Insights, open any reporting dashboard (Listening, Benchmarking, etc.) into which you want to add or edit the widget.
Click Add Widget in the top right corner to add a new widget.
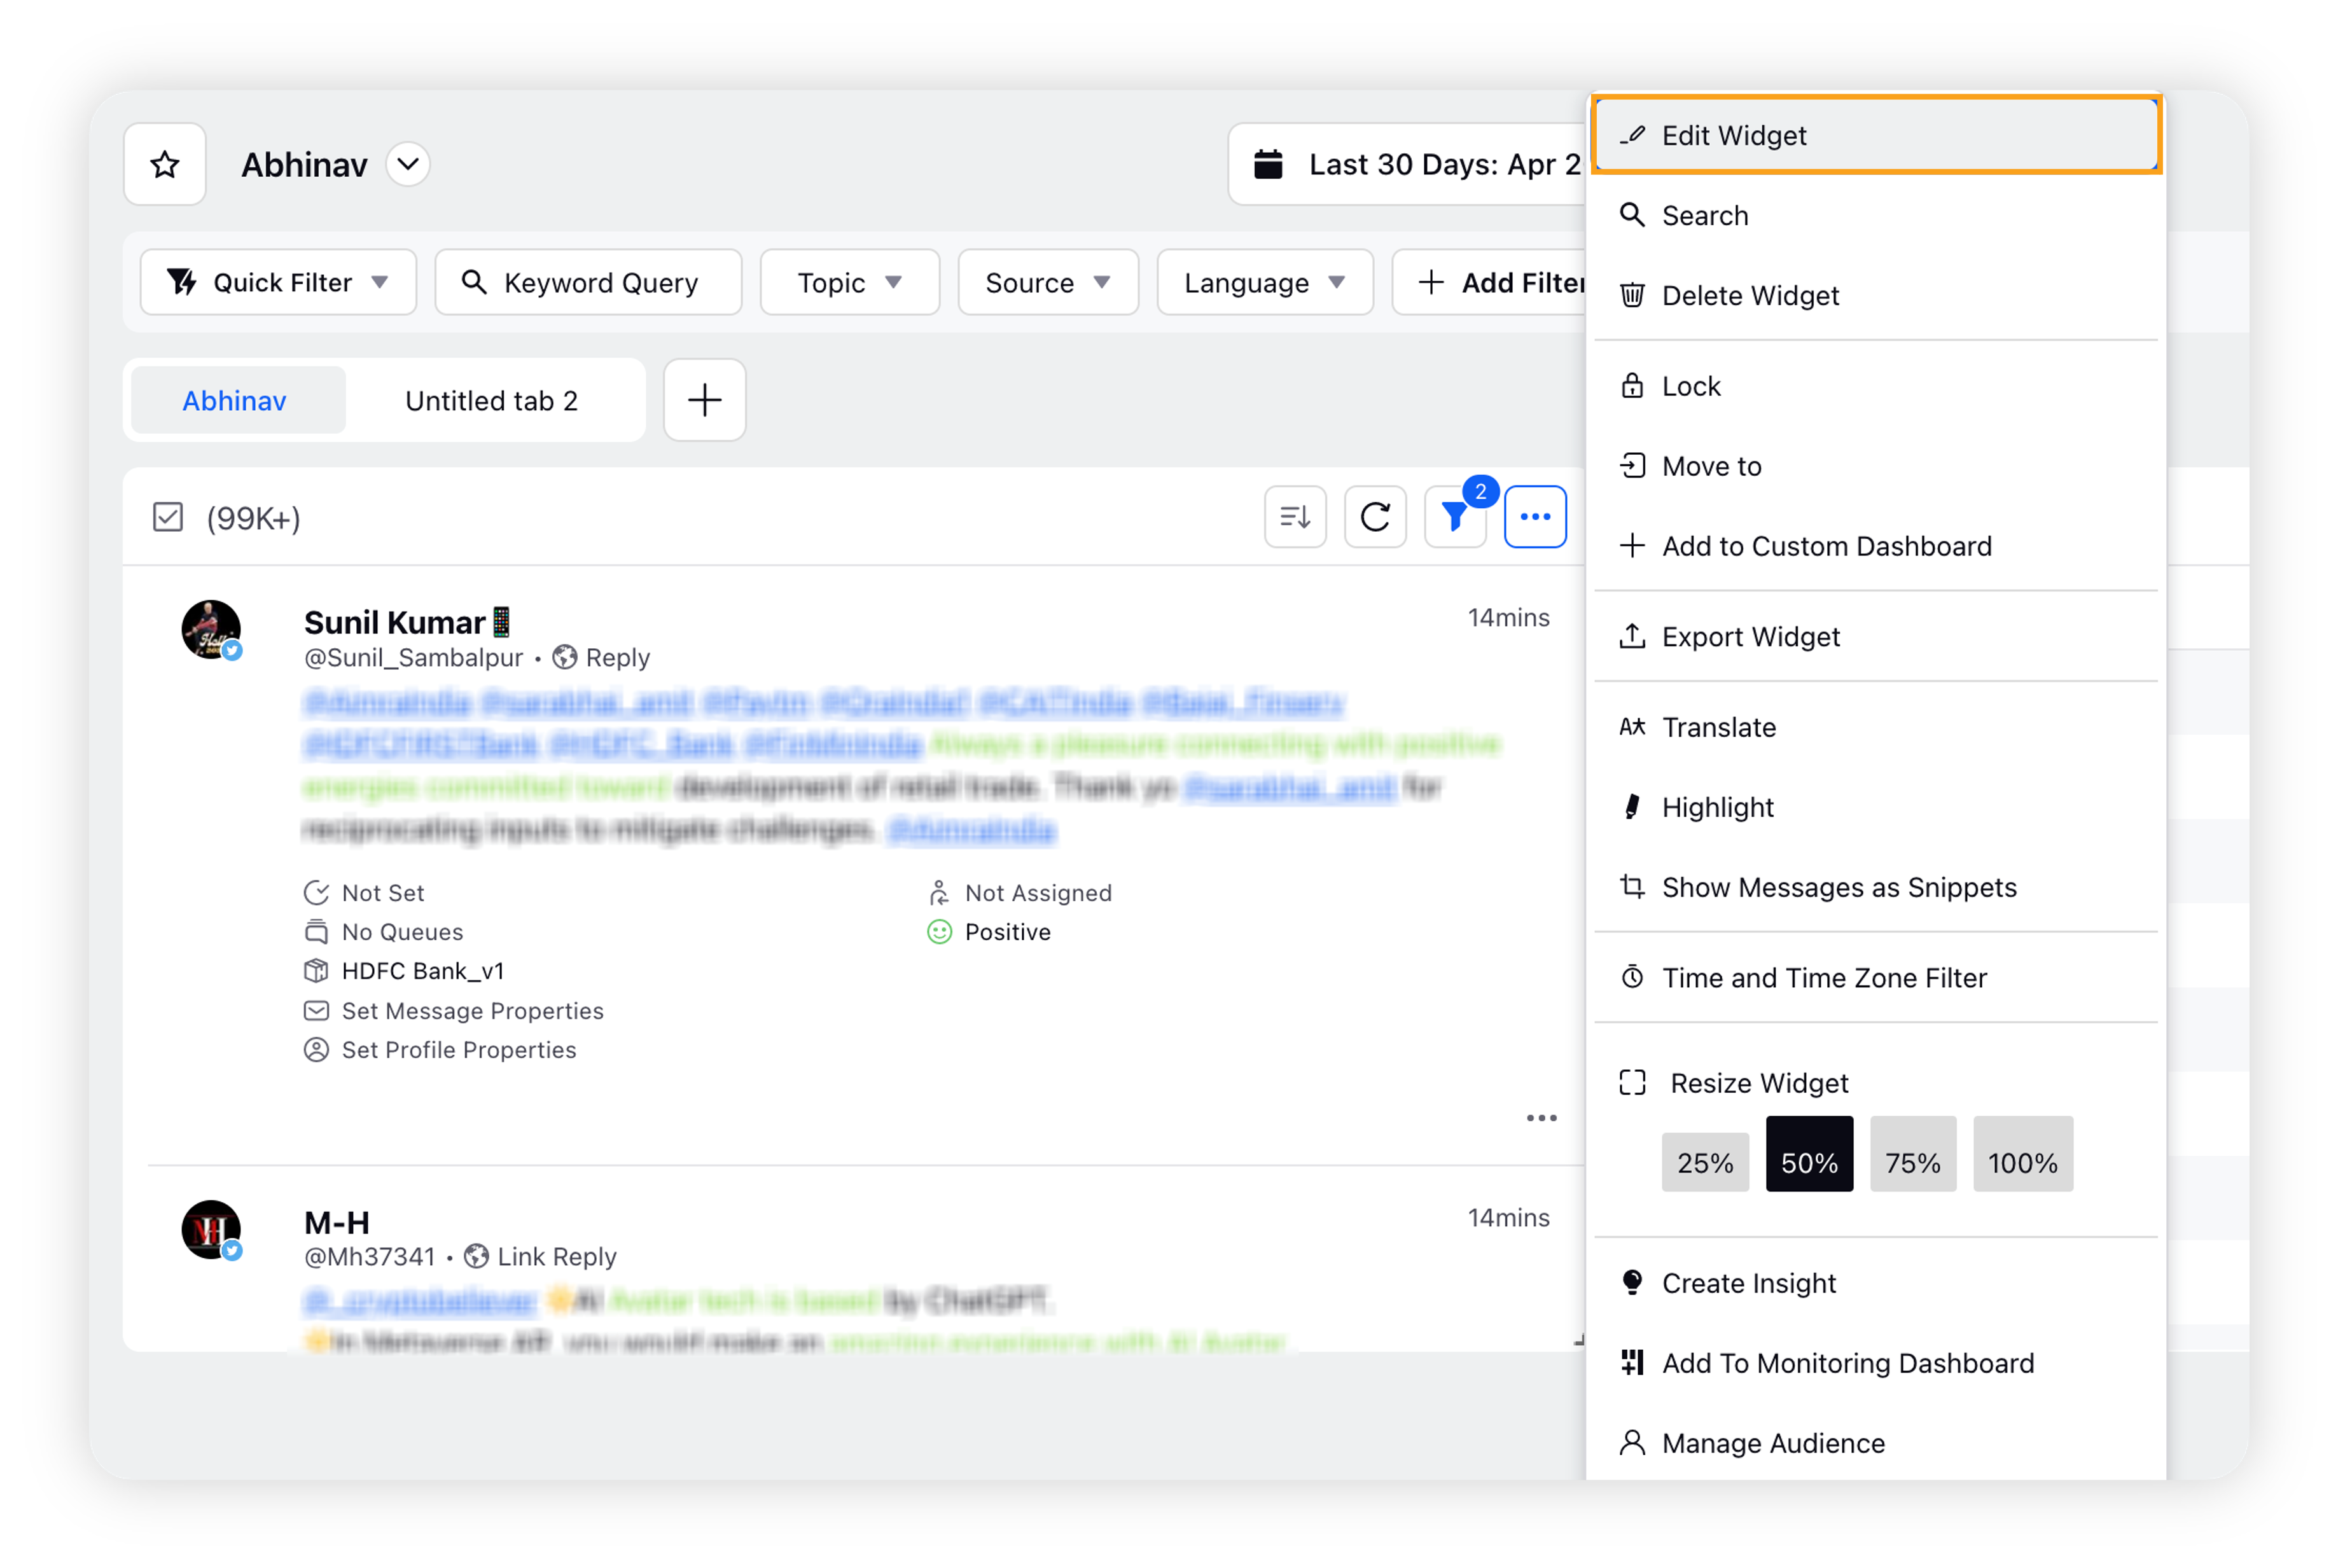
If you want to use the Define Y-Axis Scale feature in an existing widget, click the Options icon in the top right corner of the widget and select Edit Widget.
On the Widget Editor window, enter the necessary details if you are creating a new widget.
Under the Configuration section, click the checkbox next to the Define Y-Axis Scale option.
Enter the desired values for Minimum Y/X-Axis Bound and Maximum Y-Axis Bound along with Step Size with Y-Axis. A preview will be generated on the right side of the window.
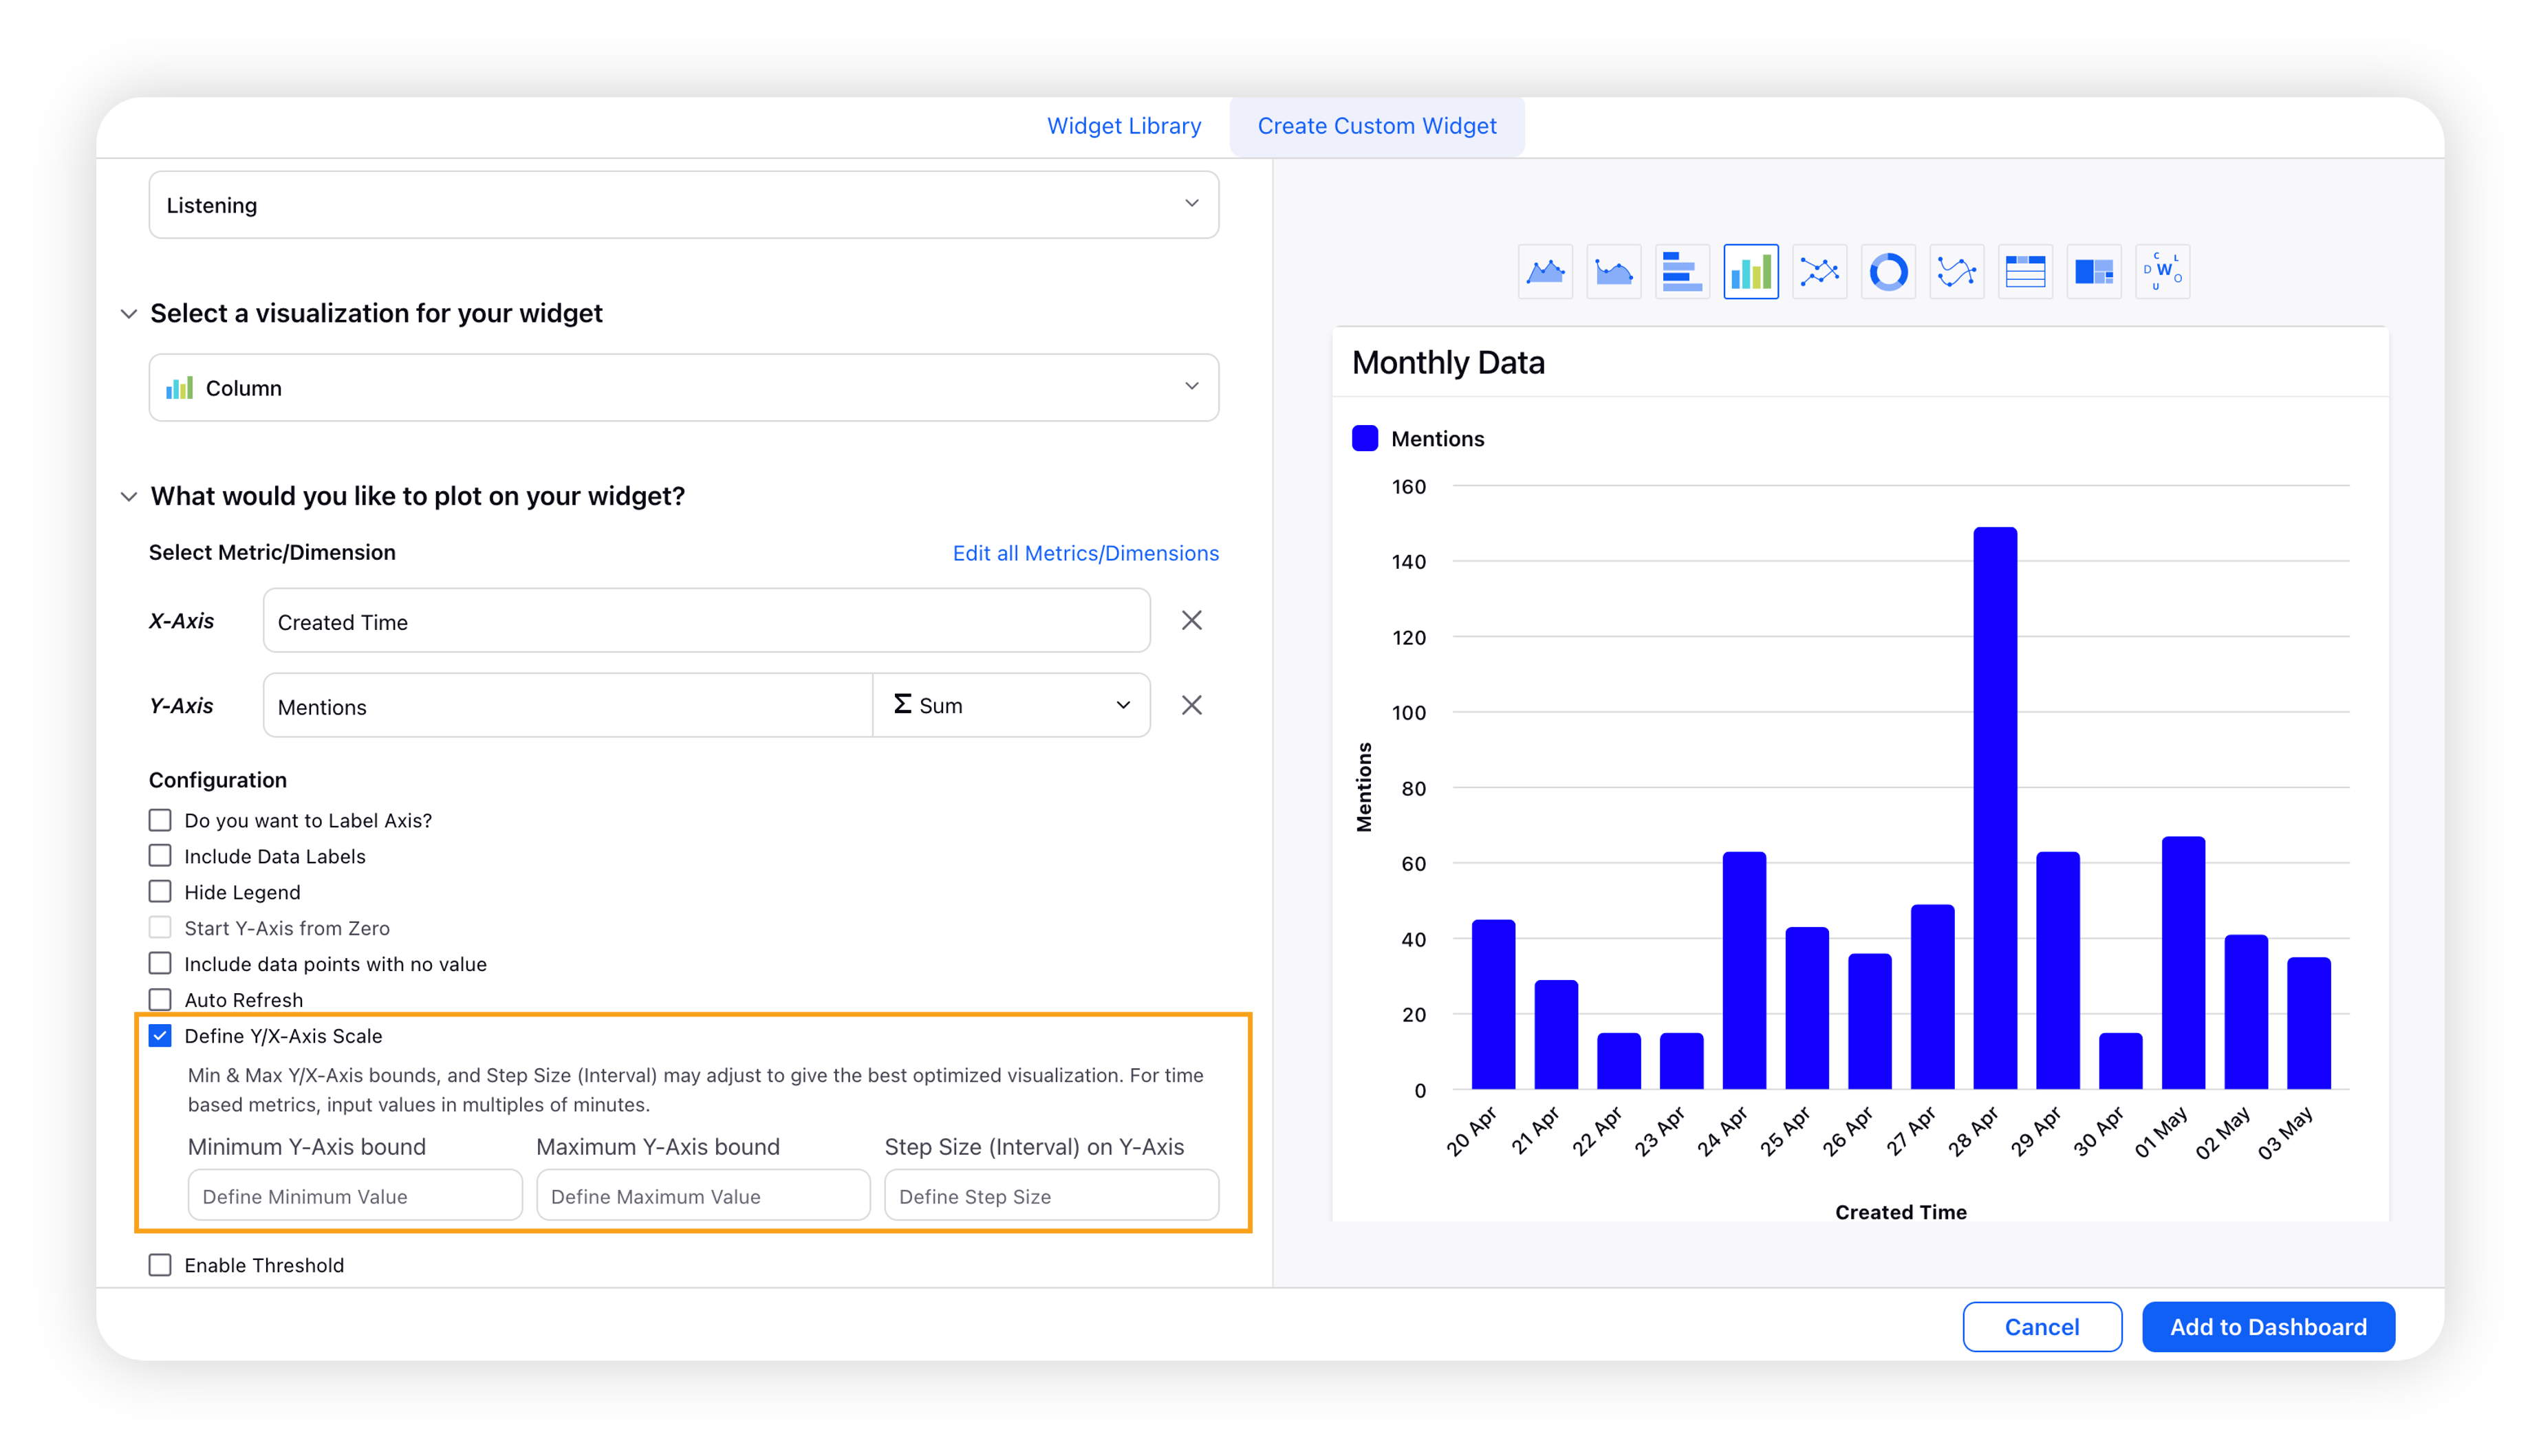
Minimum Y-Axis Bound: This is the minimum value from which you want to start your Y-Axis Scale
Maximum Y-Axis Bound: This is the maximum value up to which you want to keep your Y-Axis Scale.
Step Size with Y-Axis: This is the step size for the number of divisions you want to use for the Y-Axis Scale.
Click Add to Dashboard in the bottom right corner.
![]() Note: Min & Max Y/X-Axis bounds and Step Size (Interval) may adjust to give the best-optimized visualization. For time-based metrics, input values in multiples of minutes.
Note: Min & Max Y/X-Axis bounds and Step Size (Interval) may adjust to give the best-optimized visualization. For time-based metrics, input values in multiples of minutes.
Validations
The minimum value should be less than the maximum value (if specified).
The maximum value should be greater than the minimum value (if specified).
The value in the Step Size should be less than or equal to (Max-Min) if both specified.
Scaling is applicable only for metrics.
For the Bar and Stacked Bar type of charts, this feature works as Define X-Axis Scale.
Expected behaviors
If only one value is specified for the Y-Axis Scale, the specified value will be considered and rounded off (if applicable), and the other values will be picked automatically from the series.
If no value is selected for Minimum, Maximum, or Step Size, the algorithm will pick the values automatically from the series.
If you do not select the Define Y-Axis Label option, in this case also, the algorithm will pick the values automatically from the series.
Define Y-Axis Label will have a priority over Start Y-Axis from 0. Selecting the option Define Y-Axis Label will disable Start Y-Axis from 0.