Hierarchical Reporting
Updated
Hierarchical Reporting helps you organize survey data according to your organization's structure, making it easier for teams at different hierarchical levels to access and analyze relevant information. The structured approach ensures that feedback data is effectively utilized across multiple survey projects. Key features include:
Granular Insights: Teams can analyze specific segments like individual stores, departments or regions to understand targeted feedback and identify areas for improvement.
Customizable Dashboards: Level heads and senior leadership can receive automated, role-specific reports that summarize feedback across their hierarchy levels.
Dynamic Updates: Admins can update hierarchy data by uploading an Excel file containing only the rows that need modification, simplifying the process of keeping organizational data up to date.
One-Time Setup: The hierarchy can be set up once using a guided process with Excel or CSV files, and this hierarchy can then be linked to multiple survey projects, eliminating the need for repetitive setup tasks.
Business Problems Solved
Multi-Level Team Performance Analysis:
Identifying underperforming stores from customer surveys can be challenging when the results lack location-specific breakdowns.
Example: By using hierarchical reporting tools, organizations can structure the data for different regions and stores, etc. enabling them to pinpoint stores with lower satisfaction scores. This approach allows for targeted improvements, ultimately enhancing the overall customer experience.
 Note: The hierarchies, such as Region or Store, are not hard-coded and can be customized. These are flexible levels that can be named according to your specific needs.
Strategic Feedback Monitoring Across Hierarchies:
Tracking guest feedback across multiple properties can be challenging without structured data, making it difficult to identify trends and measure the success of initiatives.
By using Hierarchical Reporting Feature, data can be organized by organization, region and property, providing high-level summaries and highlighting recurring issues. These insights help evaluate the effectiveness of initiatives and prioritize investments in properties that need the most attention.
Value Additions
Value Additions can be explained with the help of examples:
With hierarchical reporting, for retail stores you can analyze survey data at multiple levels like region, store and department.
Example: By identifying dissatisfaction in urban stores due to long checkout times, the manager can implement a digital queue management system, leading to improved customer satisfaction.
In Hospitality industry you can monitor guest feedback across corporate, regional, and property levels.
Example: When identifying housekeeping delays in a specific region, they allocate resources to improve service standards and boosting the region’s Net Promoter Score.
Configuration Steps for Setting up Hierarchy
Create an organizational file where each row represents an individual record from the lowest level of the hierarch(the chain of command will be established by linking each row to its superior using the values in the corresponding columns).
Lets understand this with the help of an example of the format which can be uploaded:
Column
Description
Store ID
Mention the unqiue ID allocated to a store.
Store Name
Add the name of the store.
Area Name
Mention the area where the store belongs to
Region Name
Mention the region where the area belongs to.
Country Name
Mention the country in which the region belongs to.

Go to + New Page > Launchpad > Sprinklr Insights > Customer Feedback Management.
Go to Global Settings.
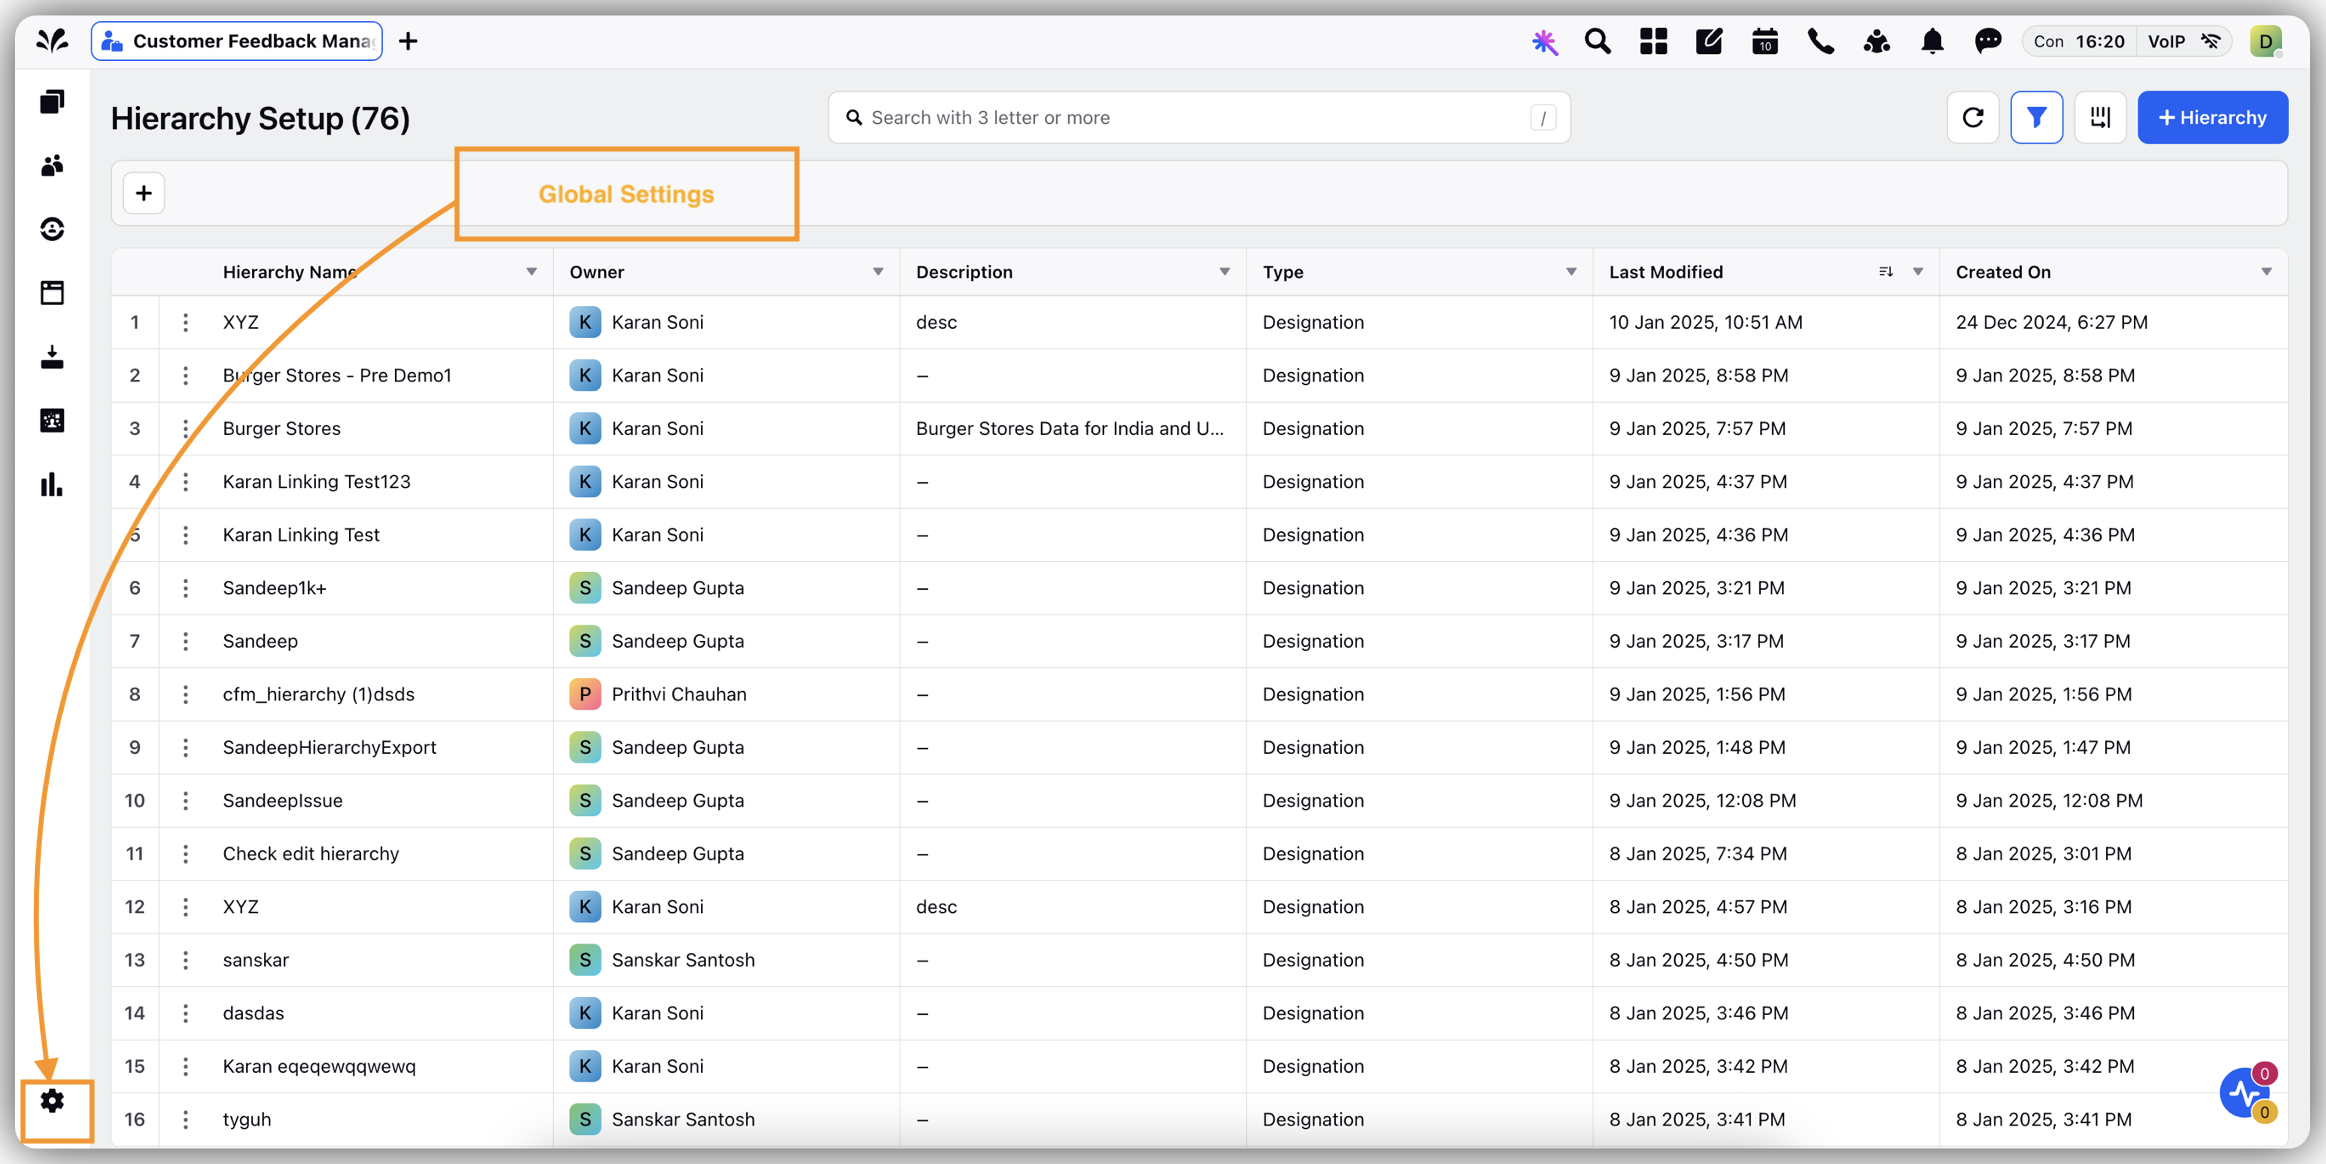
Click Hierarchies.
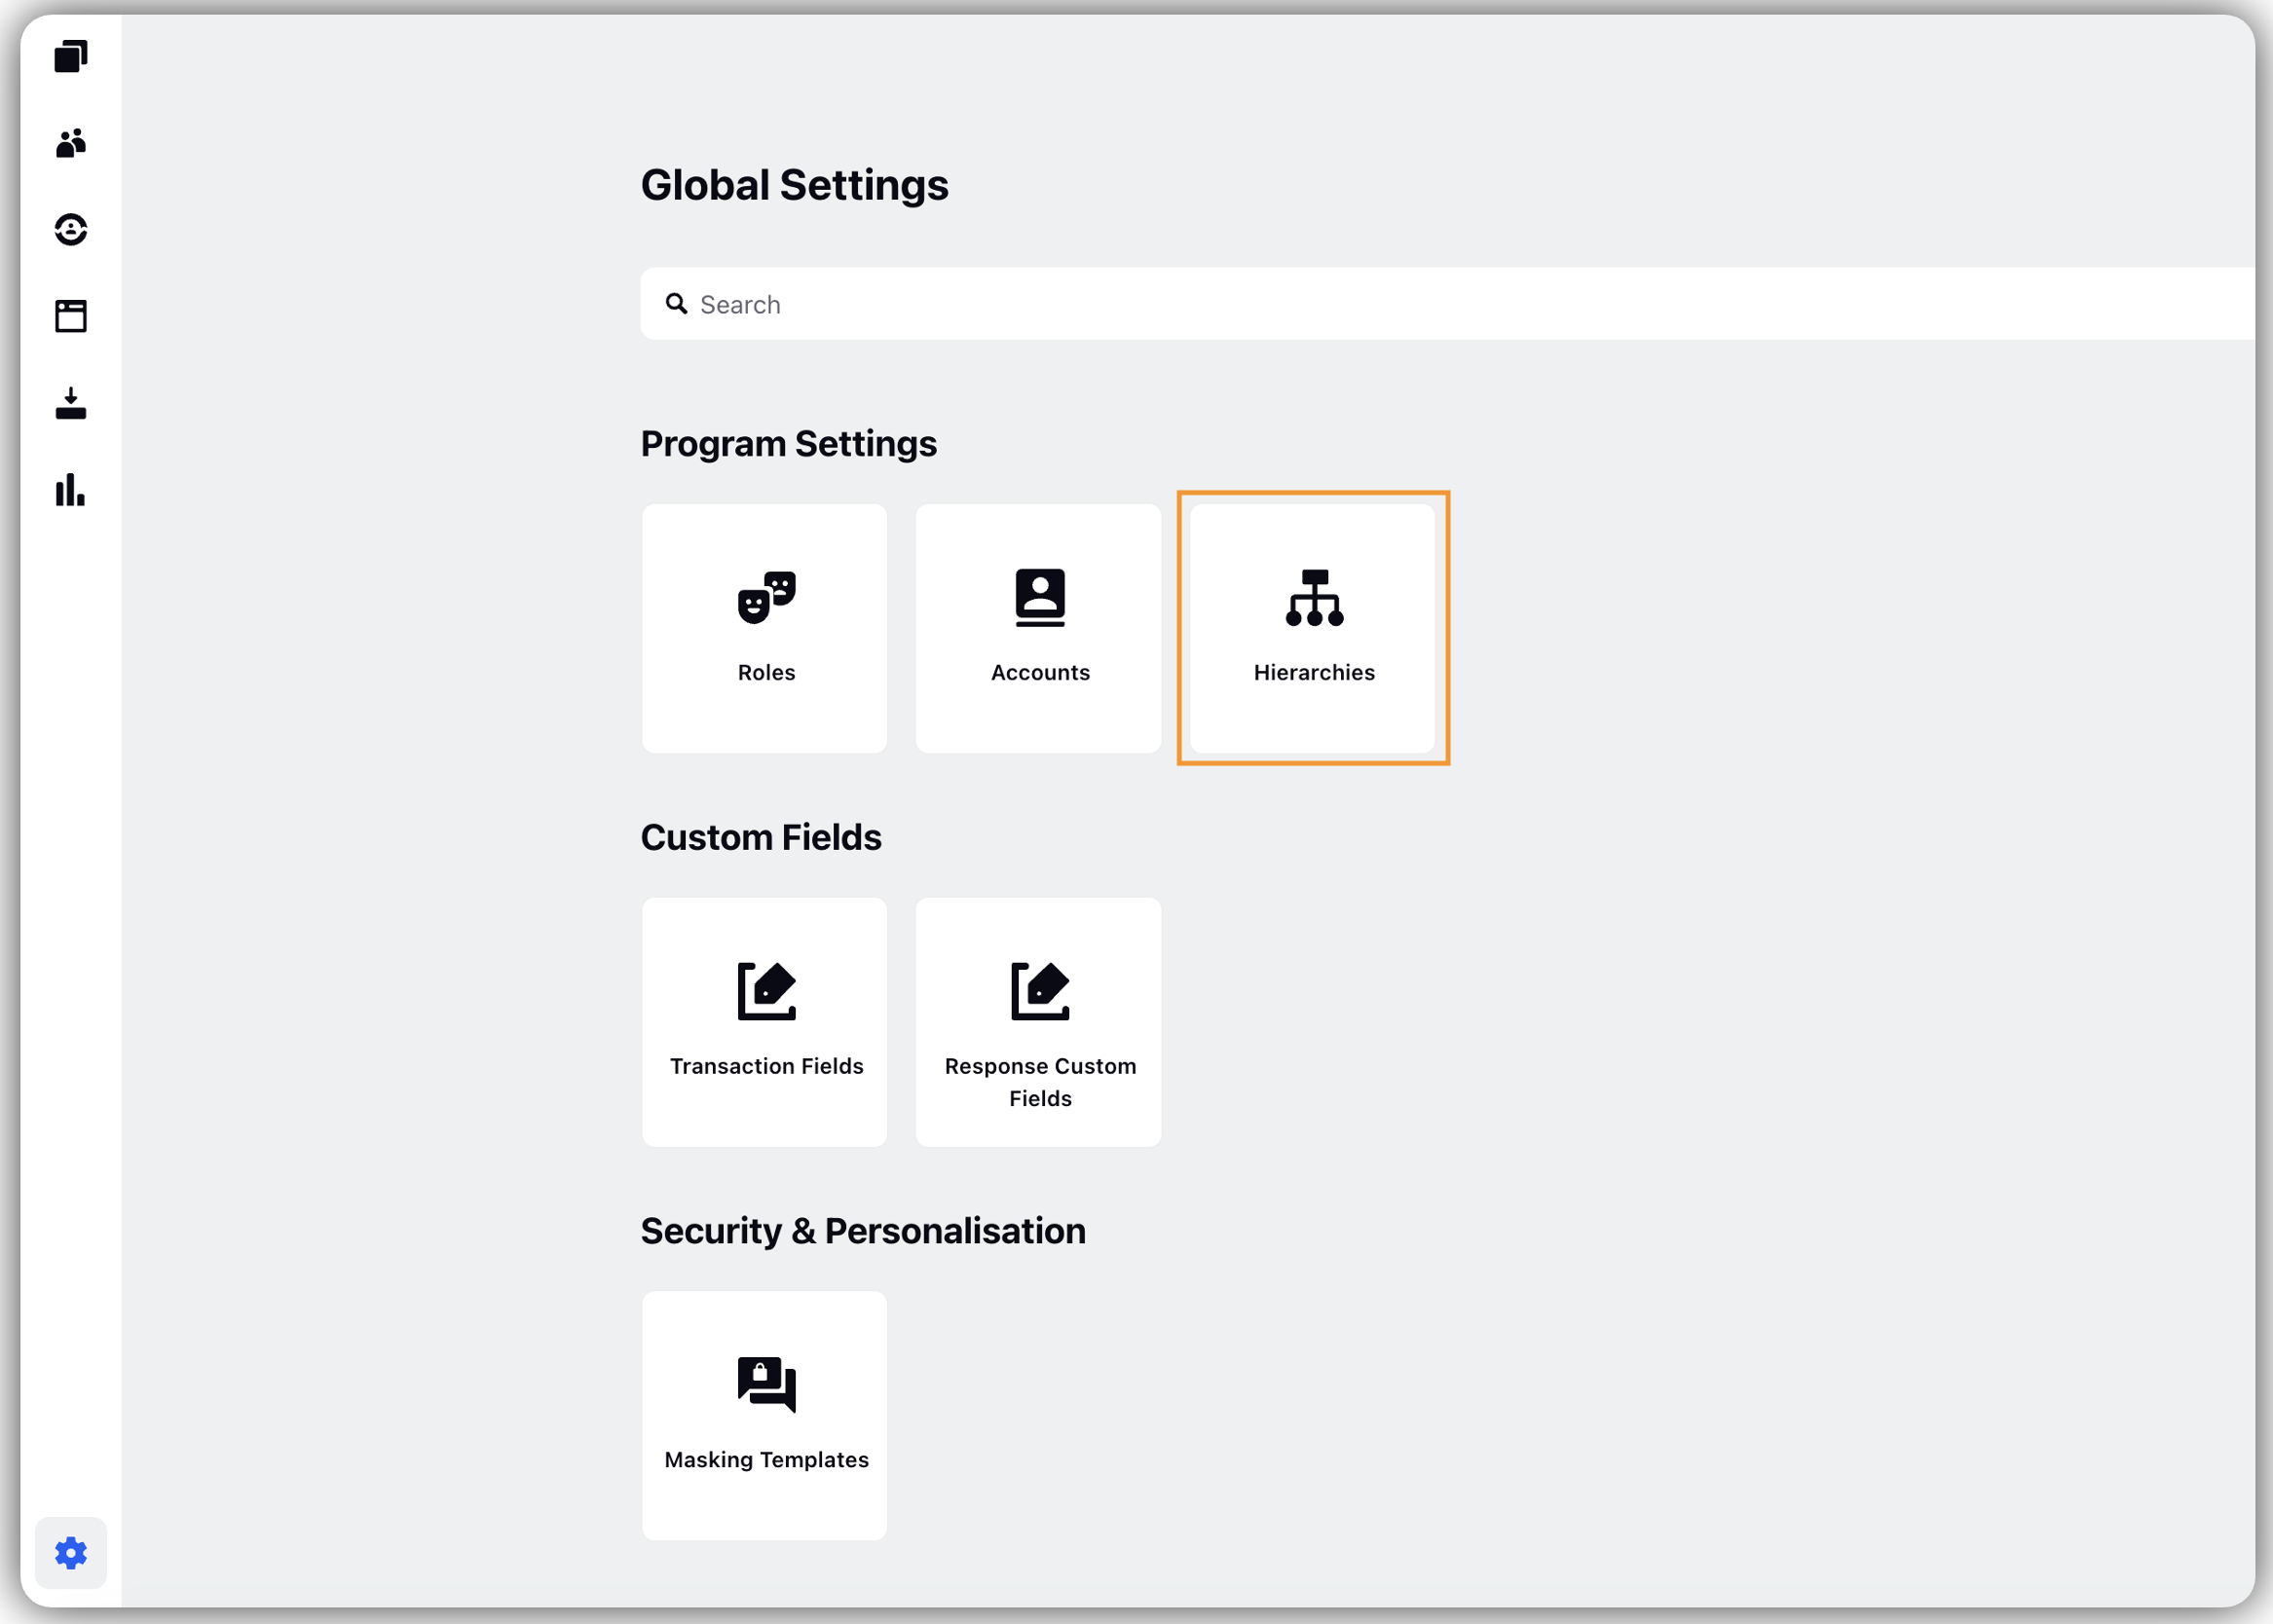
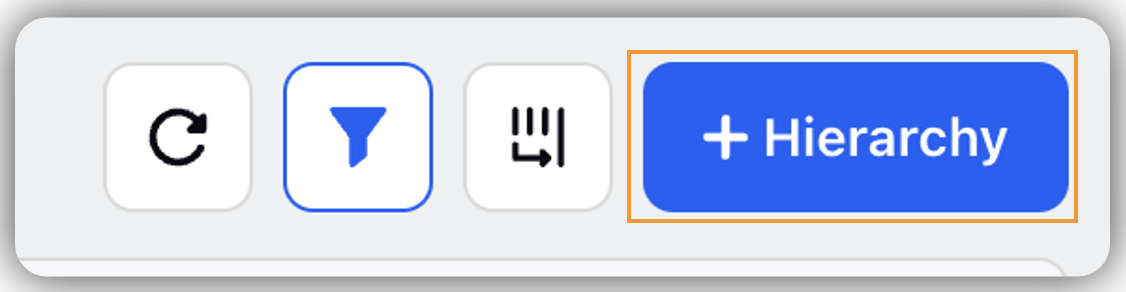
Click + Hierarchy.
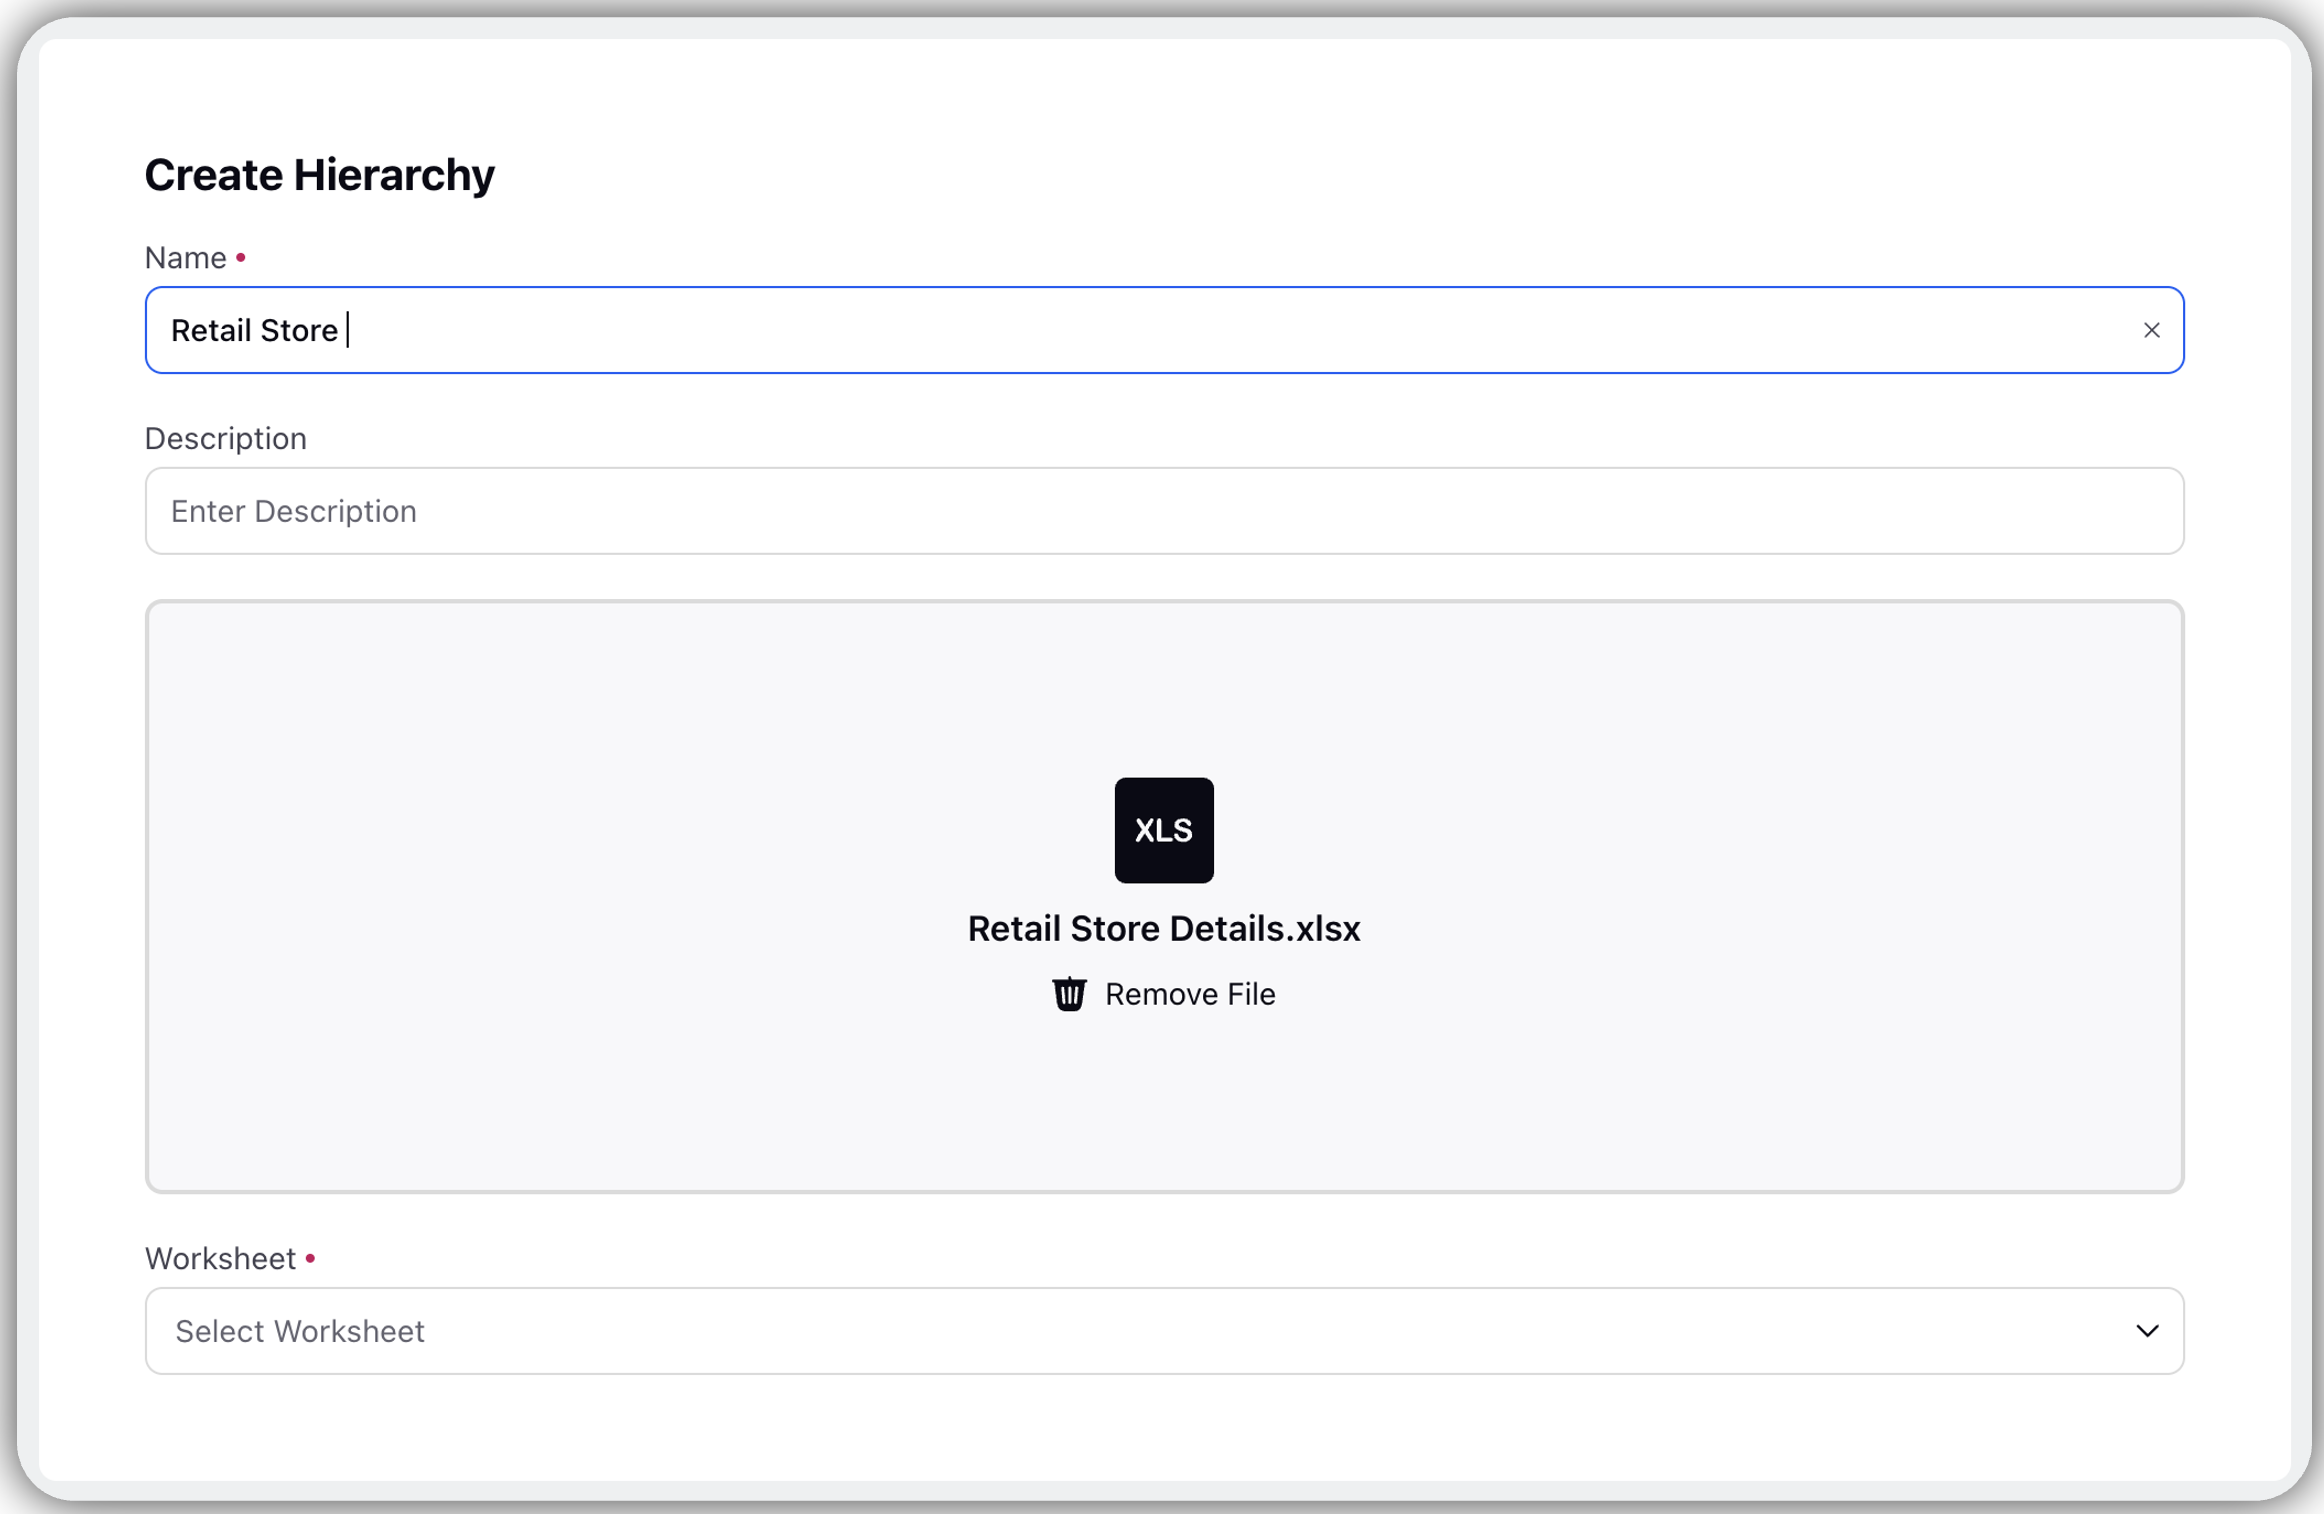
Fill the details on Create Hierarchy:
Name: The hierarchy name is automatically set to match the name of the organization file being uploaded, but you have the option to customize it as needed (Mandatory).
Description: Add a description from the hierarchy.
Upload File: Allows you to drag and drop files or upload them directly from your system.
Worksheet: If the uploaded Excel file contains multiple sheets, you can select the specific sheet that contains the hierarchical data.
Click Next to map the excel field with Sprinklr hierarchal fields.
Go to Mapping Section on the right pane.
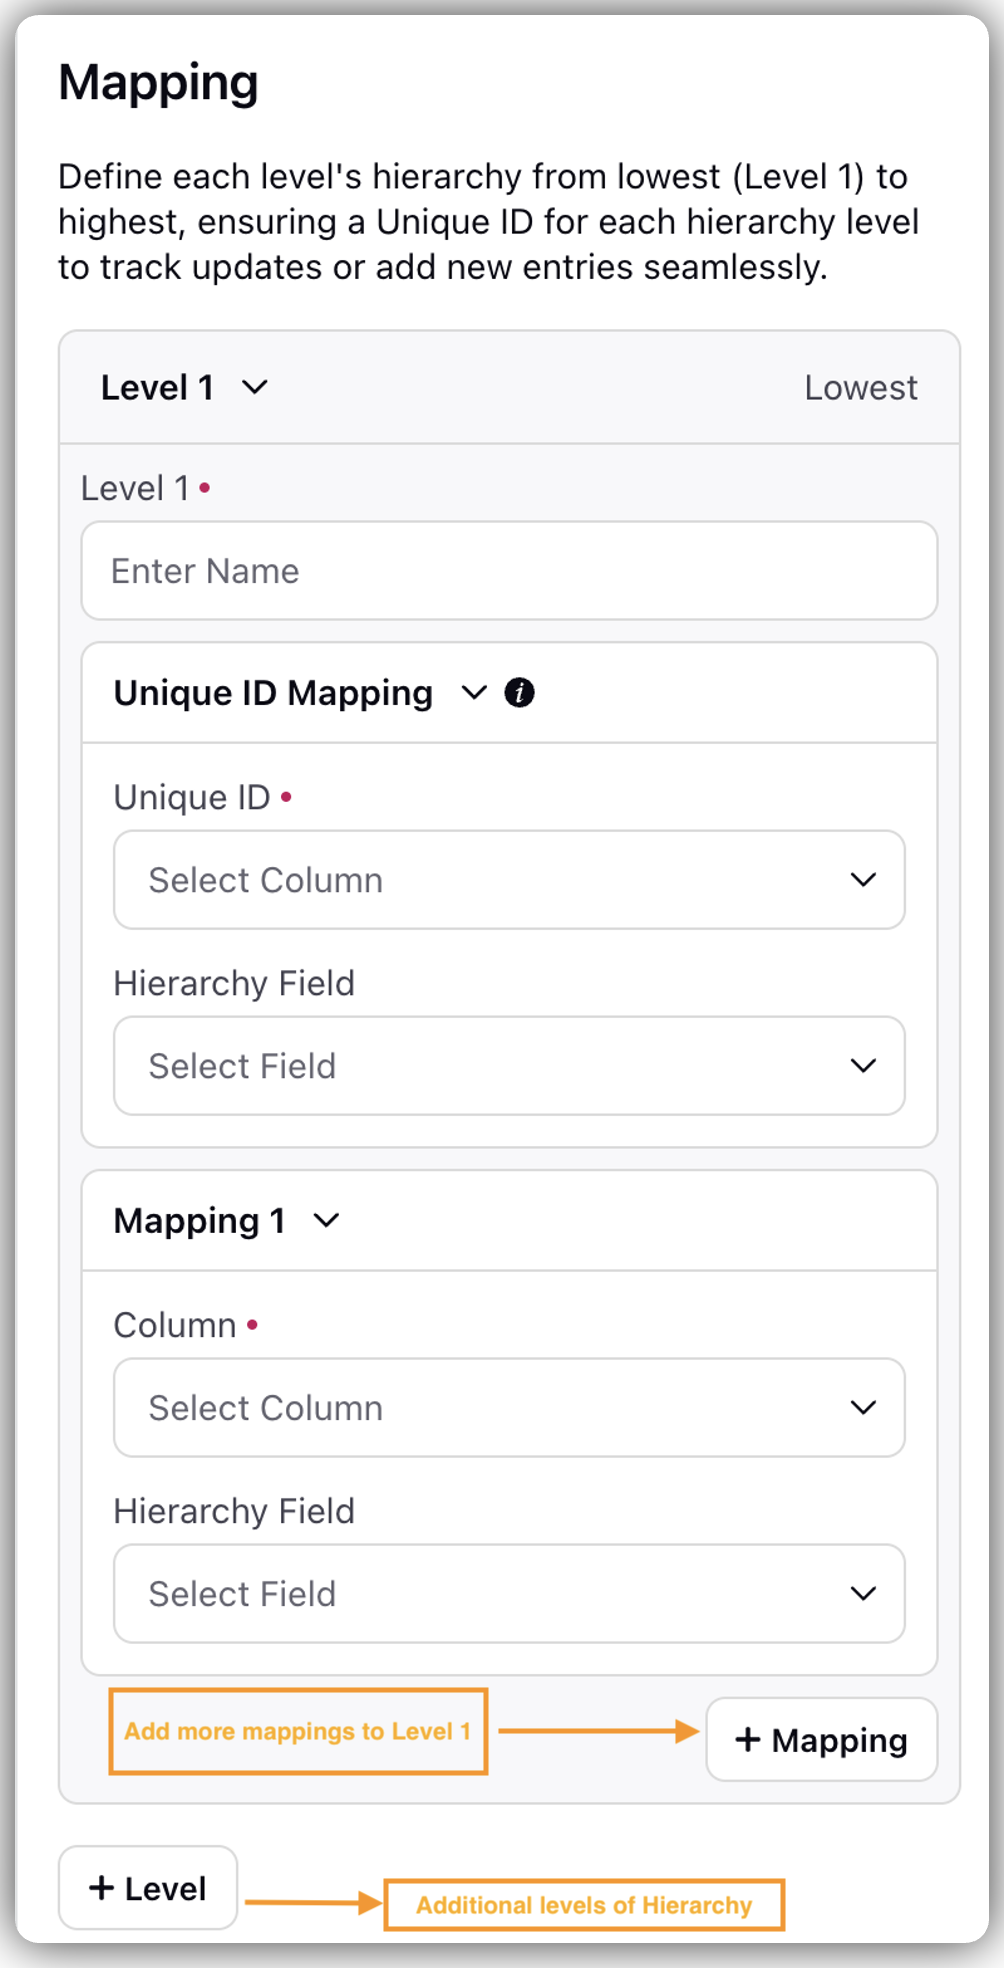
You can map multiple fields to a single level and create multiple levels to represent different organizational tiers.
Example: Level 1 could be Store, Level 2 Area, Level 3 Region and Level 4 Country.

Level 1: Level 1 would be the lowest level.
Enter Name: Enter the name of each level (Mandatory).
Go to Unique ID Mapping section.
The Unique ID in Level 1 is essential for establishing the hierarchy and ensuring accurate data mapping. Make sure to map it correctly to maintain proper hierarchy connections.
Unique ID: Select the unique ID from drop-down. The unique ID field is a non-repetitive column, connects the hierarchy to a survey and helps to identify which rows to update or add when a new file is uploaded.
Hierarchy Field: You can first select a column from the Excel file using a dropdown menu that displays all the column names. You can map the selected Excel column to a Sprinklr Hierarchy field.
+ Field: You can either select either an existing field or create a new field.

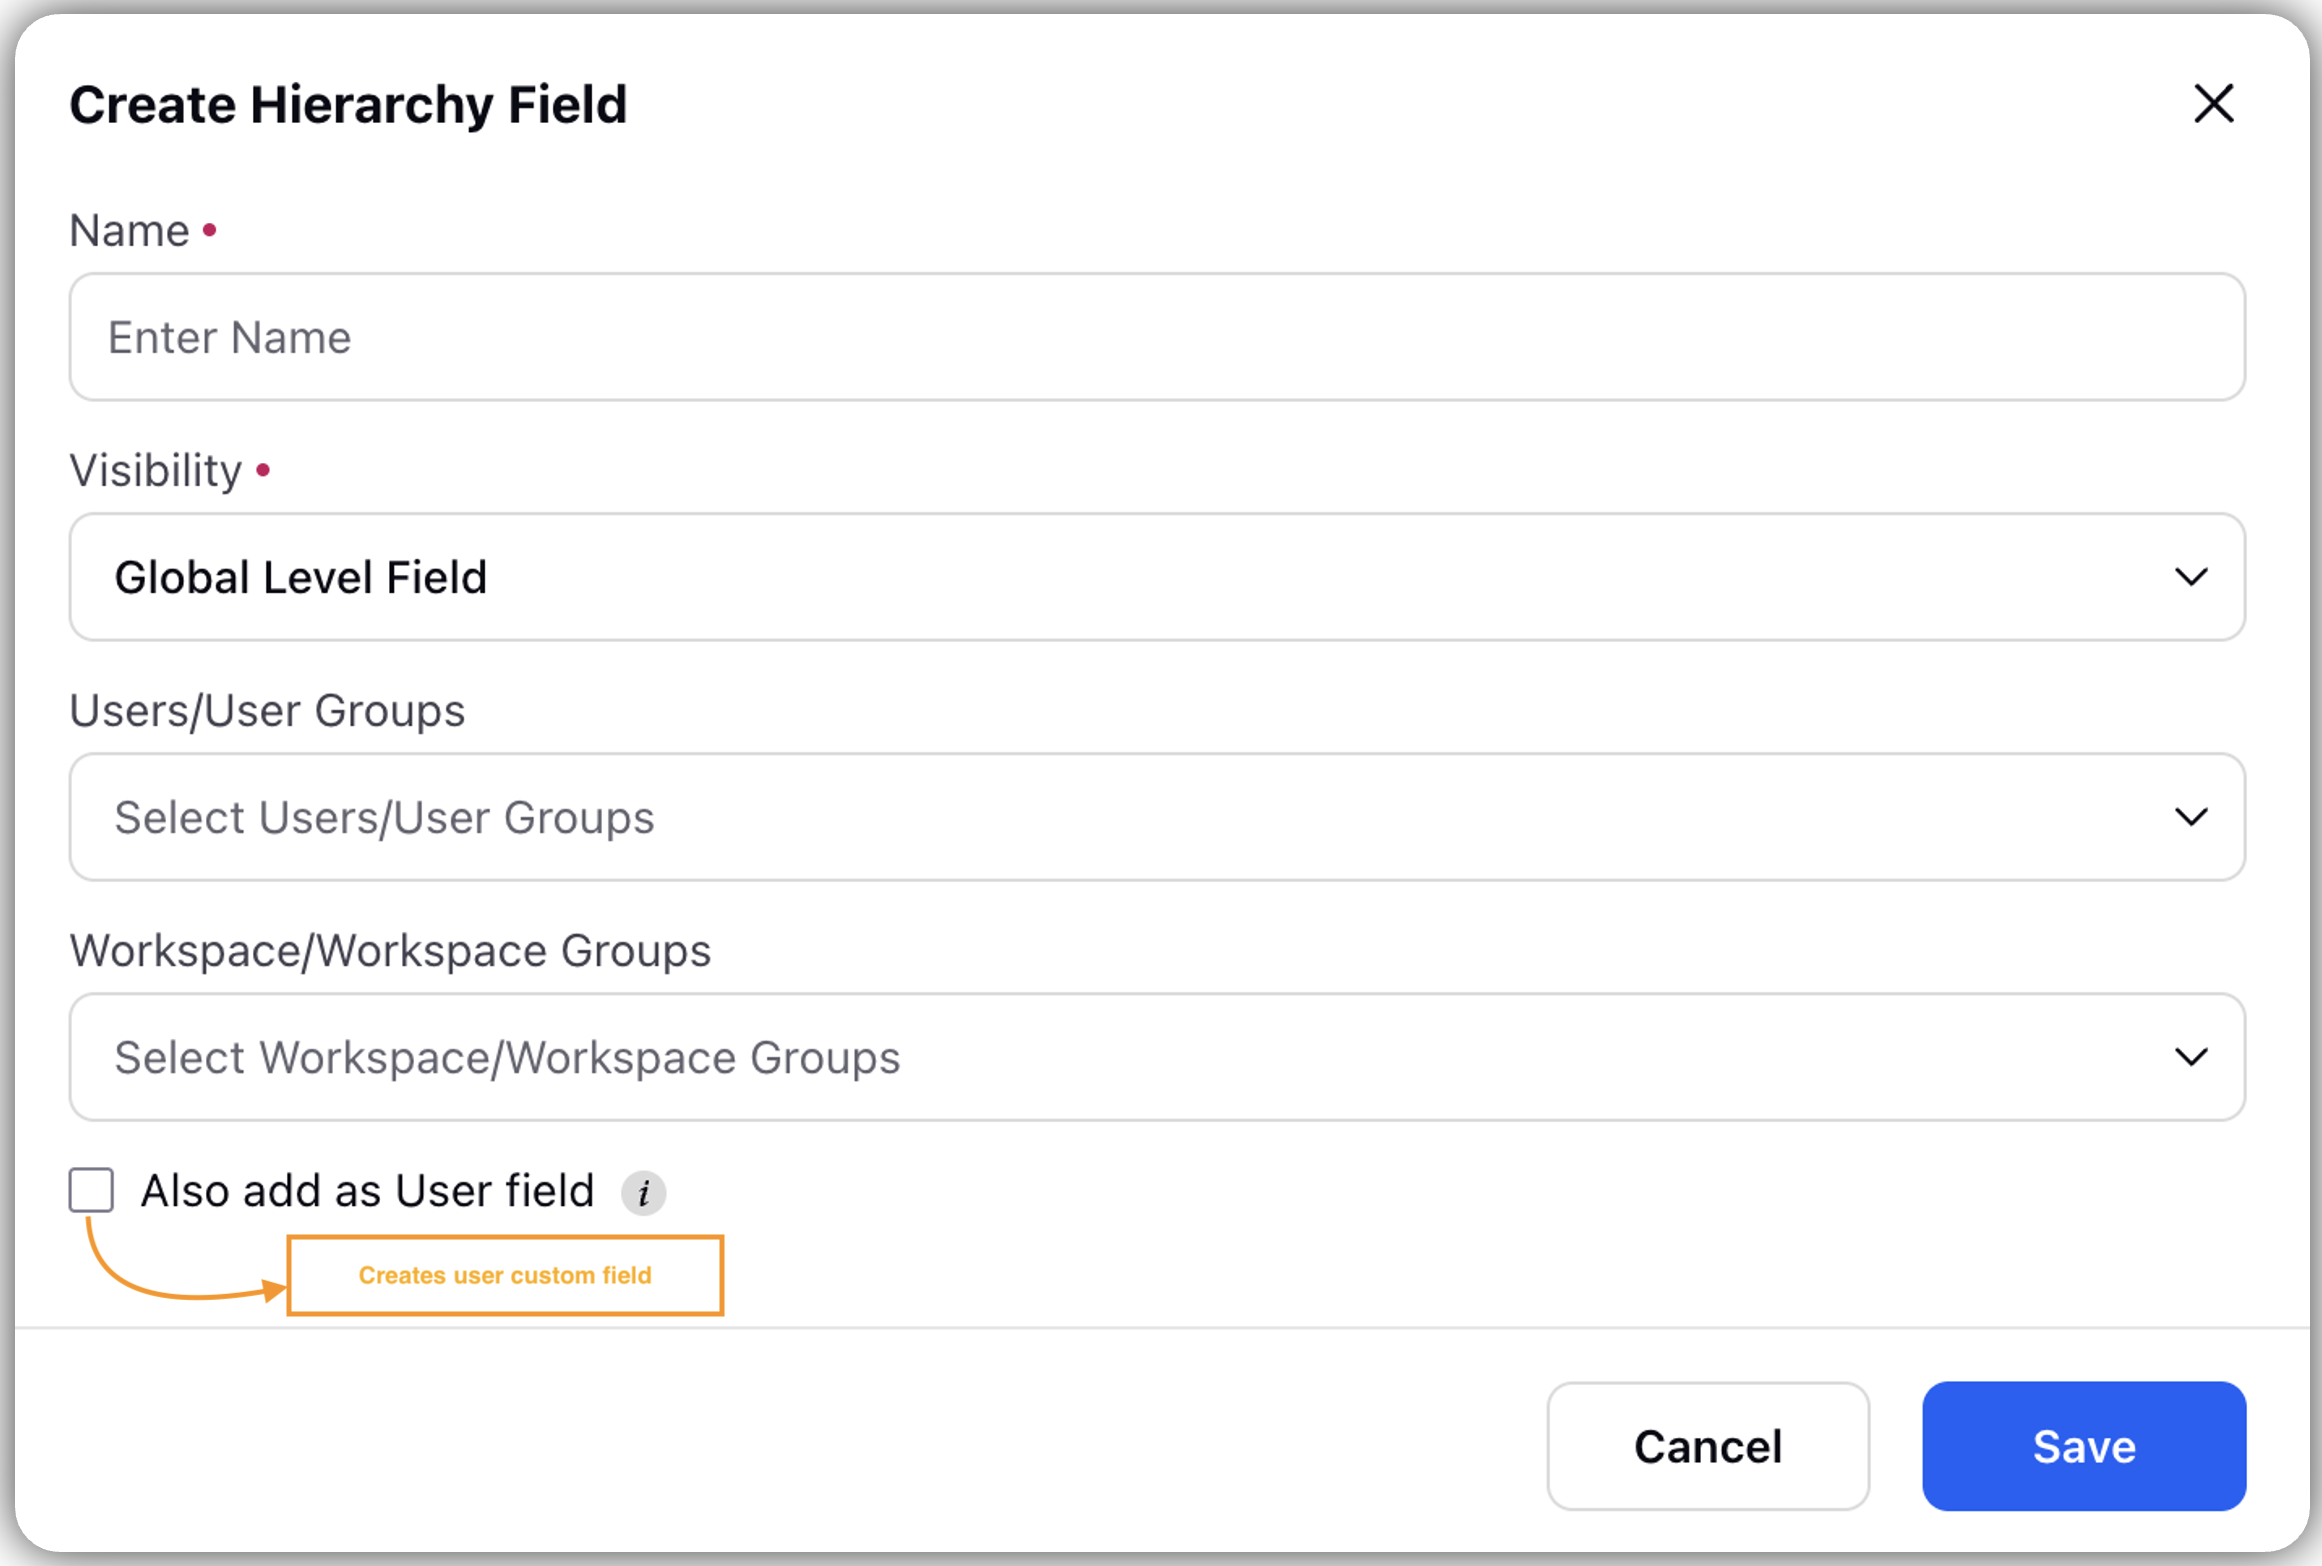
Name: Enter the name.
Visibility: You can control the visibility at Global or Workspace level field.
User/User Groups: Select User/User Groups to control the visibility.
Workspace/ Workspace Groups: Select Workspace or Workspace Groups to control the visibility.
Add as User Field: Check the box to create a User Custom Field that means a new field will be created with both the User Asset class and the default Hierarchy asset class.
Click Save.
Add to user level field: You can create User Fields for the hierarchical fields mapped and imported from the Excel data.
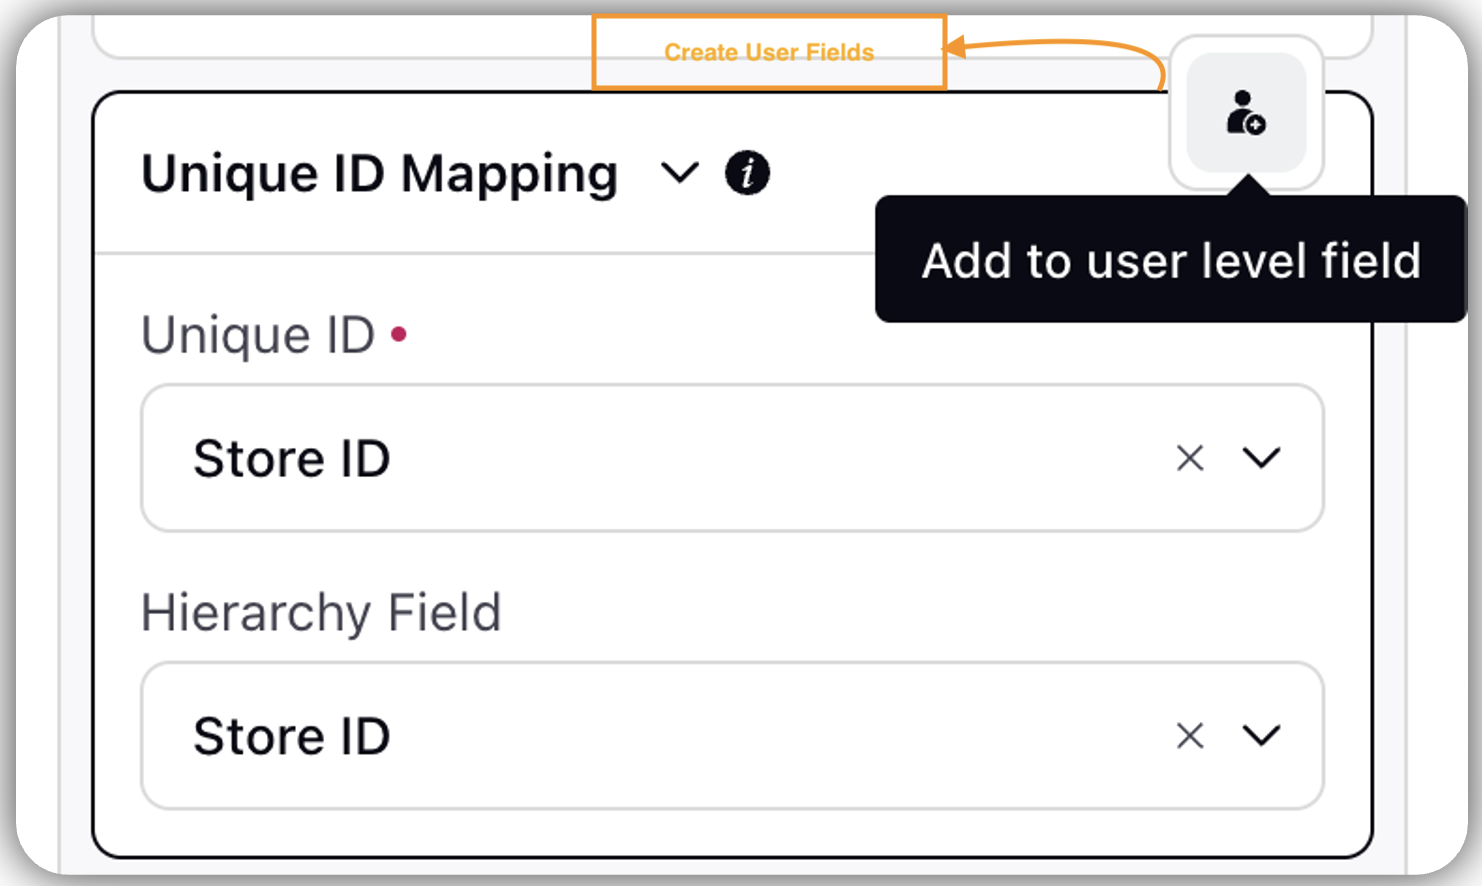
The greyed-out symbol indicates that a user field for the selected field will be created upon saving the hierarchy, or that it already exists alongside the hierarchy field.
Click + Mapping to define further mappings to Level 1.
Click + Level to define mapping for each level.
Click Save (on the top right corner of the right pane) to create a new record in the Hierarchies Record Manager.
![]() Note: Ensure the data contains a unique column to identify each record or entity within the organizational hierarchy.
Note: Ensure the data contains a unique column to identify each record or entity within the organizational hierarchy.
![]() Note: At present, only designation-based hierarchy is supported. Data can only be ingested via Excel upload.
Note: At present, only designation-based hierarchy is supported. Data can only be ingested via Excel upload.
Manage Hierarchies
Manage at Hierarchy level
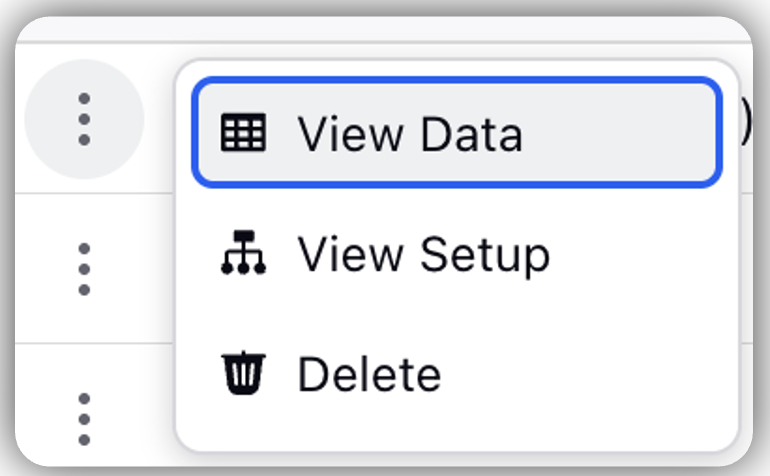
Click Vertical Ellipses(three dots) against each hierarchy.
View Data: This screen displays the current state of the hierarchy data stored in Sprinklr.
View Setup: Allows you to view hierarchical setup. You can view only 10 rows in the preview.
Delete: Helps to delete the hierarchy.
Manage at Record Manager Level
Filter Option: You can access filters by clicking + icon. This allows you to apply filters based on the columns in the data table, helping you review and assess the quality of the import or spot any errors.
Search Bar: You can use the search bar to find specific records.
Record Manager
The record manager has following columns:
Hierarchy Name: The name of the hierarchy.
Owner: The person who created the hierarchy.
Description: An optional description for the hierarchy.
Last Modified: The date and time when the hierarchy was last modified.
Created On: The date when the hierarchy was created.
Linking Hierarchy Data to Survey Projects
After you have successfully set up the hierarchy, it is time to link the hierarchy data with Survey Projects and visualize it in a dashboard.
Steps to Link Hierarchy
Go to + New Page > Launchpad > Sprinklr Insights > Customer Feedback Management.
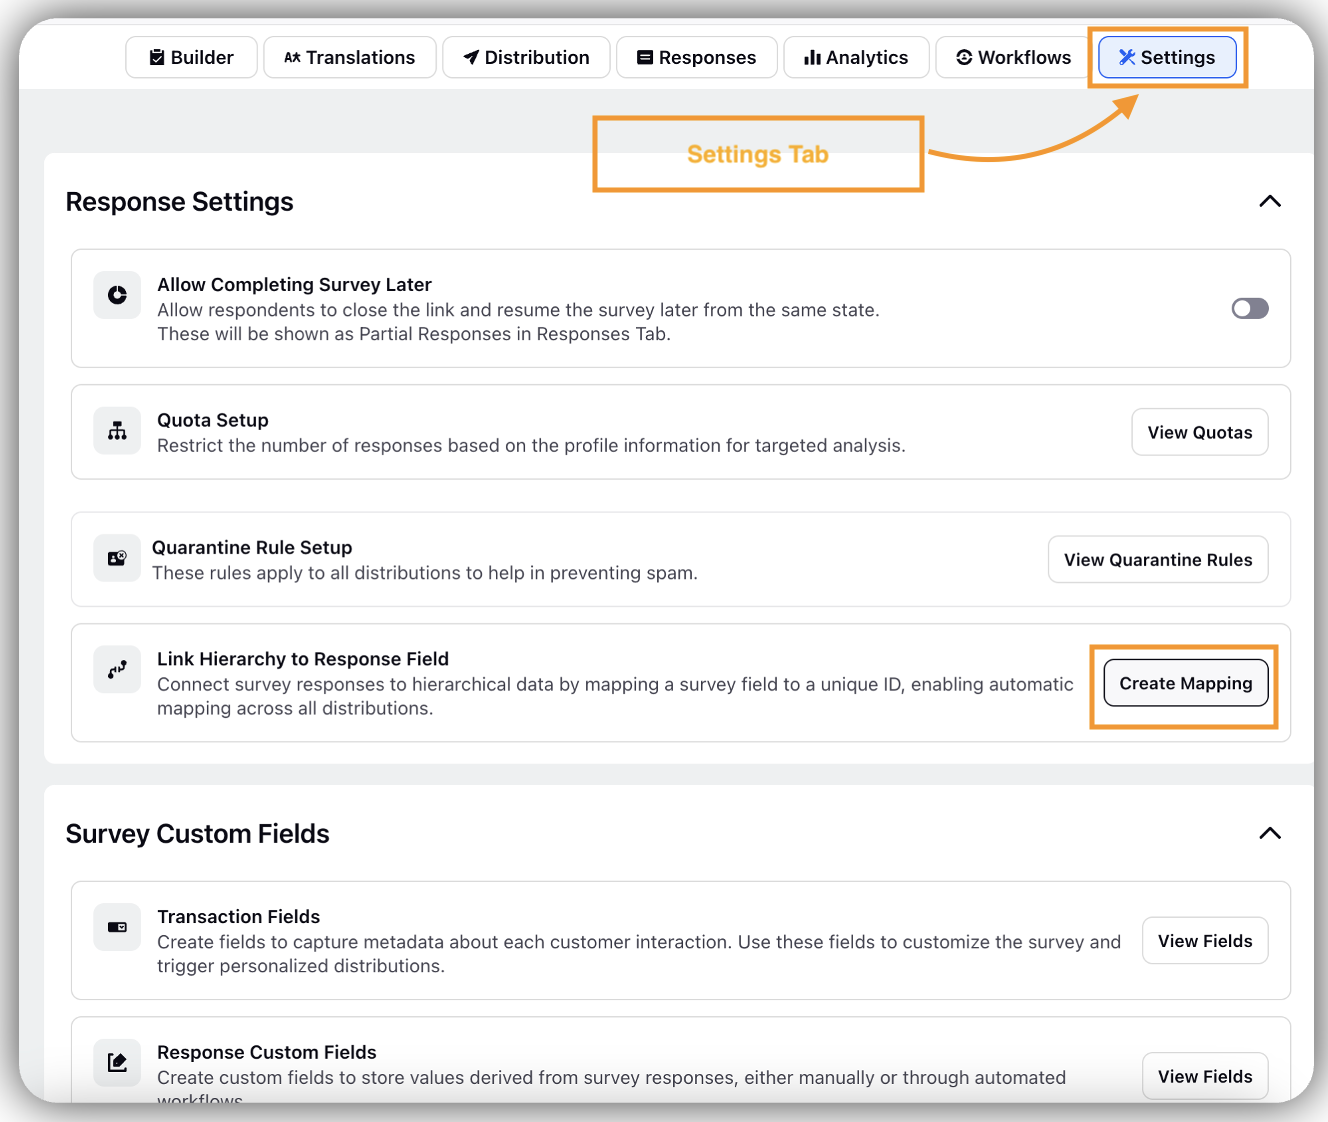
Go to Settings Tab of CFM.
Go to Link Hierarchy to Response Field and click Create Mapping.
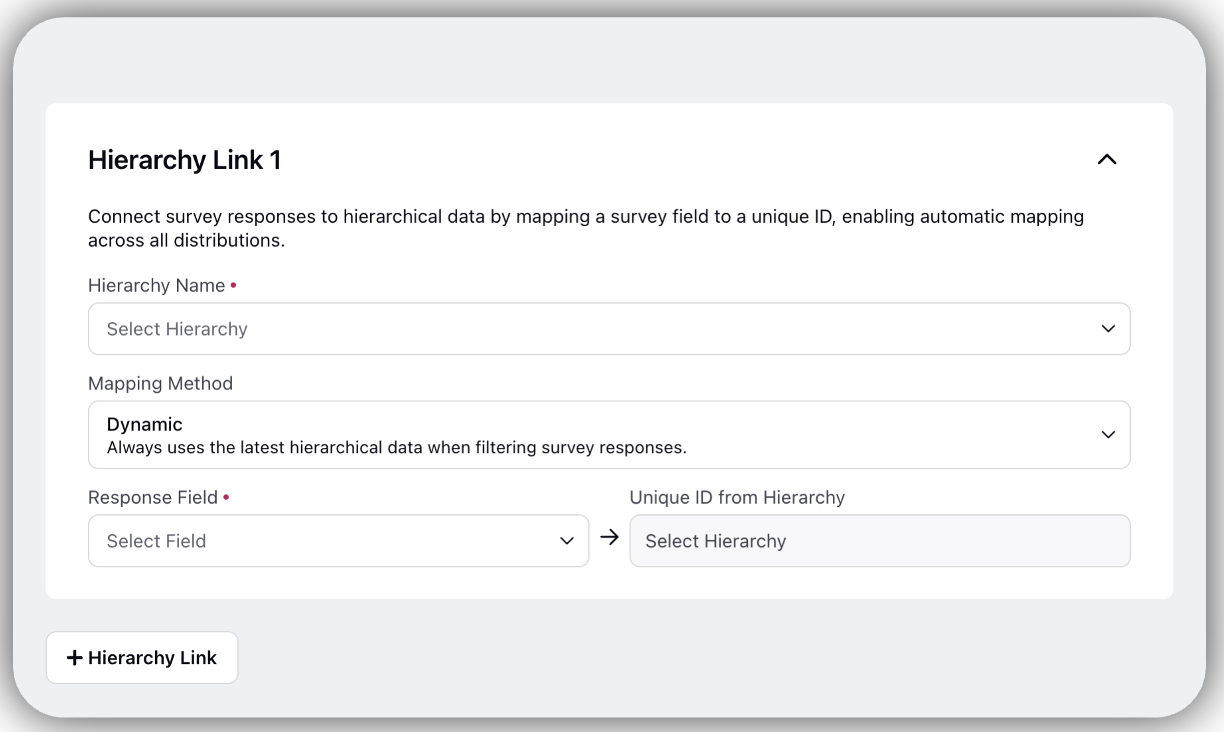
In the Hierarchy Link 1 page, fill details:
Connect survey responses to hierarchical data by mapping a survey field to a unique ID, ensuring automatic mapping across all distributions.
Hierarchy Name: Select the name of the Hierarchy they wish to connect (Mandatory).
Mapping Method: Mapping by default will be picked as Dynamic.
Response Field: This would be present in all the responses coming from the survey (Mandatory).
This Response field can belong to either the Survey or Profile asset class. For more details on how to create a response field, refer to the article available here.
Unique ID for Hierarchy: It will be automatically picked.
Click + Hierarchy Link to add multiple hierarchies.
Click Save.
Once this setup is done, every response that comes in from the link will be checked.
Example: if a response originates from Store 1, the response field will contain a value that identifies it as such. This value will be compared with the Unique ID in the hierarchy. If a match is found, all relevant hierarchical data for Store 1 will be automatically associated with that response.
This mapping connects the survey and hierarchy by linking the survey response field to the Unique Hierarchy field.
Visualization in Dashboard
Once the survey and hierarchy link is set up, all responses will be automatically tagged with the corresponding hierarchical data.
Go to Analytics Section.
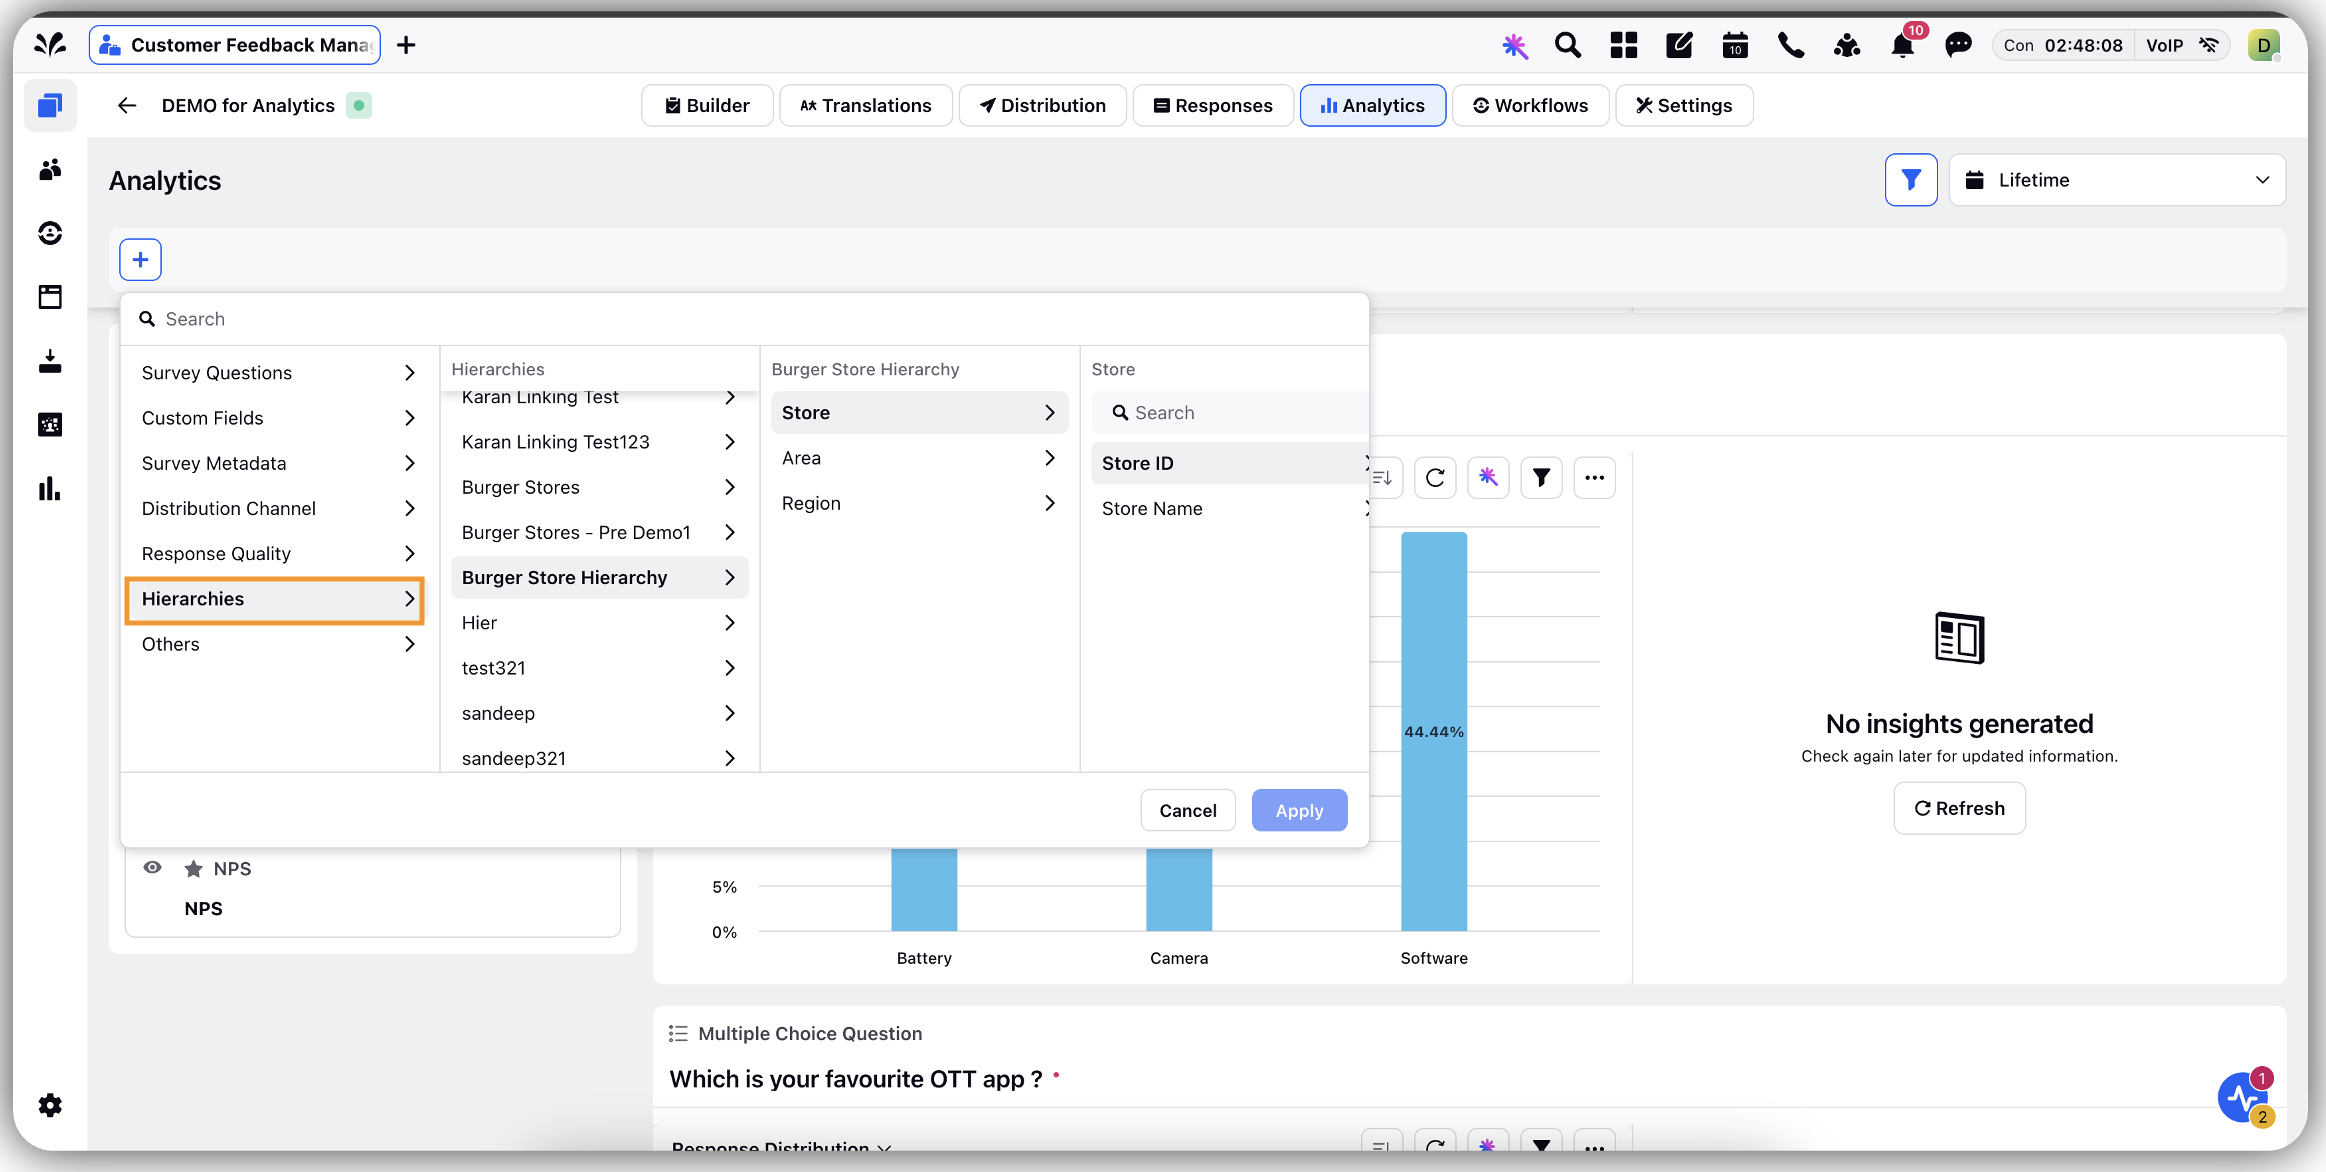
Click Add Filter(+) to filter the data based on hierarchical values to gain granular insights at each level. This can be achieved through both the Analytics feed and custom reporting.
Click Hierarchies to select the hierarchy name and explore all its levels to choose a field from any specific level to apply filters based on its value.
Even if the survey originally only contains the Store ID, the connection with the hierarchy allows data to be filtered by any field within the hierarchy. Moreover, when a filter is applied to a higher-level field, the list of available lower-level fields is automatically filtered to show only values that are compatible with the selected higher-level field.
Example: If you select the North Region, you will only see the list of Stores and Areas within the North Region.
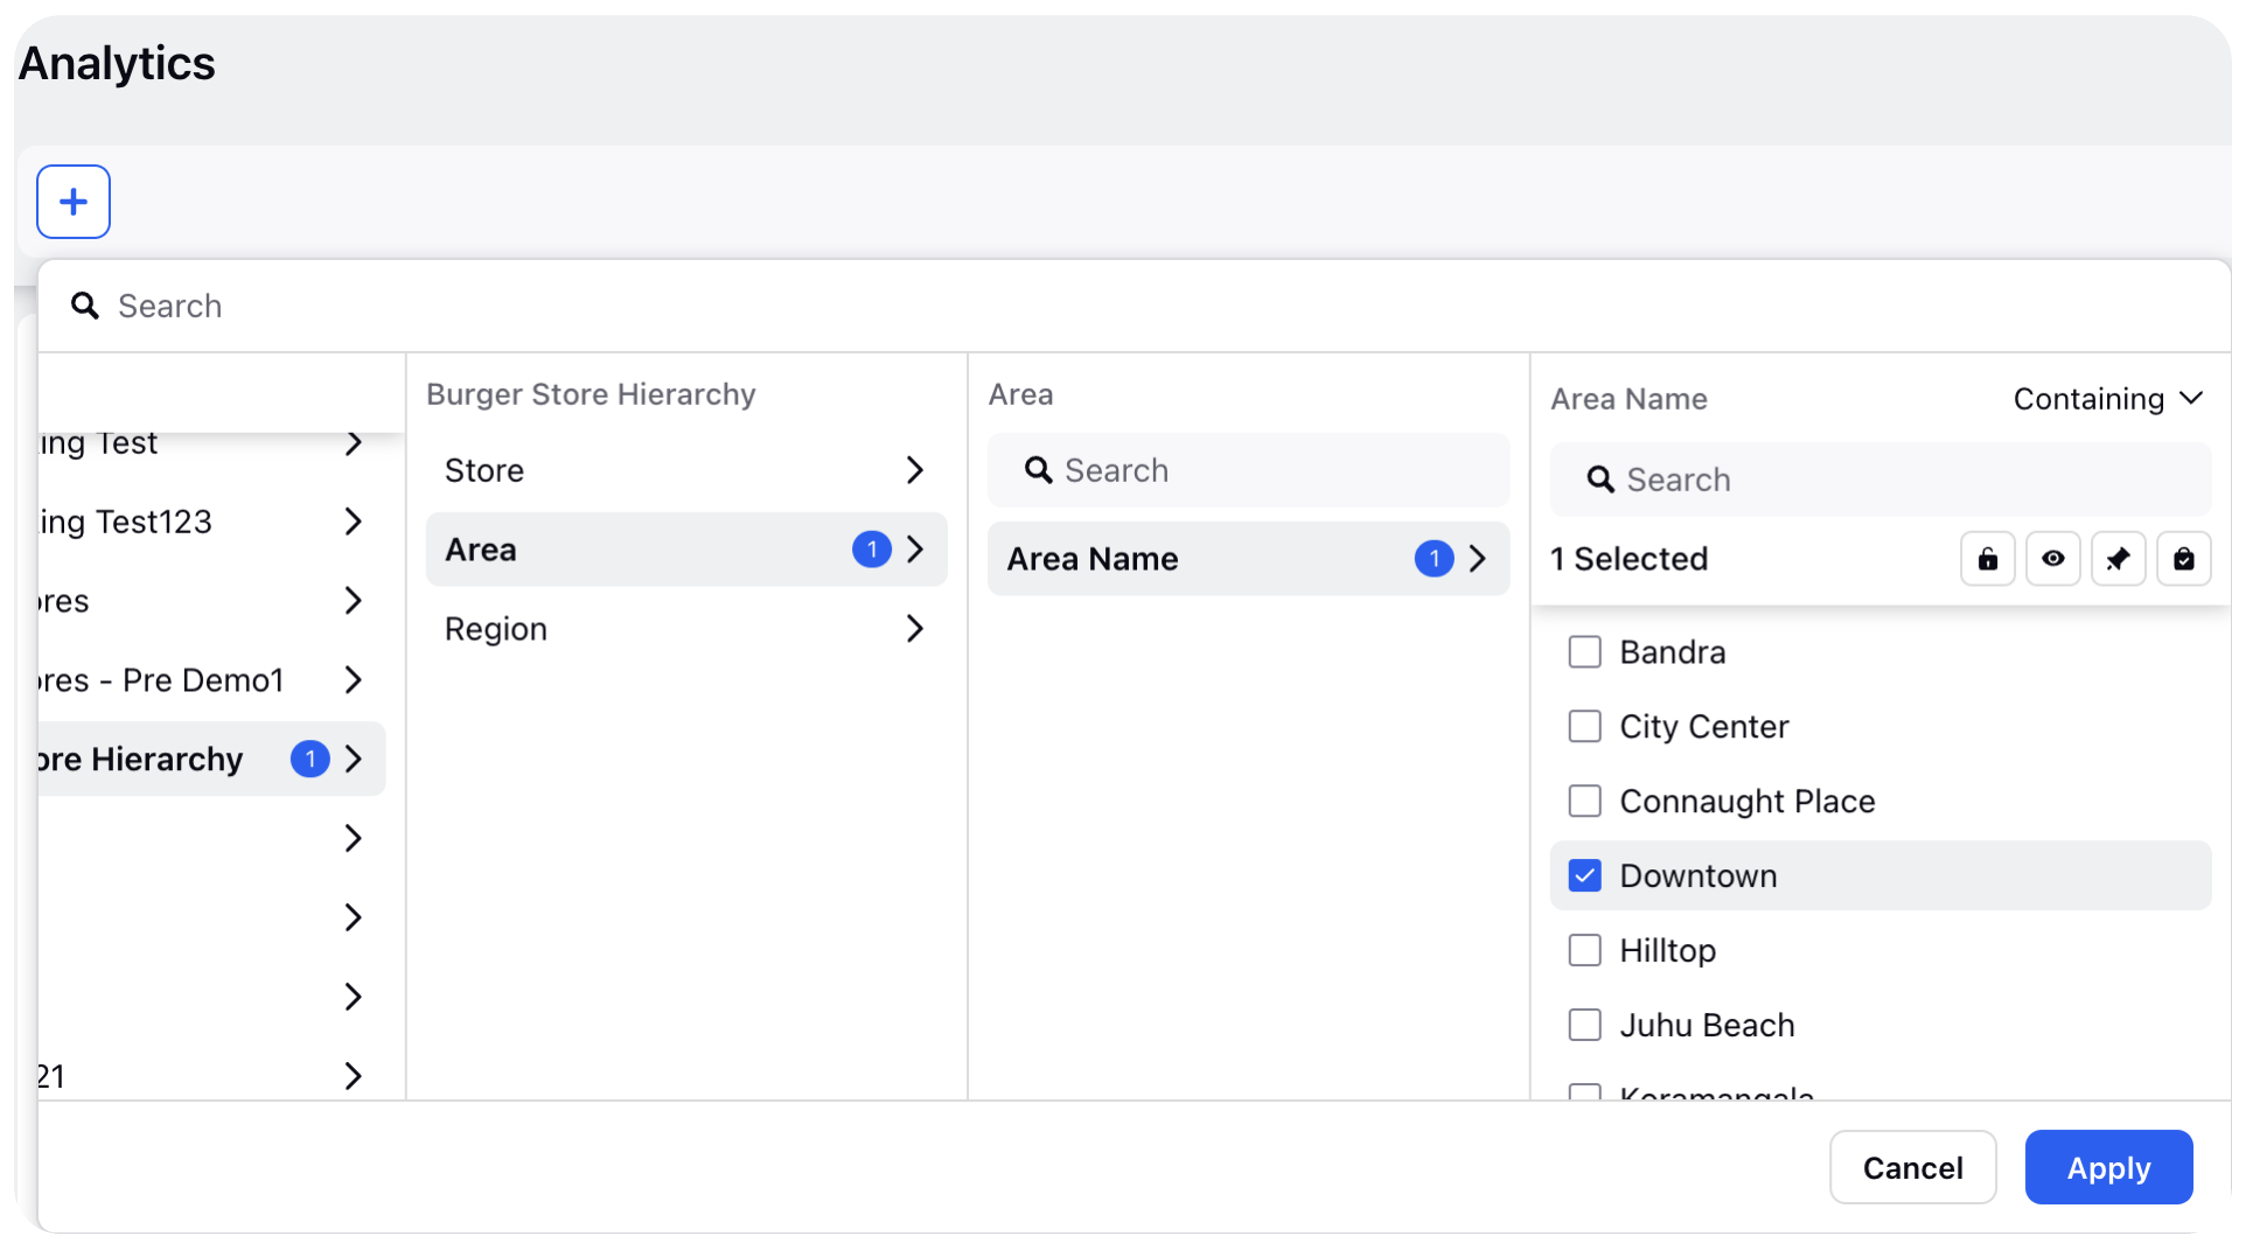
Click Apply.
![]() Note:User-based property filtering is also available, allowing dynamic filter values based on the Sprinklr user who is logged in and viewing the dashboard. To use this feature, the user must have a User custom field linked to their profile with the appropriate value.
Note:User-based property filtering is also available, allowing dynamic filter values based on the Sprinklr user who is logged in and viewing the dashboard. To use this feature, the user must have a User custom field linked to their profile with the appropriate value.
![]() Note: Currently, the linking is dynamic, which means the analytics results will automatically update based on any changes or updates made to the hierarchical data.
Note: Currently, the linking is dynamic, which means the analytics results will automatically update based on any changes or updates made to the hierarchical data.
Best Practices for Setting up Hierarchical Reporting
Define Organizational Hierarchy
Map Out Levels: Start by defining the hierarchy levels (e.g., Organization > Region > Store > Team) to ensure they align with your organizational structure.
Consistent Naming Conventions: Apply uniform naming conventions for hierarchy levels and units to prevent confusion during setup and analysis.
Use Accurate and Up-to-Date Data
Initial Data Upload: Ensure the data used to set up the hierarchy is accurate and validated. Use reliable Excel or CSV files for a smooth upload process.
Regular Updates: Update the hierarchy periodically to reflect organizational changes (Example: New departments or reporting structure modifications). Leverage the dynamic update feature to upload only modified rows.
Quality Checks: Conduct regular audits to ensure the hierarchy and associated data remain accurate and aligned with organizational changes.
Align Reporting Metrics with Business Goals
Custom Metrics: Define metrics that align with the key performance indicators (KPIs) for each level of the hierarchy.
For example: Regional Managers: Track store-level sales and customer satisfaction scores.
CXOs: Focus on consolidated performance trends and strategic KPIs.
Benchmarking: Utilize hierarchical reporting to compare similar units (Example: Stores within the same region) to benchmark performance and identify areas for improvement.
Drive Insights with Visualization and Filters
Interactive Dashboards: Leverage visual tools like charts and graphs to make data more accessible and easier to interpret at each hierarchical level.
Filtering: Provide filtering options so you can drill down into specific segments (Example: By region, store, or department) for more detailed insights.
Creation of Hierarchy Fields:
Naming Hierarchy Fields: Name hierarchy fields in a way that makes them easily identifiable to both the user setting up the hierarchy and analysts building dashboards. Clear and descriptive names help ensure that the data represented by each field is instantly recognizable.
Create User Fields: User fields should be created only for those fields that analysts will use for dynamic reporting. These fields enable meaningful, filterable reports that can be shared across all stakeholders.
Populate User Field Values: Ensure that user field values are populated consistently with the exact values present in the hierarchy. This alignment ensures accurate and reliable filtering in reports and dashboards.