Hierarchical View

Updated 

Hierarchical Reporting View gives you access to data based on your role and position in the organization. This means you can view your own performance data, as well as the data of your direct and, where applicable, indirect reportees.

If you are a manager, you’ll see metrics for yourself and for everyone who reports to you, either directly or through the hierarchy. The system uses the defined reporting structure to determine access, ensuring that data is visible only to the appropriate individuals. That means you can find your own data and that of your reportees.

This structure enables managers to monitor both their own performance and that of their team while upholding governance.

Prerequisites

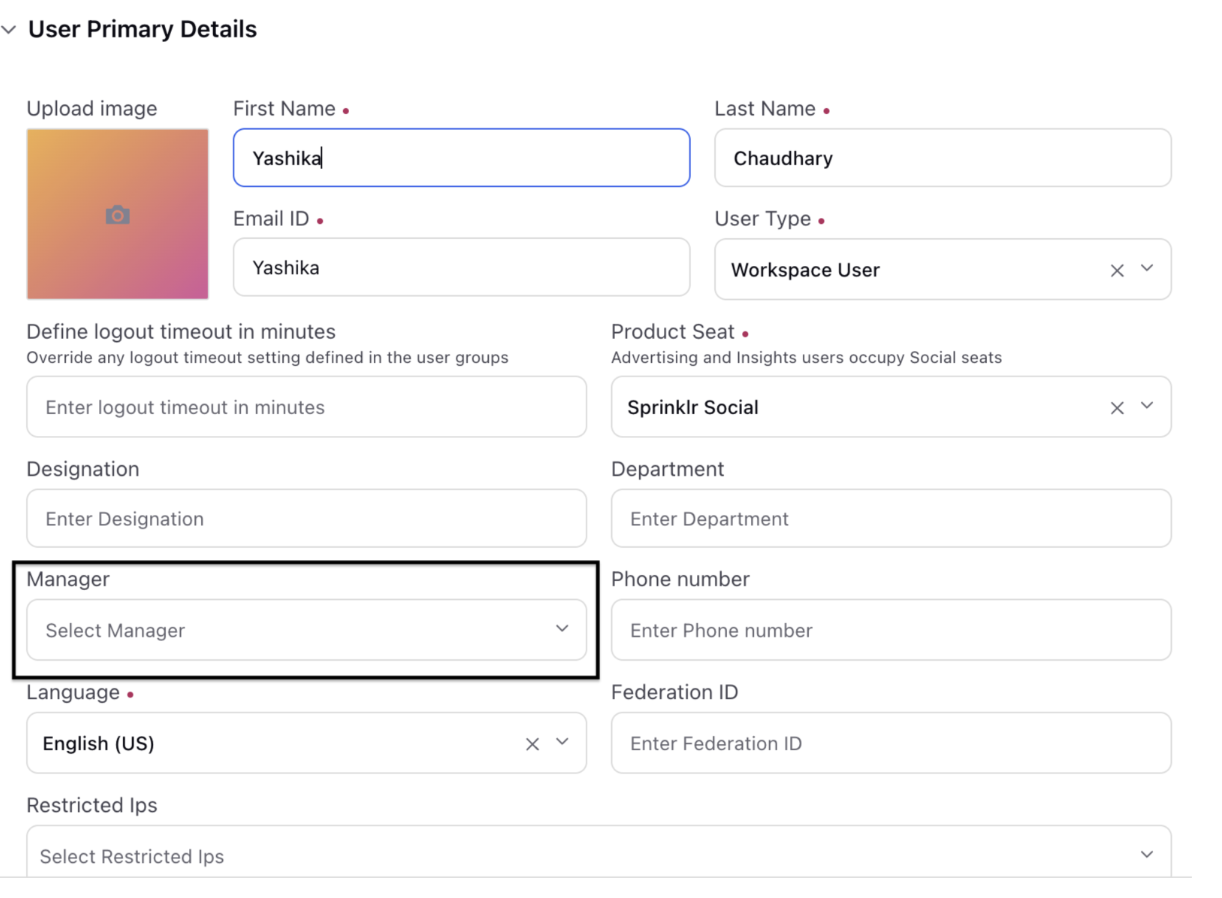
At the user level, you can edit user details on their profile page, including the Manager field, which is a system-defined property that links each user to their manager.

This field is essential for the reflection of data in hierarchical reporting. To ensure accurate reporting structures, you should always populate the Manager field when uploading users and treat it as a required field..

You need to have Dynamic Properties (DP) enabled in order to access the Hierarchical View in Reporting.
Setting Up Hierarchical View

  1. Go to Sprinklr Service and navigate to Reporting (under Analyze).

  2. Create a Dashboard and select the data source as Social Analytics and select the visualization as Pivot Table.

  3. Choose the metric from the report you want to plot data for.

    Note: The Hierarchy dimensions are supported in these reports: Agent Time card report group, Agent Performance Report Group, Voice Additional Report , Survey Summary Report ,Survey Response Details (Single Dimension) and User Platform Activity Report.

  4. Select the dimension by plotting levels for the hierarchy view.

    1. Level Dimension(Current Reporting): Level 0,1,....9. Level 0 is the user lowest in the hierarchy and Level 9 is highest in hierarchy.

    2. Manager Level Dimension(Snapshot View or Snapshot Reporting): Manager Level 0, 1 ......9. Manager Level 0 is highest level in hierarchy and Manager level 9 is lowest in hierarchy.

Ways to Plot

There are 2 ways to plot hierarchical view. Let's have a look at it: 

  • Using Level Dimensions 

  • Using Manager Level Dimensions 

Let’s have a look at both in detail.:

Let’s understand the concept of these dimensions:

  • These dimensions are organized from Level 0 to Level 9, where Level 0 represents the lowest position in the hierarchy and Level 9 represents the highest.

  • Data Representation: When trying to visualize the data, it will represent the data of the reportees and the total against the respective manager.

    Note: Data for the actions taken by the manager will not be present but the value against manager will be aggregate of their metric value and their direct reportees against the level dimension.

  • Calculation: It is calculated as above:

    Level x = Metric value of the user at level x + Metric values of their immediate reportees (i.e. metric value of users at Level (x-1)).

    Let’s understand this with the help of an example:

    Suppose Level 3 has two reportees, A and B. A has used 3 macros, B has used 2, and Level 3 has used 2 macros. The total attributed to Level 3 would be calculated as 2 + (3 + 2) = 7. This value of 7 will be recorded against Level 3. Macros used by individuals further down the hierarchy, such as a reportee Z under A, are not included in this calculation.

  • Manager Change: In the event of a managerial change, all associated data will be attributed to the current (most recent) manager.

Let’s understand the concept of these dimensions:

  • These dimensions are organized from Manager Level 0,1,....., Level 9, where Level 0 represents the highest position in the hierarchy and Level 9 represents the lowest.

  • Data Representation: When visualizing the data, the manager’s individual contributions are shown separately at one level below, alongside the aggregated data of their direct and indirect reportees. A dedicated row appears one level down the manager's overall total, clearly highlighting their own metric value.

  • Calculation: Level 0 = Metric value of the manager + Metric values of the direct and indirect reportees.

  • In case of Manager Change: If the manager is changed, the view automatically splits the user's contributions across the respective managers, based on the relevant time frames (Snapshot Value). Let’s understand this with the help of an example:

    Date Range 

    User  

    Old Manager 

    New Manager 

    1st-20th Mar 

    M2 


    M1 


    M2 


    M1 


    20th Mar-31st Mar 


    M1 


    M1 


    M2 


    M2 


    M2 

    1st Mar-31st March 

    M2(1st to 20th Mar) 

    M1(20th –31st Mar) 


    M1(1st –20th Mar) 

    M1(20th-30th Mar) 


    M2(1st –20th Mar) 

    M2(20th-31st Mar) 


    M1(1st-20th Mar) 

    M2(20th-31st Mar) 

    Scenario 1

    If the selected date range is between 1st-20th March.

    • M1 would be able to see the data for both B and D as both were reporting into M1 during 1st to 20th March.

    • M2 would be able to see the data for A and C as both were reporting into M2 during 1st-20th March.

Scenario 2

If the selected date range is between 20th to 31st March.

  • M1 would be able to see the data of A and B during that time range. Here, A’s manager has changed from M2 to M1.

  • M2 would be able to see C and D during that time range, as D’s manager has changed from M1 to M2.

Scenario 3

Selected date range 1st to 31st March.

  • M1 would be able to see the data of:

    • A from 20th –31st Mar.

    • B from 1st-31st Mar

    • D from 1st to 20th Mar.

  • M2 would be able to see the data of:

    • A from 1st to 20th Mar.

    • C from 1st to 31st Mar.

    • D from 20th-31st Mar

Scenario 4

  • Let’s suppose E is a new hire under M2 and has joined on 20th March, then E data will only be available under M2 from 20th-31st March. 1st –20th March’s data for E will not be available as there was no manager.