Trend Forecasting
Updated
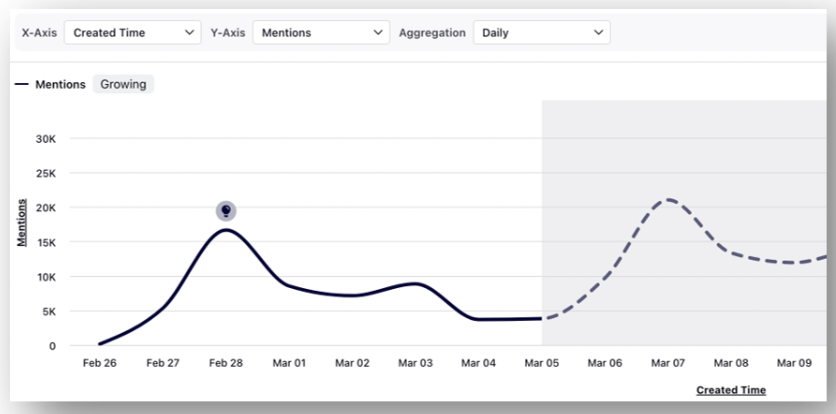
In today’s fast-paced market, anticipating trends and making informed decisions ahead of time is crucial for success. The trend forecasting feature is designed to give businesses a clearer view of their future performance. This upgraded forecasting tool analyzes the metrics and datasets you choose and applies a robust mathematical model to predict values for upcoming dates. By visualizing these trends, businesses can identify potential opportunities and challenges before they arise, enabling smarter, data-driven decisions.
The forecasting feature is available specifically when users plot data from the "Last 365 Days" with a Daily Aggregation, over line widget and spline widget. It can project trends up to 90 days into the future, providing a valuable planning horizon to support strategic initiatives.
Use Cases
Enhance Strategic Planning with Predictive Data Insights: Gain a clearer view of future trends to support proactive and informed decision-making. This capability helps you anticipate changes in engagement, volume, and performance before they occur. With integrated forecasting tools, you can optimize marketing and product strategies to stay ahead of evolving customer needs and market dynamics, ensuring your business remains agile, relevant, and competitive.
Forecast Trends in Conversations, Engagement, and Reach: With predictive analytics, clients gain early visibility into how discussions, audience interaction, and content reach are likely to evolve. This forward-looking intelligence supports proactive planning, allowing teams to optimize campaigns, allocate resources effectively, and respond to market dynamics with confidence.
Prerequisites
You would need to have access to the Listening Dashboard.
How does it work?
The Trend Forecasting feature in Sprinklr helps you predict how key metrics will behave in the near future based on past performance. When you plot data for the "Last 365 days" on daily aggregation using a spline or line widget, the system applies a mathematical forecasting model to project values for up to the next 90 days.
Setting up Trend Forecasting
Navigate to Sprinklr Insights and go to the Listening Dashboard under custom.
Go to Dashboard Manager and access the required dashboard.
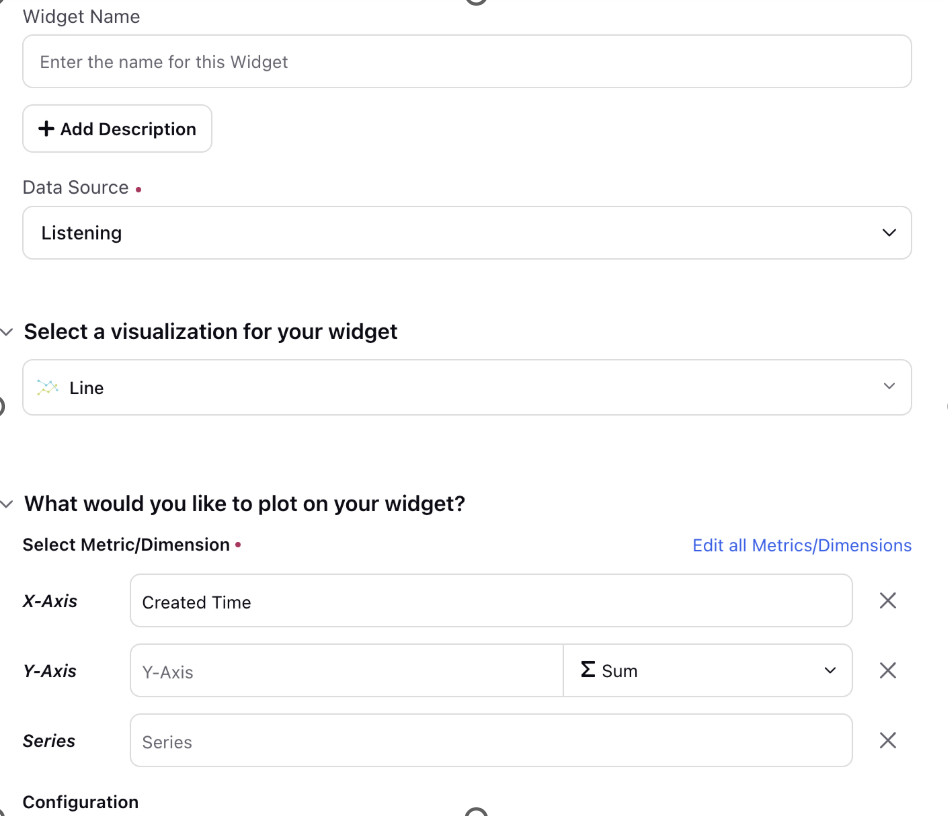
In Select a visualization for your widget select Line chart or Spline widget.
Under Metrics and Dimensions in X-Axis select Created Time and in Y-Axis, select the metric. You can select mentions, engagement, reach, etc. as metrics to be plotted against created time.

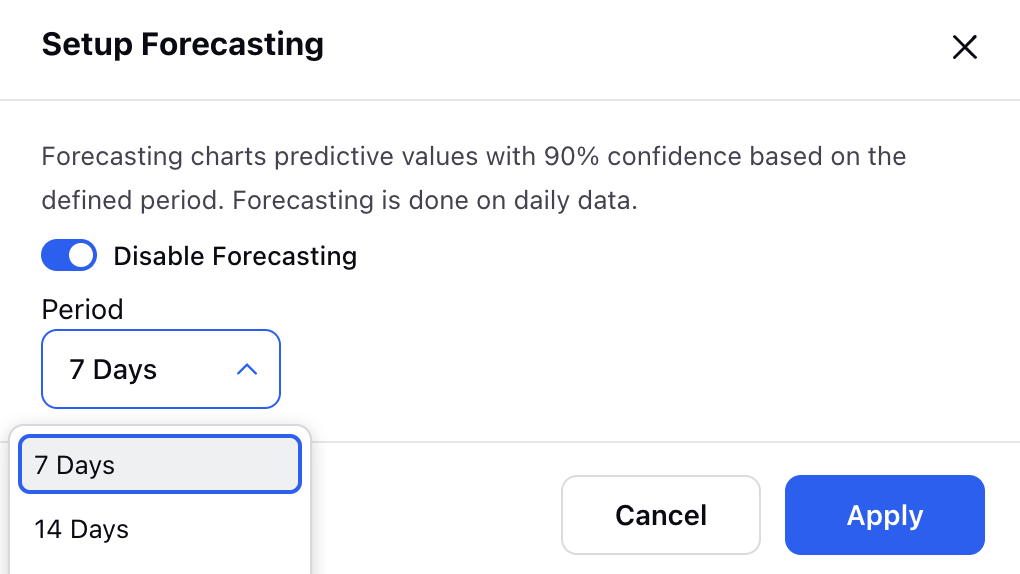
Once the widget it created, click Horizontal Ellipses (3 dots) and select Forecasting. You can get a data of maximum of 90 days. On clicking Forecasting, it will take you to Setup forecasting window.
Enable Forecasting: Toggle to enable forecasting.
Period: Select the time period for which you would want the forecasted data.
Click Apply.


Note: You can generate a simulation to preview how the data is expected to appear.

Note: Forecast can be plotted only for Line or Spline type visualizations for the last 365 days or lifetime range with daily aggregation.