Manage Request Dashboards
Updated
Request Dashboards provide administrators and agents with streamlined access to various types of requests, including Time Off, Shift Trade, and Shift Bid requests. Administrators can configure custom Request Dashboards to review and manage requests through approval and rejection workflows. Using the My Requests dashboard, agents can initiate, track, and manage their requests within the system.
This article outlines the essential steps for managing approval workflows, including:
Creating new Request Dashboards.
Viewing existing Request Dashboards.
Updating Request Dashboards.
Cloning Request Dashboards.
Sharing Request Dashboards.
Locking/unlocking Request Dashboards.
Deleting Request Dashboards.
Viewing the activity log of Request Dashboards.
Create New Request Dashboards
Follow these steps to create a new Request Dashboard:

Go to the Workforce Manager Persona App on the Launchpad.
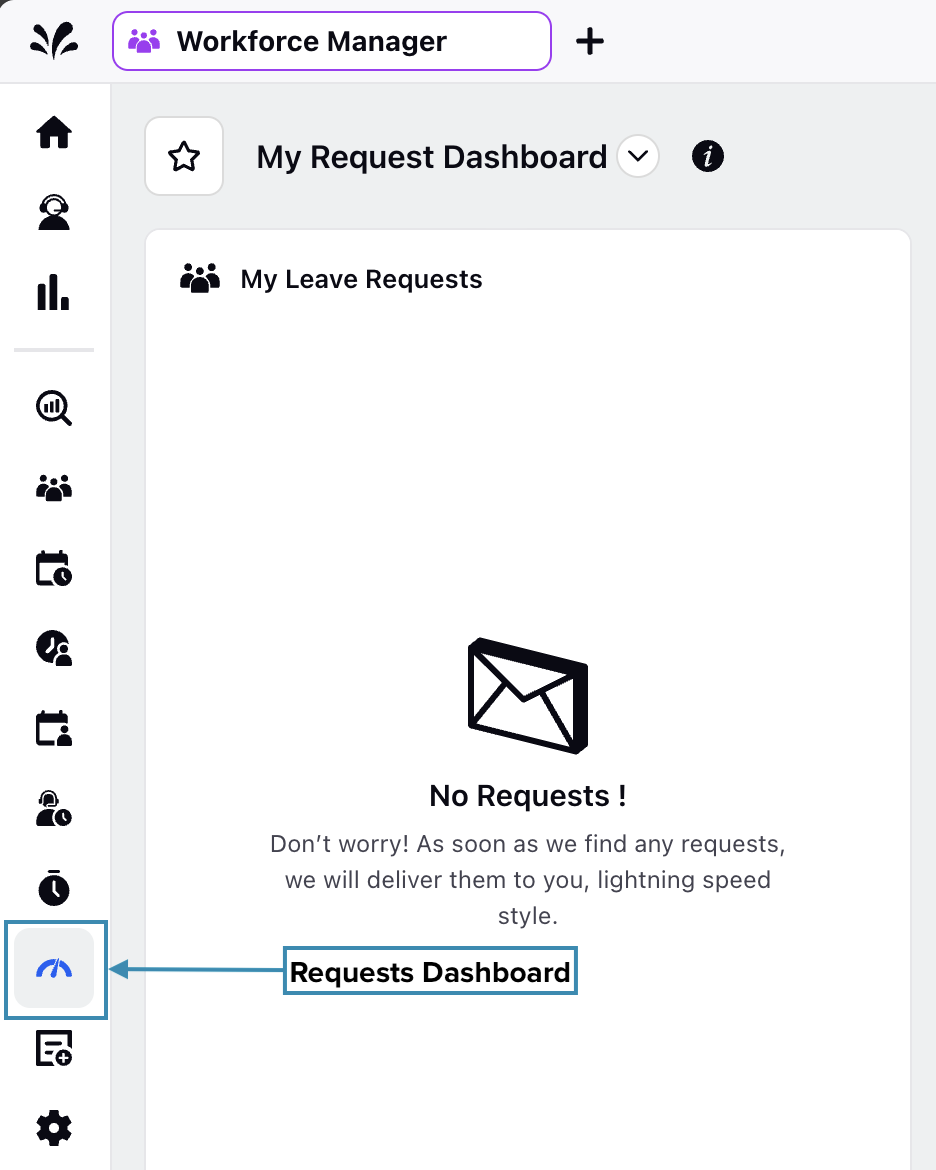
Select Requests Dashboard from the Left Pane.

Click the Dashboard Actions (ellipsis (…) icon) button at the top right of the page. This will show a list of options.
Select Add Dashboard from the list of options to open the Add Dashboard dialog box.
Fill in the required fields on the Add Dashboard dialog box. Fields marked with a red dot are mandatory. Below are the descriptions of all the fields on this dialog box:
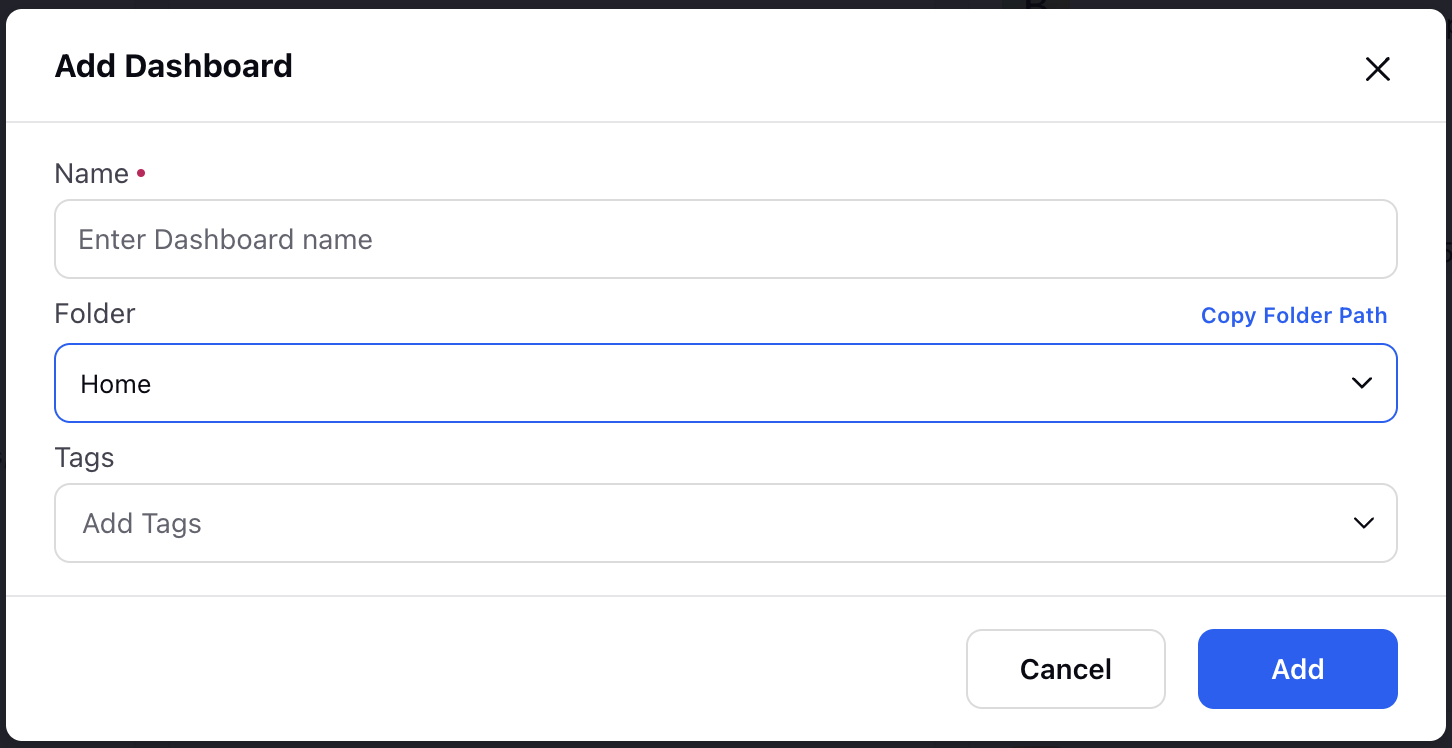
Name: Enter the name of the Request Dashboard. (Required)
Folder: Select the folder in which the Request Dashboard must be created. Home is selected by default. (Required)
Tag: Select the suitable tag(s) for the Request Dashboard.
Click the Add button at the bottom right of the dialog box to create the Request Dashboard.
A Request Dashboard with the specified name will be created. It will initially have no columns, which will need to be configured. Refer to the Update Request Dashboards section to configure your columns in the Request Dashboard.
View Existing Request Dashboards
Given that multiple Request Dashboards can be created, it is necessary to view the relevant dashboard.
Follow these steps to view existing Request Dashboards:

Go to the Workforce Manager Persona App on the Launchpad.

Select Request Dashboards from the Left Pane.
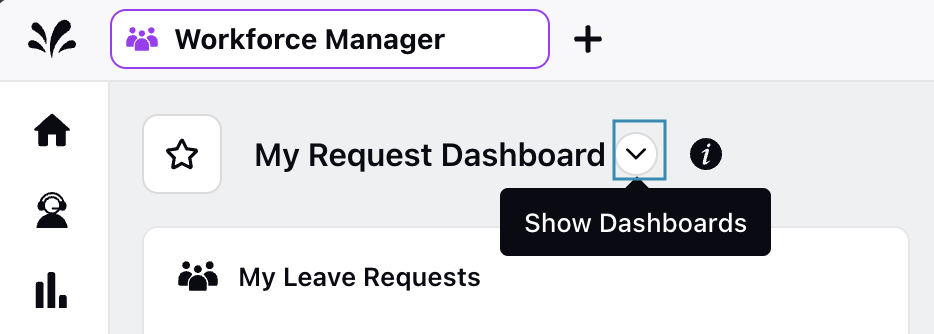
Click the Show Dashboards button at the top left of the page. This will show the list of all existing Request Dashboards in your environment.
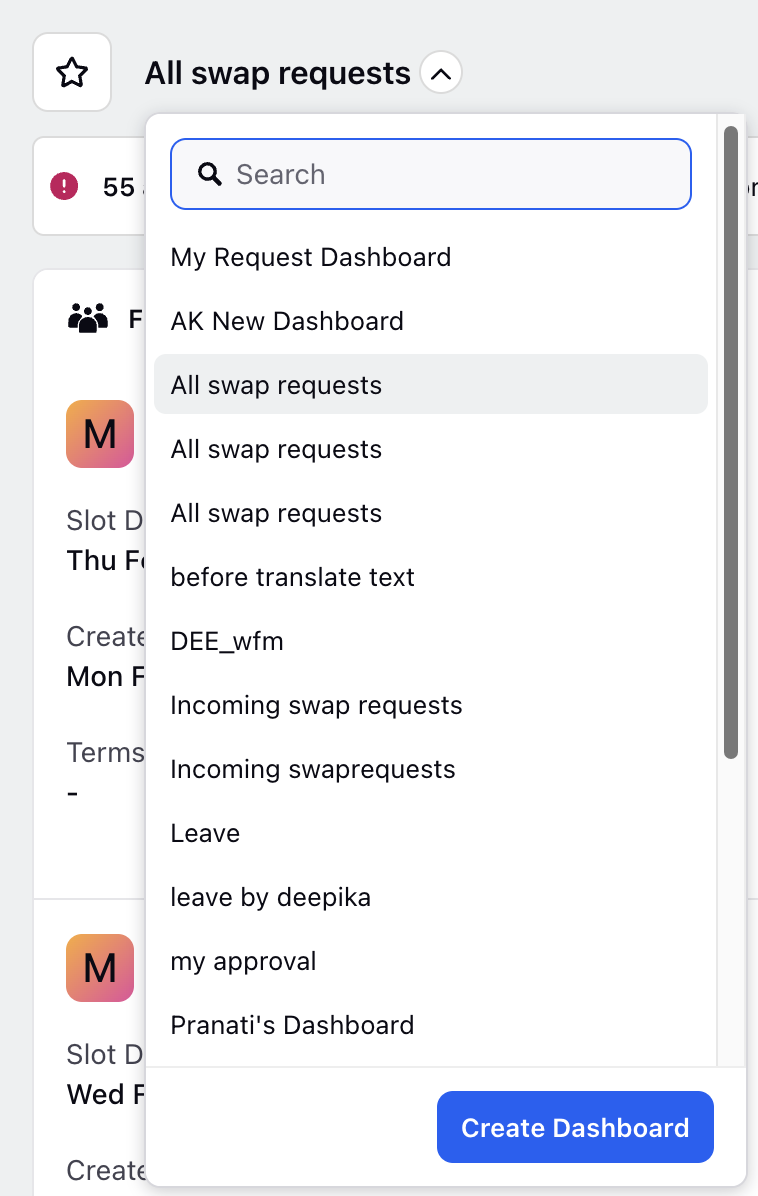
Select the required Request Dashboard from the list. You can also search for it using the search bar.
Note: Select “My Request Dashboard” to view the My Requests dashboard.
This will open the desired Request Dashboard. From here, you can configure it, like adding or removing certain columns, view its activity log, and take action, such as cloning, sharing, or deleting it.
Update Request Dashboards
Add Columns in Request Dashboards
Follow these steps to add columns in Request Dashboards:
Open the relevant Request Dashboard. Select “My Request Dashboard” to update the My Requests dashboard.

Click the Add Columns button at the top right of the page. This will open the Add New Column page.

Select the Workforce Management source on this page. You can also search for it using the search bar. This will open the Add New Workforce Management Column page.

Select the type of column you want to add. This will open the page to configure the column details. Below are the available column types:
Search
Assigned To Me
Created by Me
My Participated
Eligible For Me.
Note: Eligible For Me column type only allows Shift Trade Request as Request Source.
Note: The Search column type will be visible only if you have the All Users Accessible permission under the General Permissions section of the Workforce Management module.
Fill in the required fields on the page. Fields marked with a red dot are mandatory. Below are the descriptions of all the fields on this page:
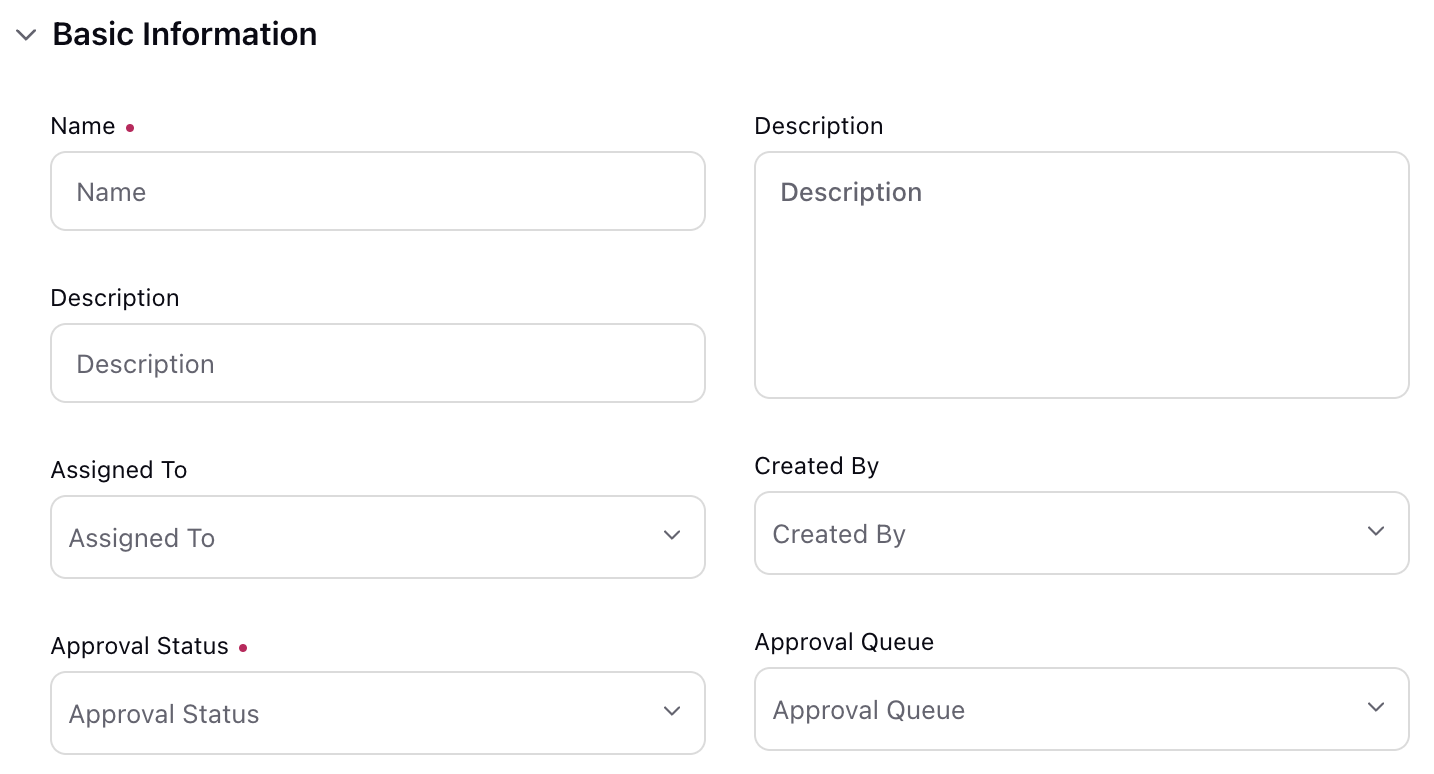
Name: Enter the name of the column, such as Time Off requests or Shift Trade requests. (Required)
Description: Provide a description of the column.
Request Source: Select the type of requests to be displayed in the column. The following options aer available: (Required)
Time Off Request
Shift Trade Request
Time Off Slot Request
Overtime Slot Request
Shift Change Request.
Approval Status: Only the requests with the selected approval status will appear in the column. Following are the available options and their description: (Required)
Select All: All the following approval statuses will be selected.
Rejected: Only show the requests that have been rejected.
Waiting for approval: Only show the requests that are still awaiting approval.
Approved: Only show the requests that have been approved.
Waiting: Only show the waitlisted requested.
Assigned To: Requests assigned to the selected user(s) will be displayed in the column. This field is available only for Created By Me, My Participated, Approval Queue, and Search column types.
Created By: Requests created by the select user(s) will be displayed in the column. This field is available only for Assigned To Me, My Participated, Eligible For Me, and Search column types.
Approval Queue: Requests in the selected approval queues will be displayed in the column. This field is available only for Approval Queue and Search column types.
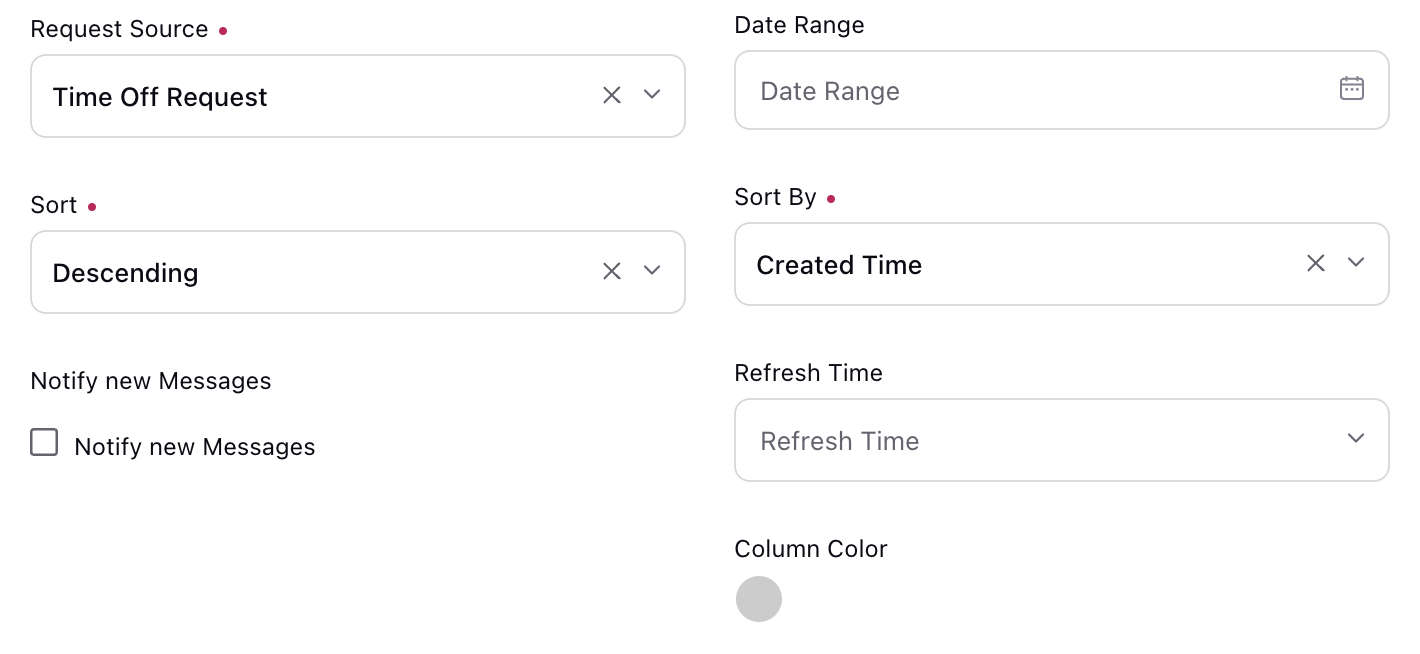
Date Range: Select the date range for displaying requests in the column.
Sort: Choose if the requests should be sorted in Ascending or Descending order. (Required)
Sort By: Create Time is selected by default.
Notify new Messages: Select this option if you want to receive a system notification when a new request is received.
Refresh Time: Select the frequency at which the column should be refreshed. The available options range from 10 seconds to 30 minutes.
Column Color: Choose a color for the column for easy identification. You can choose a color using the color picker or by entering a hexadecimal code.
Click the Create button at the bottom right of the page to add the column with the provided details.
This completes the process of adding columns in Request Dashboards.
All Users Accessible Permission Behavior
The following section discusses the behavior of the All Users Accessible permission under the General Permissions section of the Workforce Management module.
You can review (approve or reject) all the requests if you have this permission.
If you do not have this permission and someone shares the Request Dashboard with you, you will be able to view all requests in it. However, you will not be able to take any action on requests that are not assigned to you.
The Search column type will be visible only if you have this permission.
Delete Columns from Request Dashboards
Follow these steps to delete columns from Request Dashboards:
Open the relevant Request Dashboard.

Click the More Options (ellipsis (…) icon) button corresponding to the column you want to delete. This will show a list of options.
Select Delete from the list of options to open the Delete Column dialog box.

Click the Delete button to delete the column.
This completes the process of deleting a column from Request Dashboards.
Clone Request Dashboards
Cloning a Request Dashboard allows you to replicate an existing dashboard with all its configurations quickly. This is particularly useful when creating a similar dashboard with minor adjustments, saving time and ensuring consistency across your dashboards.
Follow these steps to clone Request Dashboards:
Open the relevant Request Dashboard.

Click the Dashboard Actions (ellipsis (…) icon) button at the top right of the page. This will show a list of options.
Select Clone Dashboard from the list of options to open the Clone Dashboard dialog box.
Fill in the required fields on the Clone Dashboard dialog box. Fields marked with a red dot are mandatory. Below are the descriptions of all the fields on this dialog box:
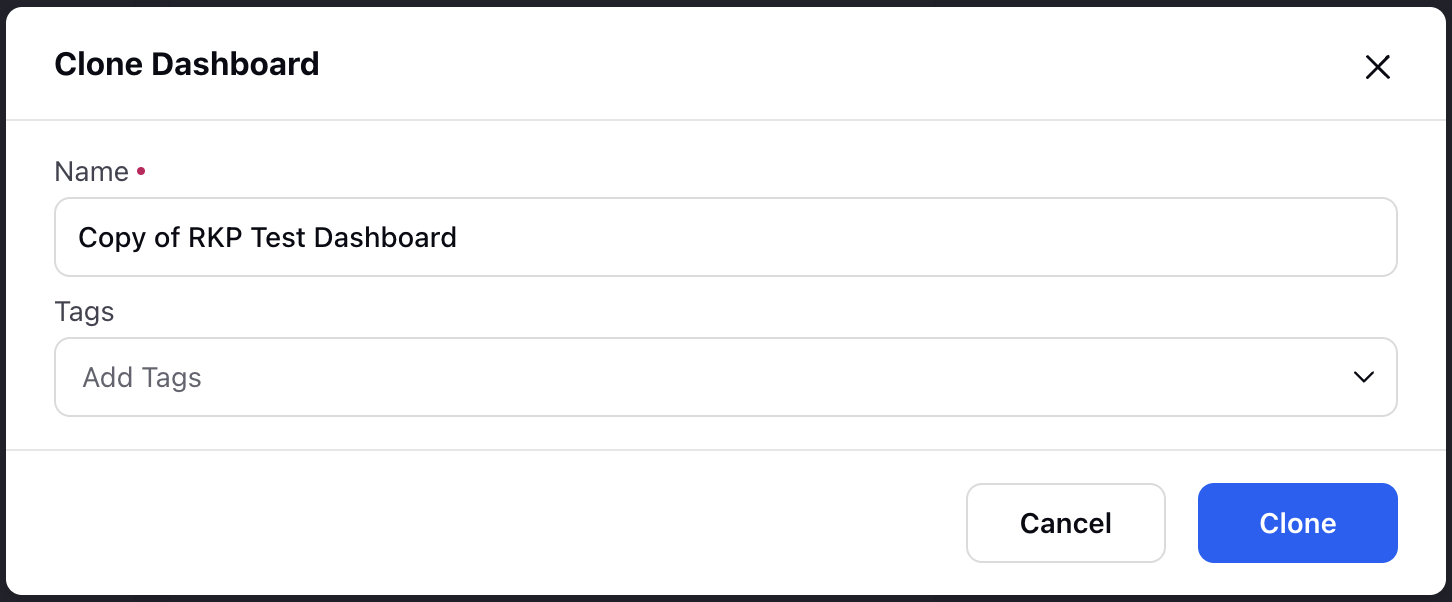
Name: Enter the name of the cloned dashboard. By default, the cloned Request Dashboard will have the name “Copy of <Original Request Dashboard name>”. (Required)
Tag: Select the tag(s) for the cloned Request Dashboard.
Click the Clone button to create a clone of the Request Dashboard.
This completes the process of cloning a Request Dashboard.
Share Request Dashboards
Follow these steps to clone Request Dashboards:
Open the relevant Request Dashboard.

Click the Dashboards Action (ellipsis (…) icon) button at the top right of the page. This will show a list of options.
Select Share Dashboard from the list of options to open the Share Dashboard window.
Fill in the required fields on the Share Dashboard window. Fields marked with a red dot are mandatory. Below are the descriptions of all the fields on this dialog box:
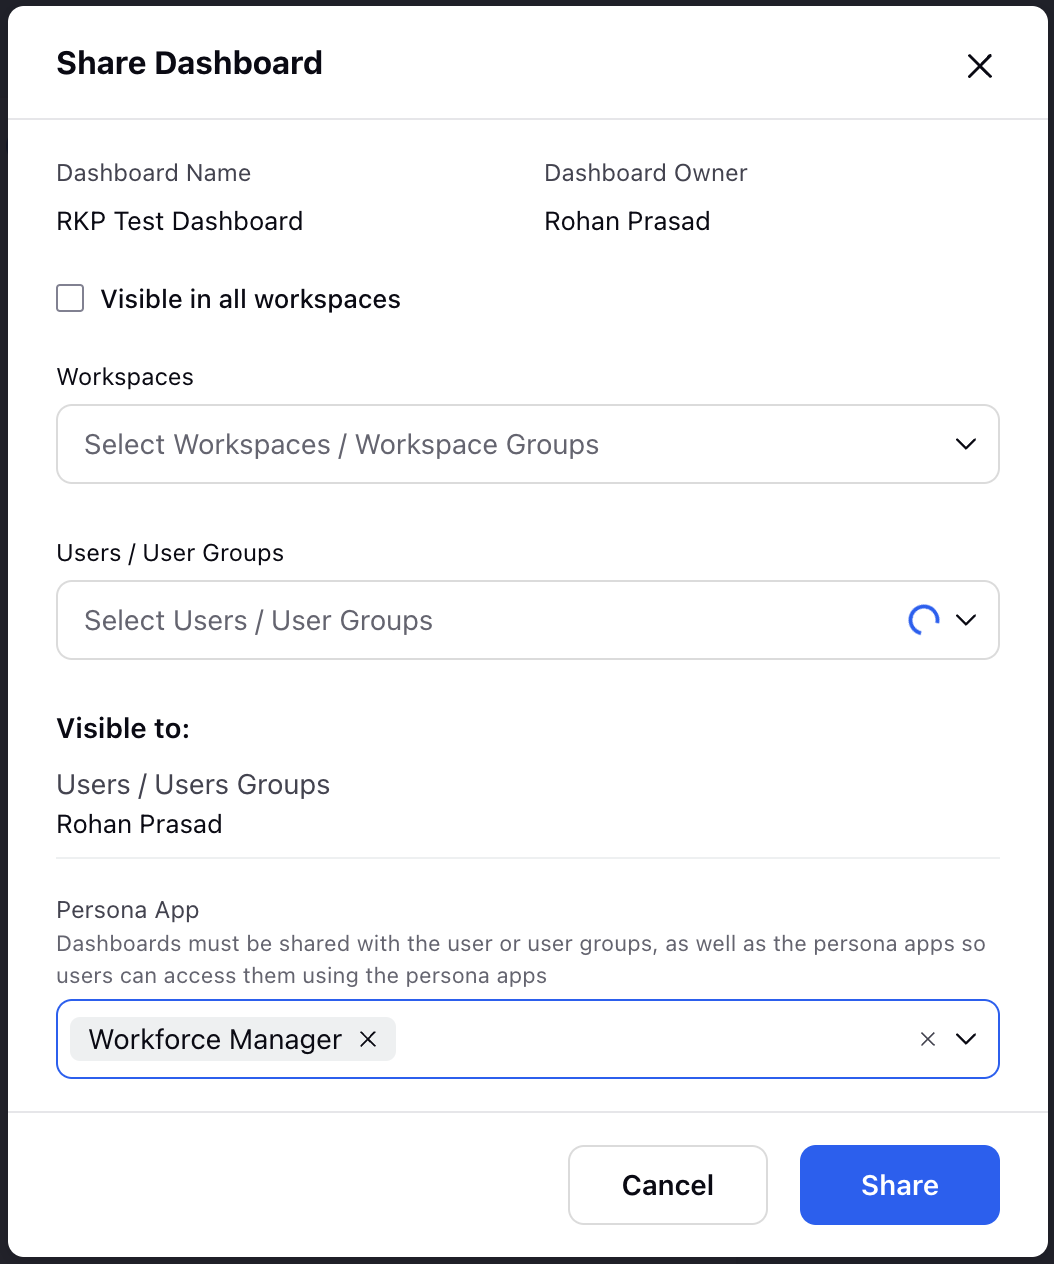
Visible to all users: Select this checkbox to share the Request Dashboard with all available Users.
Workspaces: Select the workspace(s) with which you want to share the Request Dashboard. This field will be accessible only if the Visible to all users checkbox is not selected.
Users/User Groups: Select the User(s)/User Group(s) with whom you want to share the Request Dashboard. This field will be accessible only if the Visible to all users checkbox is not selected.
Persona App: Select the available Persona Apps with which you want to share the Request Dashboard.
Click the Share button to share the Request Dashboard.
This completes the process of sharing Request Dashboards with the selected workspaces, users, user groups, and Persona Apps.
Lock/Unlock Request Dashboards
Locking a Request Dashboard ensures its configuration remains unchanged, preventing accidental modifications. This will remove the options to add columns and edit the dashboard.
Conversely, unlocking an already locked Request Dashboard allows you to make necessary updates and adjustments. This will make the options to add columns and edit the dashboard available.
Follow these steps to lock or unlock Request Dashboards:
Open the relevant Request Dashboard.

Click the Dashboards Action (ellipsis (…) icon) button at the top right of the page. This will show a list of options.

Select Lock Dashboard from the list of options to lock the Request Dashboard if it is currently unlocked. Select Unlock Dashboard from the list of options to unlock the Request Dashboard if it is currently locked.
This completes the process of locking or unlocking Request Dashboards.
Delete Request Dashboards
Follow these steps to delete a Request Dashboard:
Open the relevant Request Dashboard.

Click the Dashboards Action (ellipsis (…) icon) button at the top right of the page. This will show a list of options.
Select Delete Dashboard from the list of options to open the Delete Dashboard dialog box.
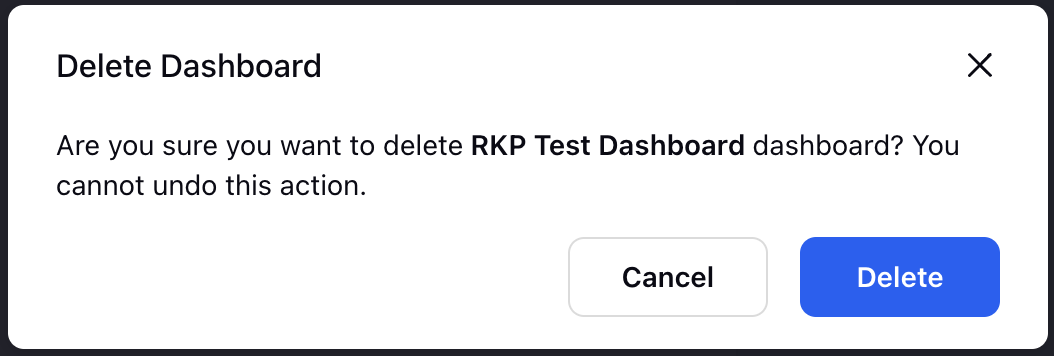
Select the Delete button to delete the Request Dashboard. This action cannot be undone.
This completes the process of deleting Request Dashboards.
View Activity Log of Request Dashboards
Viewing the activity log of a Request Dashboard allows you to track changes and monitor actions taken on the dashboard. This helps you understand who made modifications and when they occurred.
Follow these steps to view the activity log of a Request Dashboard:
Open the relevant Request Dashboard.

Click the Activity button at the top right of the page to the Activity panel from the Third Pane.
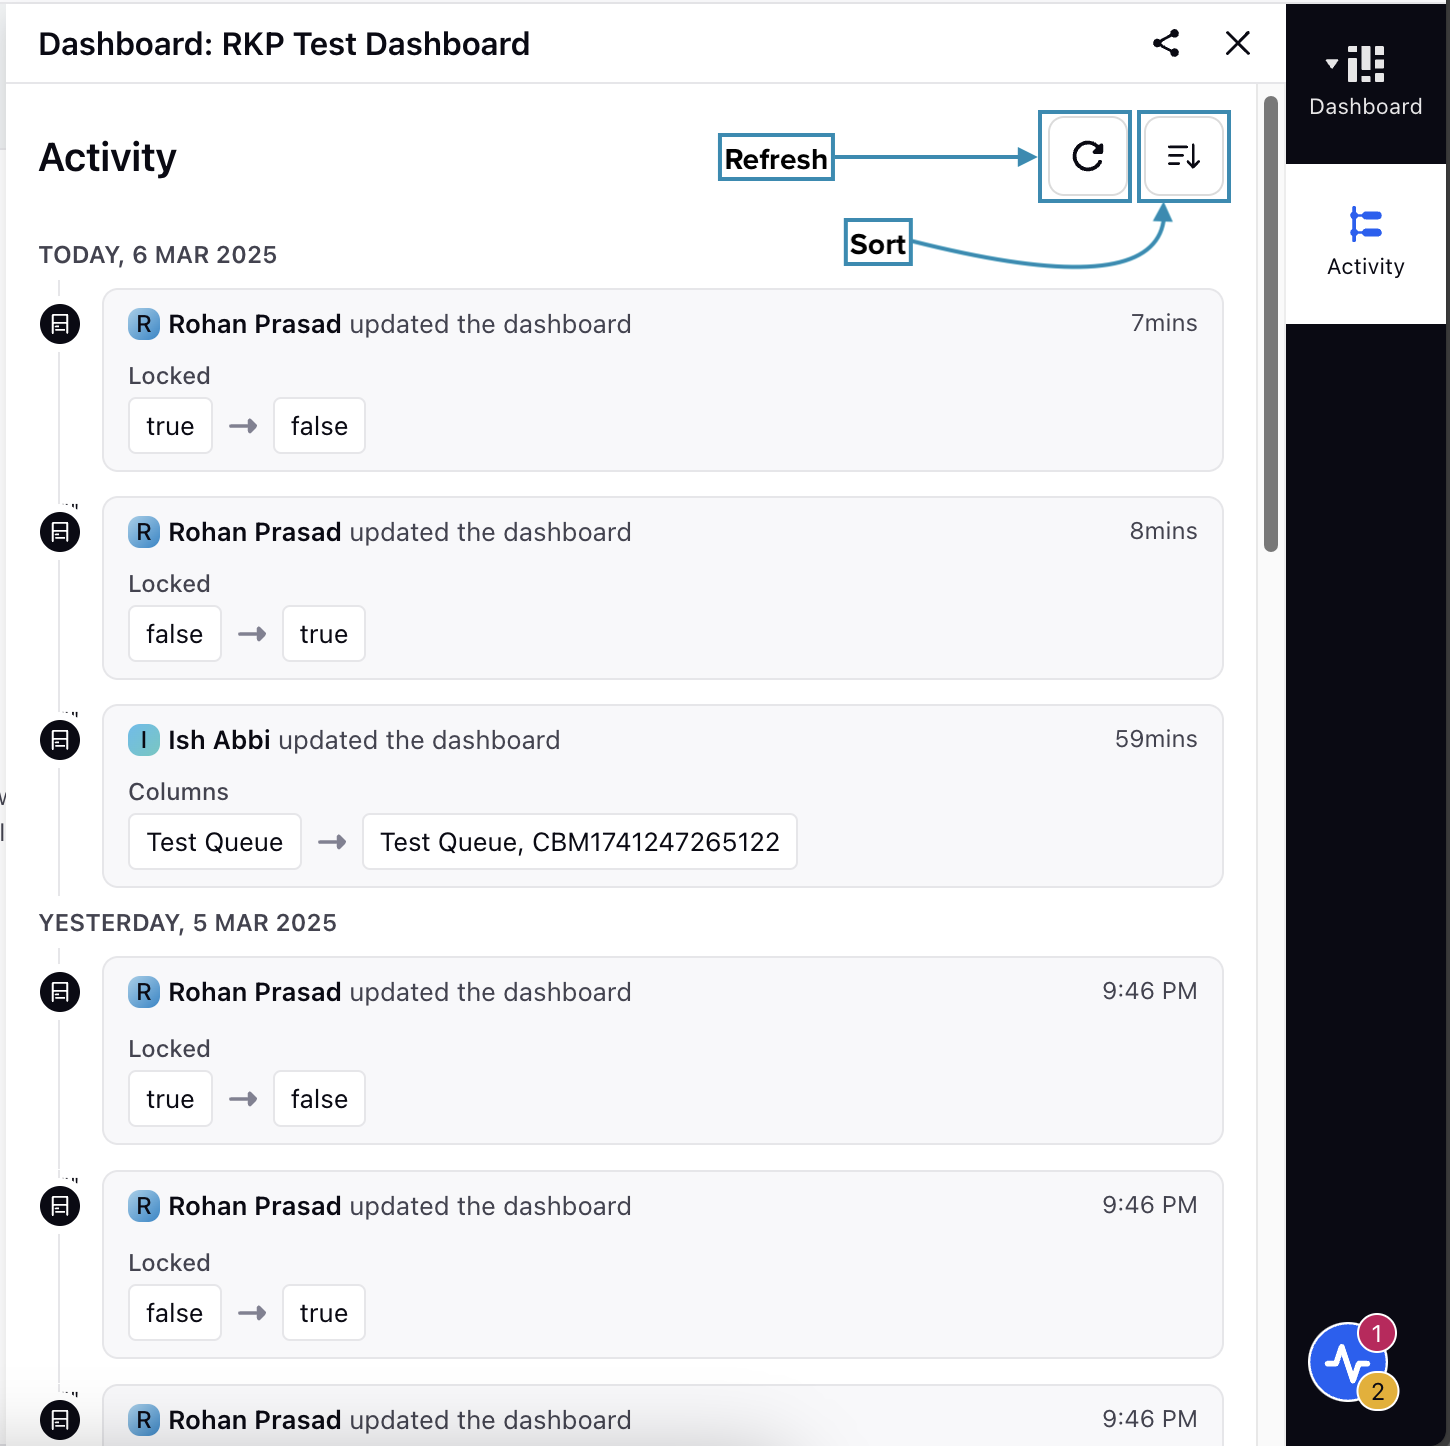
In the Activity panel, Click the Refresh button to refresh the activity log. Use the Sort button to sort the log in either Ascending or Descending order.