Metric Grouping
Updated
This feature allows you to group metrics and dimensions into defined customizable ranges, giving you greater flexibility in organizing and analyzing data within reports. You can create dynamic groupings such as time intervals, performance bands, or custom categories and use them as pivot elements in your dashboards and reports.
Designed to be fully user-configurable, this functionality supports a wide range of use cases and integrates smoothly with your existing reporting structures, helping you enhance both data visualization and decision-making.
Below are some of the scenarios where Metric Grouping helps:
Helps to define groupings or ranges for key performance metrics and dimensions (such as Tenure, Scores, Talk Time, Queue Time) to analyze data more effectively in a scalable way.
Example:
You can group Talk Time into categories like Short, Medium, and Long to identify if certain agent groups have rushed short calls that reduce customer resolution or longer calls on specific topics that require additional training or business improvements.
A contact centre can categorize agents by tenure such as zero to six months, six to twelve months, and over twelve months to assess how agent tenure impacts performance metrics like Talk Time, Occupancy, etc. and identify specific training needs for newer agents, analyze attrition trends, average tenure and even recognize which groups are ideal candidates for leadership positions.
It provides the ability to create, define, name, and sort custom ranges for key performance metrics such as Tenure, Talk Time, Queue Time, etc. so you can segment data in a way that helps you uncover actionable insights and make informed operational decisions.
Prerequisites
You would need permissions for Custom Grouping under the Settings section of Care Reporting to access Metric Grouping, however created Groupings can be used by all.
Not all fields can be grouped, only fields supported by the system will be visible in dropdown.
Create Metric Grouping
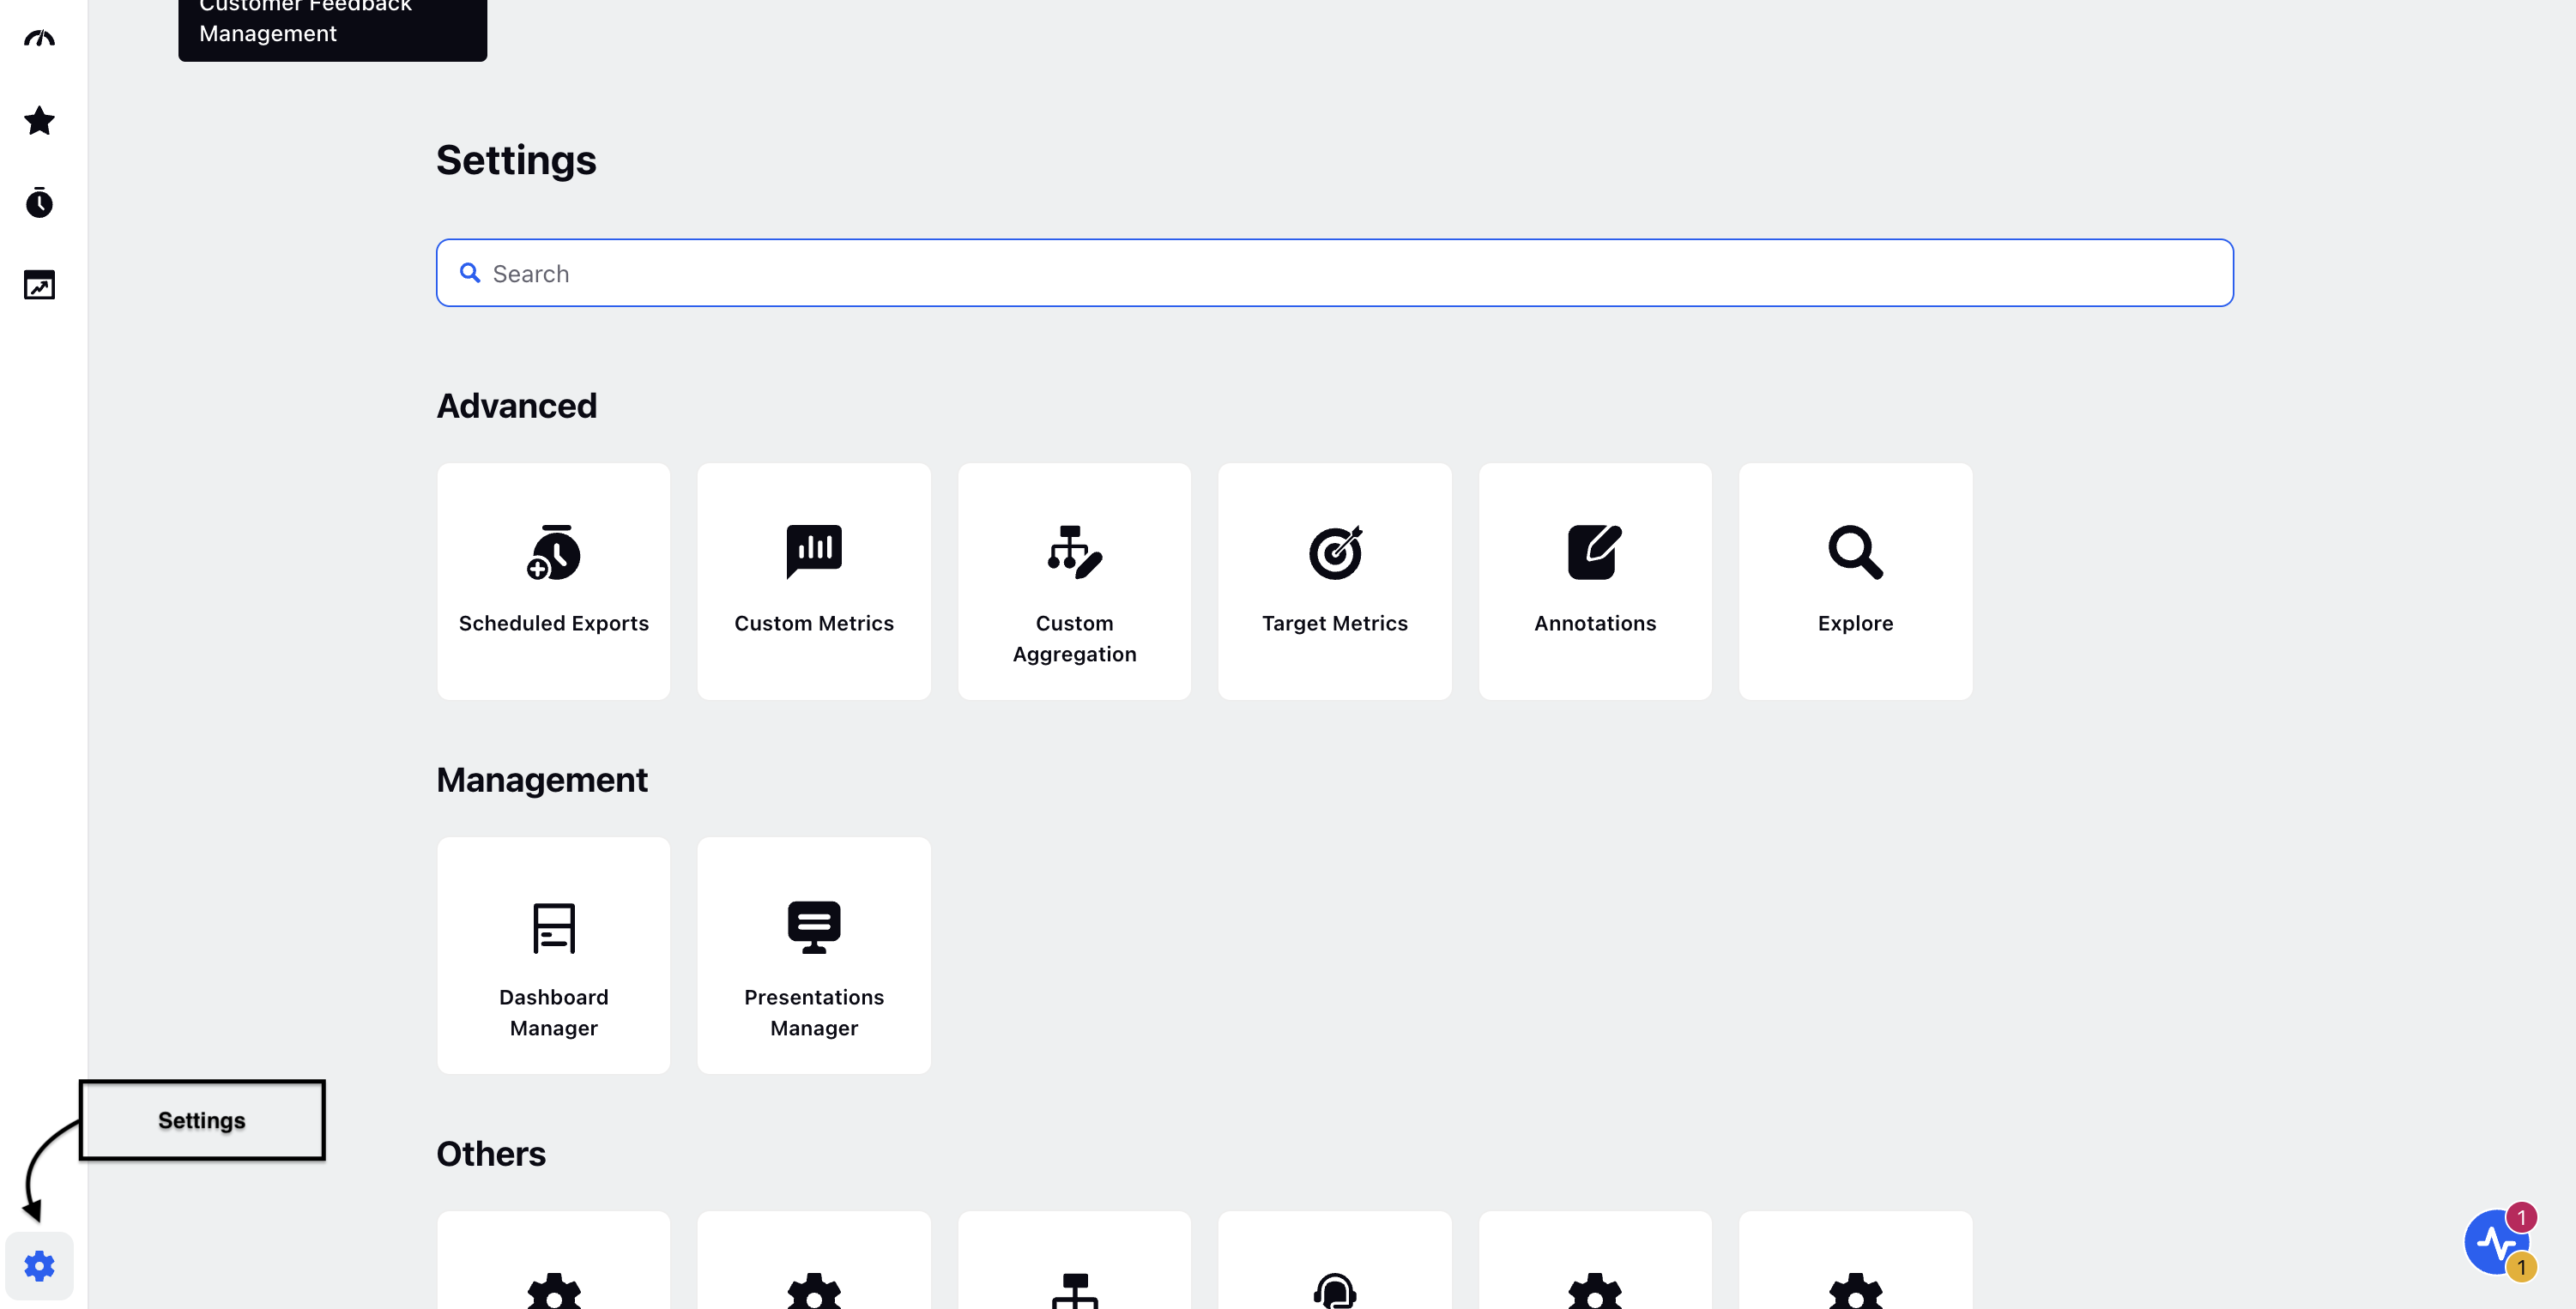
Navigate to Sprinklr Service and go to Care Reporting (Under Analyze in Reporting).
Go to Settings.

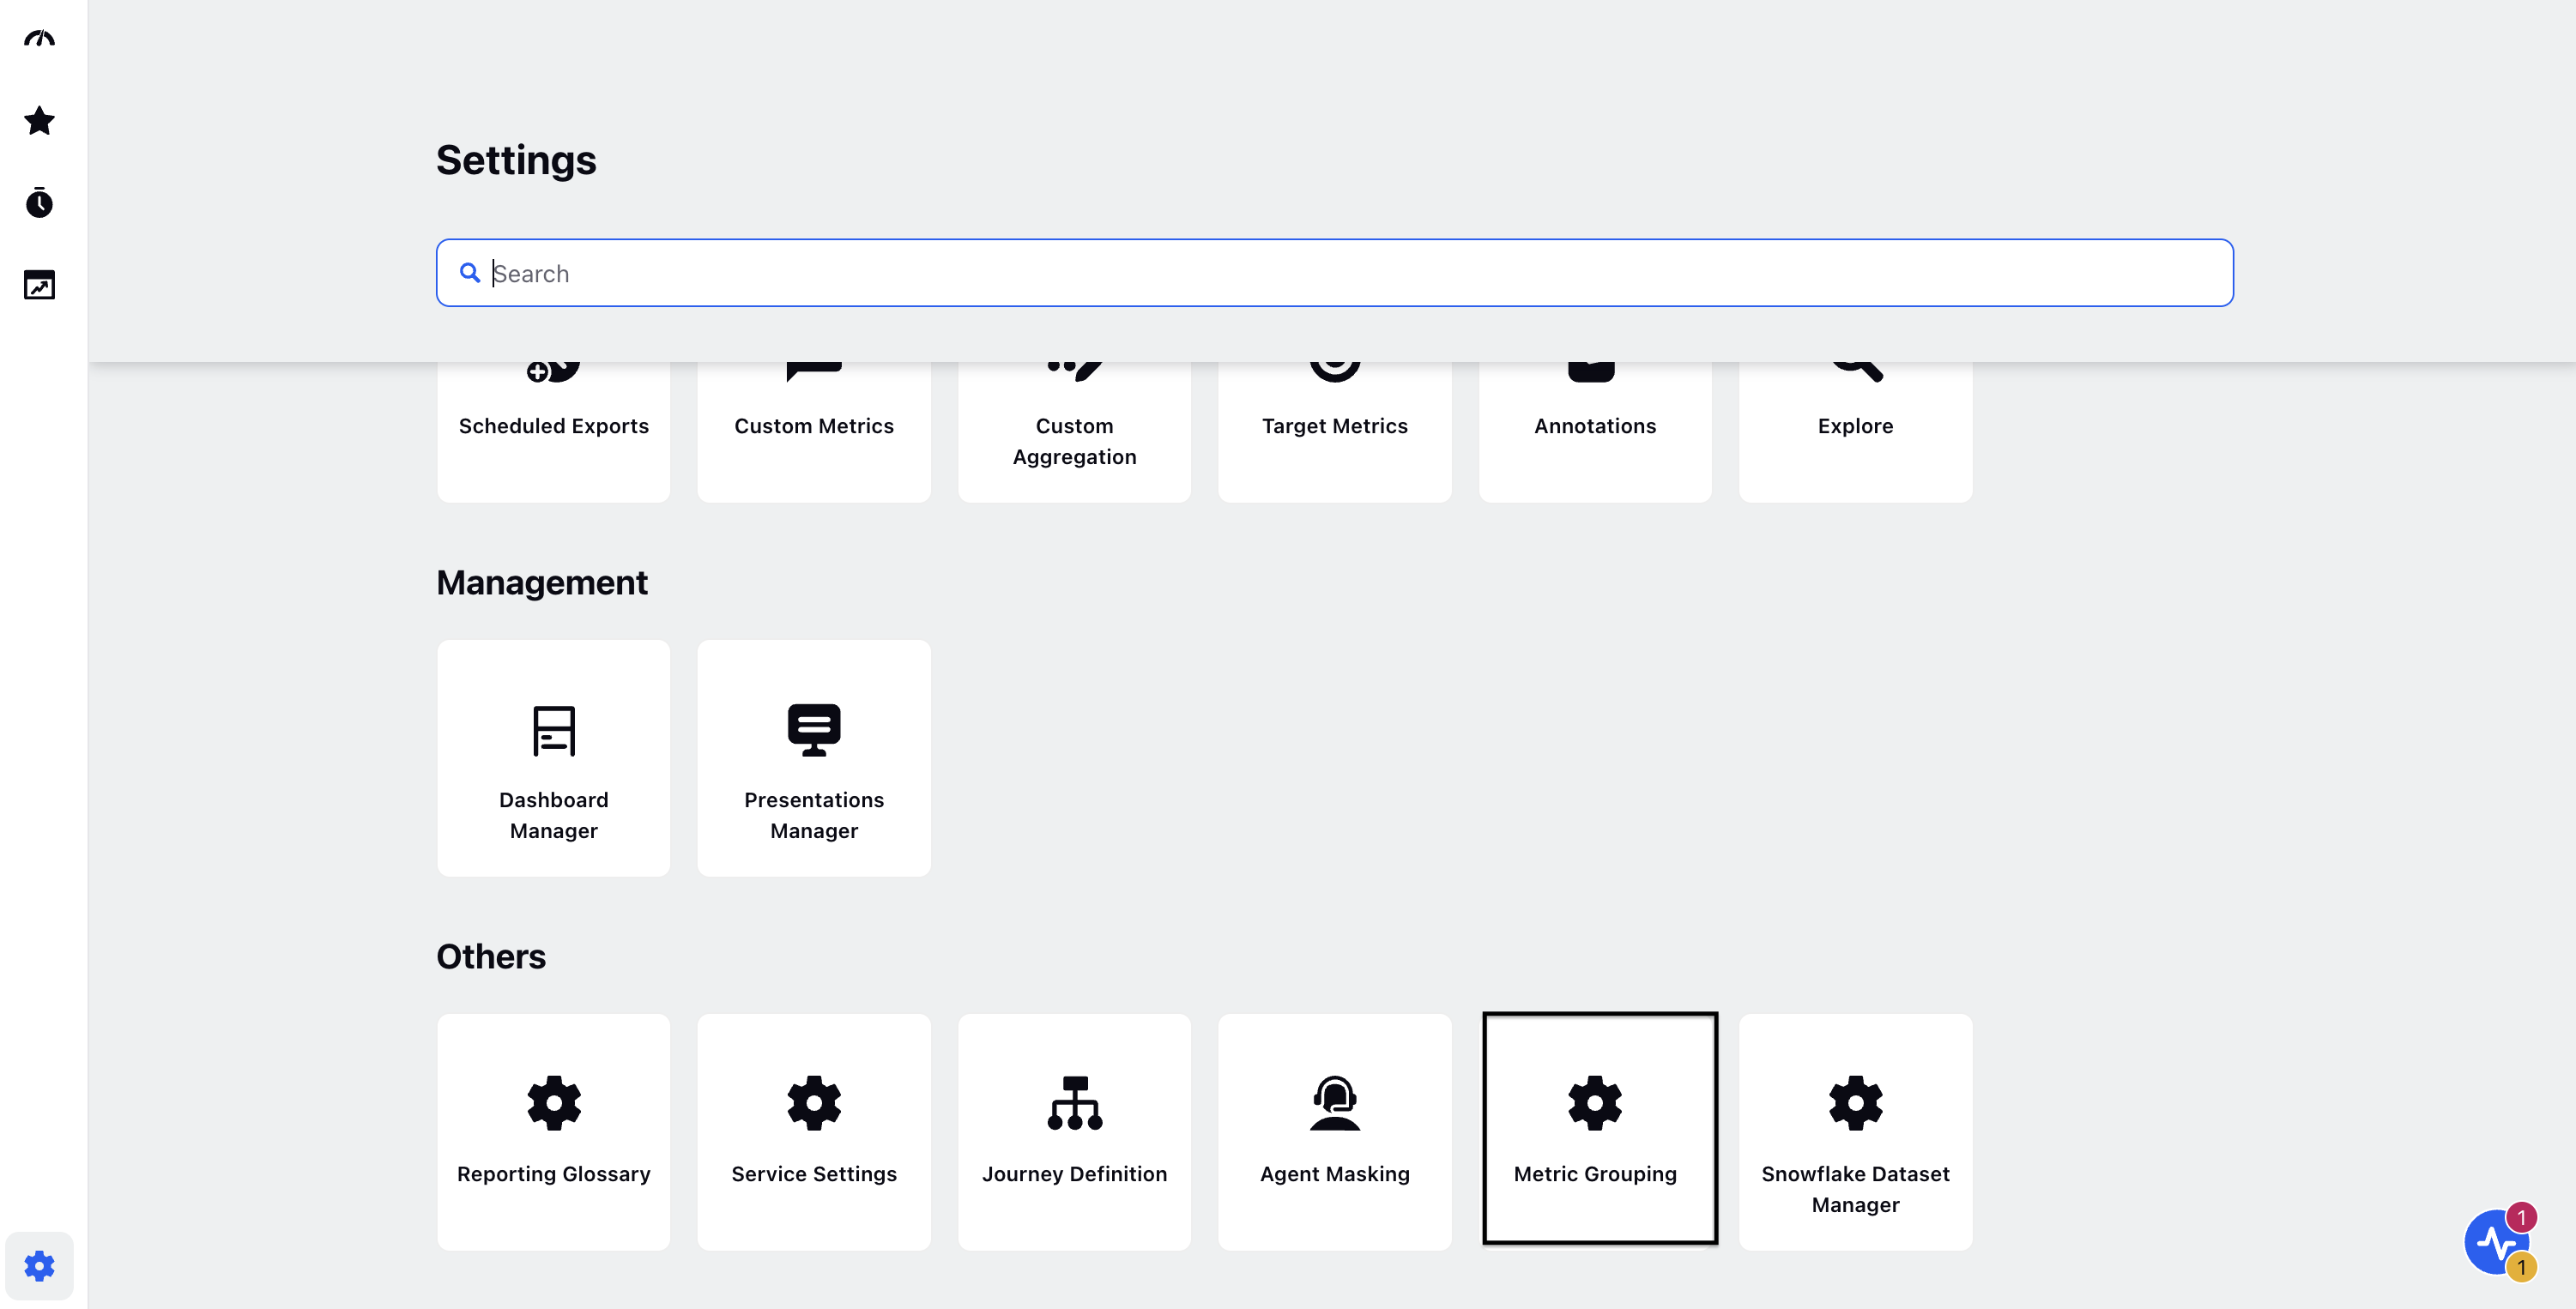
Go to Metric Grouping (under Others).

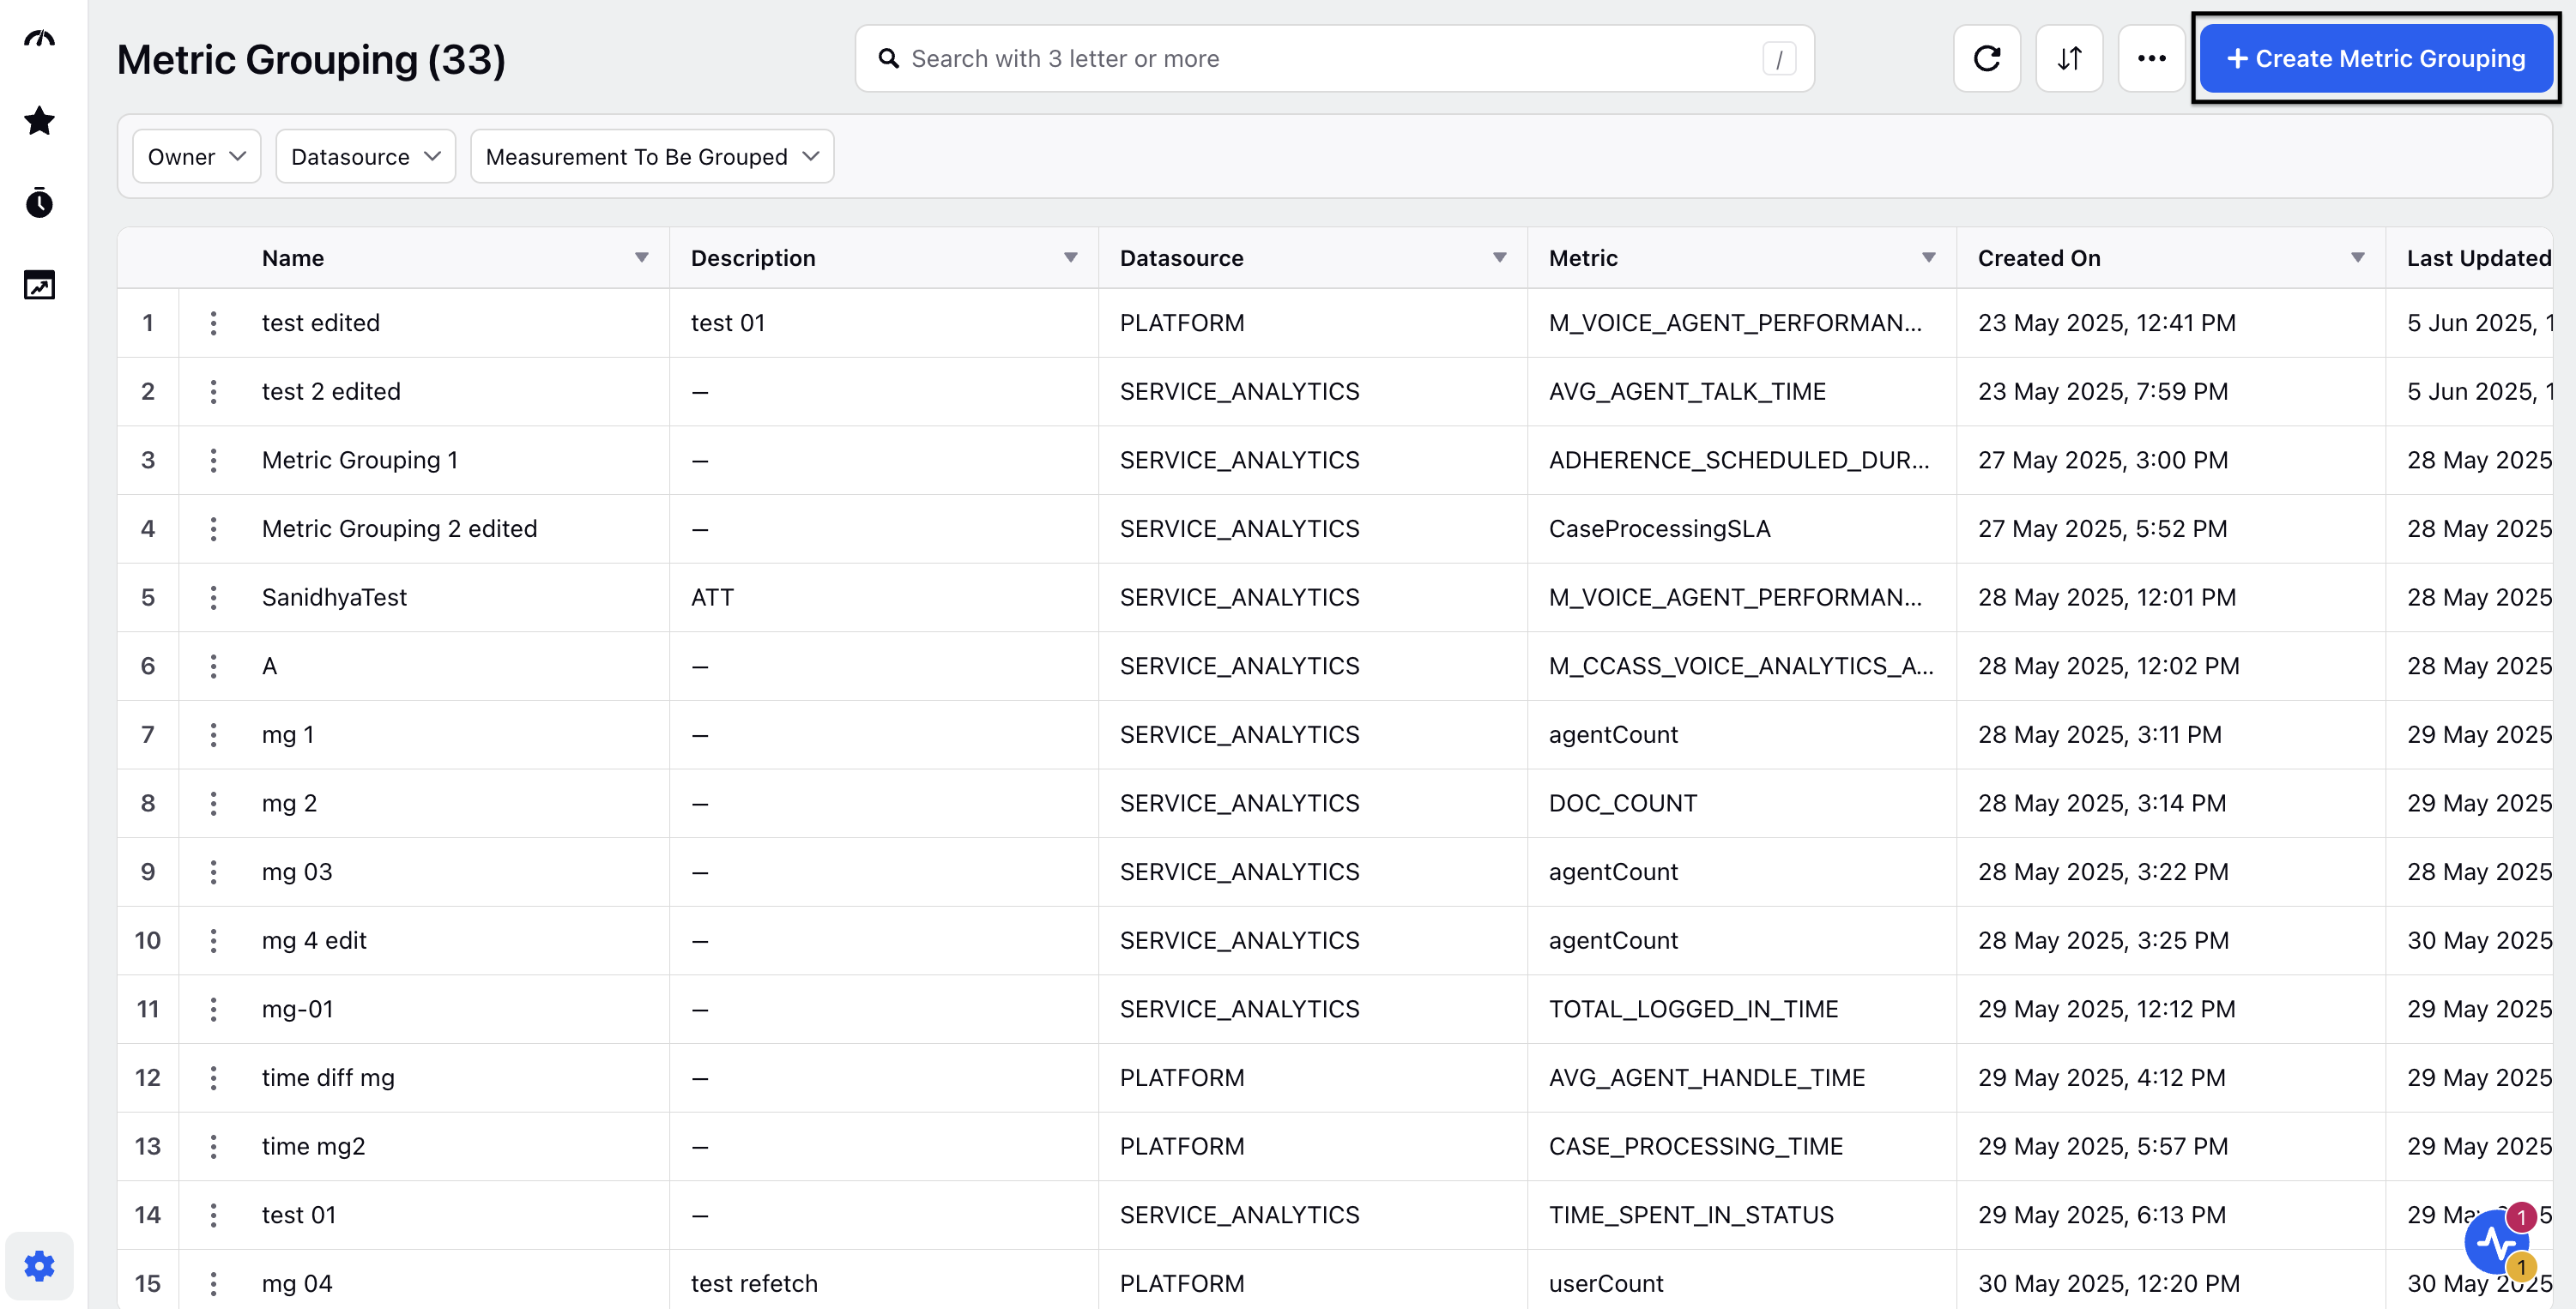
Go to + Create Metric Grouping.

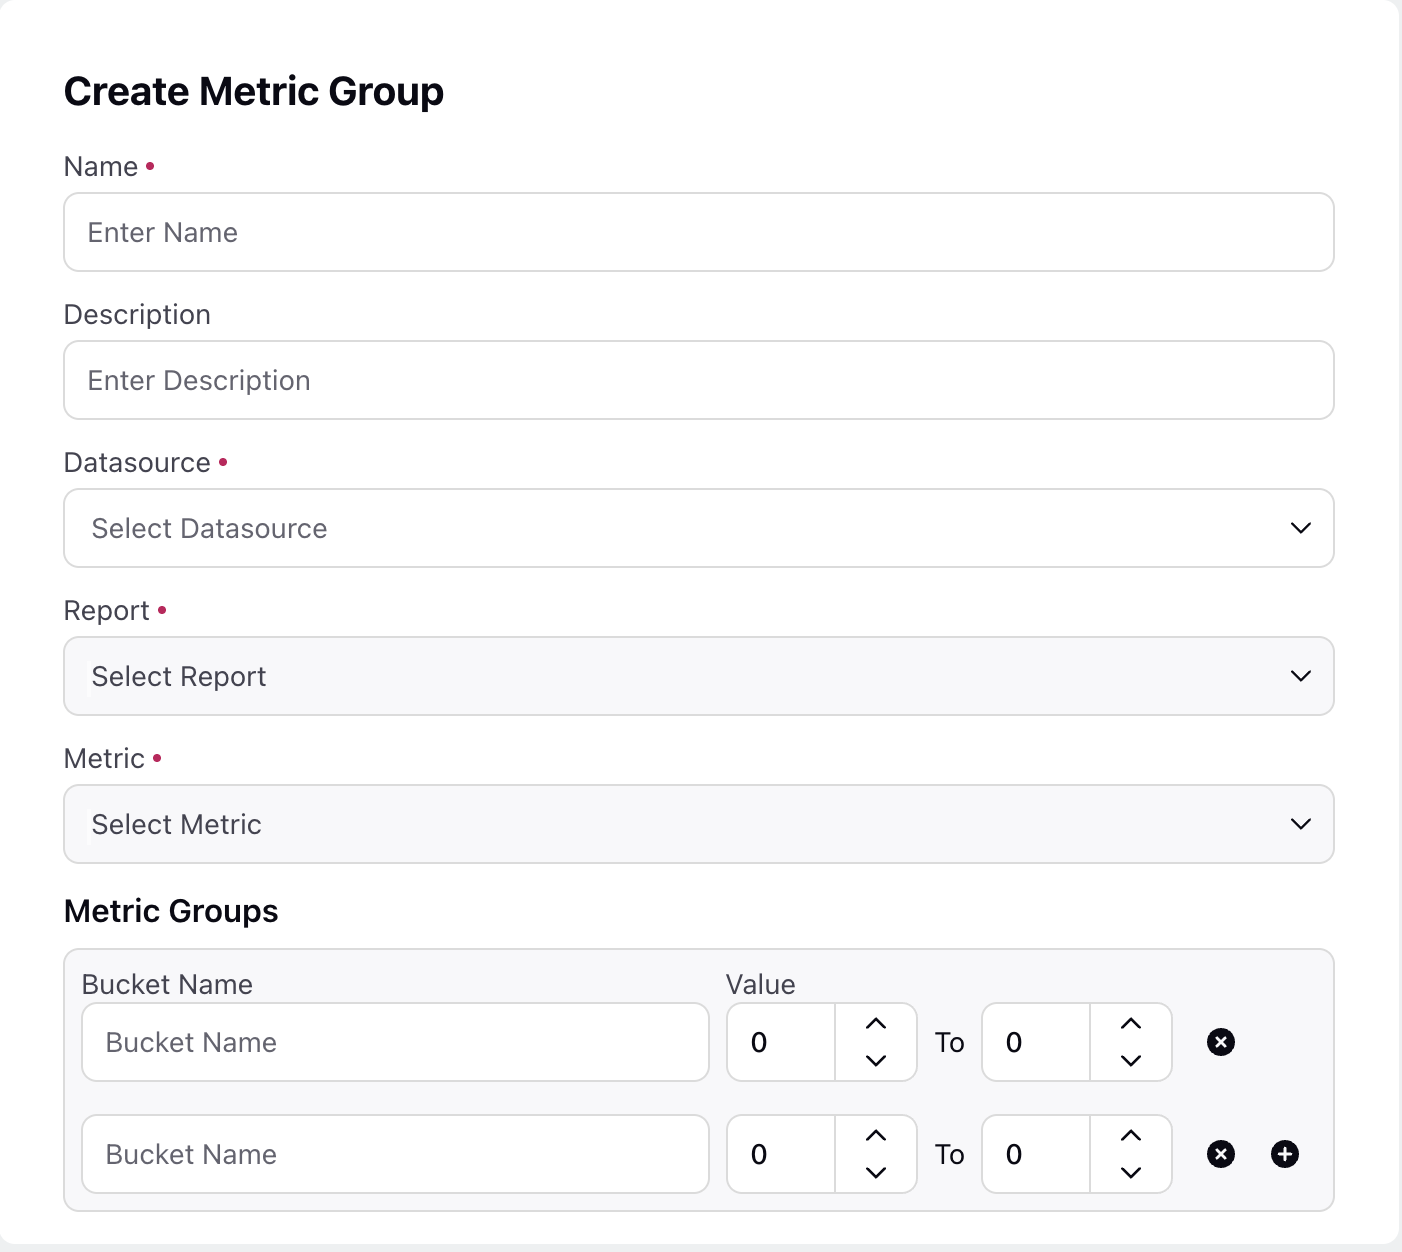
Go to Create Metric Group page and fill in the details:

Name: Enter a meaningful name for the metric group (Mandatory).
Description: Enter a description for the metric group.
Datasource: Select data source either social analytics or service analytics (Mandatory).
Report: Select the required report from the drop-down (Mandatory).
Metric: Select metric from the dropdown (Mandatory).
Go to Metric Groups and select the Bucket Name and under Value select the value between which you would want to define the group.

You should be able to define and set lower and upper limits for each range. Any value that falls outside the defined ranges would be categorized as an “Undefined Range.”
By clicking Add (+) option you can add multiple Bucket Name and Value.
Click Save, & within a few minutes the Dimension should reflect in the Widget Builder.
The resulting Grouping will be available under the Report & Use-case of the Metric basis which it has been created.