Agent Performance Digital

Updated 

The Agent Performance Digital Report provides comprehensive insights into an agent's performance across various digital channels such as chat, email, and messaging platforms.

It tracks key metrics like response time, which measures how quickly agents respond to customer queries, and resolution time, indicating how long it takes to resolve customer issues at one place. The report also includes customer satisfaction (CSAT) scores, reflecting how satisfied customers are with the service, and First Contact Resolution (FCR), which shows the percentage of issues resolved during the first interaction.

Scenarios for using the report

  • Performance Monitoring: Managers can use the report to assess the strengths and weaknesses of agents and make informed decisions about training or workload adjustments.

  • Identifying Trends: It helps identify patterns in agent performance, like peak hours of high efficiency or moments when escalations are more frequent.

  • Customer Satisfaction Improvement: By analyzing performance and satisfaction data, organizations can better understand customer needs and improve service quality.

The Agent Performance Digital Report provides actionable data that helps businesses improve agent efficiency, enhance customer service, and optimize workforce management across digital channels.

Dashboard Sections

The Agent Performance Digital Report is split into various sections which provides actionable insights about Agents Performance.

  • Overall: This section provides an overview of key agent performance metrics, including the number of assignments, response count, first response time, average response time, and average handling time.

  • Live Chat: This section provides detailed insights into the performance and effectiveness of live chat interactions. It typically includes metrics such as Number of Assignments, Response Time, First Response Time, Response Time Excluding First Response Time, Average Handling Time.

  • Social: This section provides detailed insights into the performance and effectiveness of cases handled through social media channels. It typically includes metrics such as Number of Assignments, Response Time, First Response Time, Response Time Excluding First Response Time, Average Handling Time.

  • Email: This section provides detailed insights into the performance and effectiveness of cases handled through Emails.

  • Assignment Raw Dump: The Assignment Raw Dump section displays detailed records, where each row represents an individual case assignment to an agent.

Let’s try and understand the various metrics in detail:

This report is split into 2 different types of reports:

  • Interval Split Summary: An Interval Split Summary Report breaks down data or performance metrics into specific time intervals, offering a concise summary for each period. This report helps identify trends and patterns by organizing data into segments like hourly, daily, or weekly intervals, making it easier to analyze and compare performance over time.

  • Channel Split Summary: The dashboard includes a "Channel Split Summary" section, offering a detailed breakdown of metrics by channel. Since agents handle cases across various platforms (e.g., live chat, social media, email), selecting the dropdown provides an in-depth view of performance for each channel.

Let’s understand the various metrics in detail:

Name 

Definition 

Agent

The sprinklr user for whom the report is being generated.

Intercations Assigned

Measures number of times a particular case has been assigned to the agent.

Interactions Assigned with Brand Response

Measures number of times a particular case that has been assigned to the agent has been responded.

Response Count

Count of unique responses sent by the agent corresponding to the brand response received on the case. Eg: If the messages are in the sequence: F1 F2 B1 B2 F3 B3, then total response count will be 2 in this scenario as B1 will be counted as a response to F1 and B3 will counted as a response to F3

Average of First Response Time

Measures the duration of first agent response that was sent on the case after every assignment to the queue from either agent assignment time or last un responded customer message on the case as per values selected in "Standard Metrics Screen".

Average of Response Time Excluding First

Measures next response time made by the agent excluding the time taken to respond the first response).

Average of Response Time

Measures the duration of overall responses that was sent on the case by the agent during that assignment. This excludes auto responses, auto imports and surveys.

Average of Handle Time (Assigned Duration)

Depicts the total time a case was assigned to the agent. It will show the assigned duration based on each agent assignment.


The metrics mirror those found in the Overall Section. Refer to Overall section to know the definition of metrics.

Let's have a look at various metrics:

Metrics

Dimensions

Agent

The sprinklr user for whom the report is being generated.

Interactions Assigned

Measures number of times a particular case has been assigned to the agent.

Interactions Assigned with Brand Response

Measures number of times a particular case that has been assigned to the agent has been responded.

Response Count

Count of unique responses sent by the agent corresponding to the brand response received on the case. Eg: If the messages are in the sequence: F1 F2 B1 B2 F3 B3, then total response count will be 2 in this scenario as B1 will be counted as a response to F1 and B3 will counted as a response to F3.

Avg. of First Response Time

Measures the duration of first agent response that was sent on the case after every assignment to the queue from either agent assignment time or last un responded customer message on the case as per values selected in "Standard Metrics Screen".

Avg. of Response Time Excluding First

Measures next response time made by the agent excluding the time taken to respond the first response).

Avg. of Response Time

Measures the duration of overall responses that was sent on the case by the agent during that assignment. This excludes auto responses, auto imports and surveys.

Avg. of Handle Time (Assigned Duration)

Depicts the total time a case was assigned to the agent. It will show the assigned duration based on each agent assignment

The metrics mirror those found in the Overall section. Refer to Overall section to know the definition of metrics.

Let's look at the metrics:

Metrics

Description

Agent

The sprinklr user for whom the report is being generated.

Interactions Assigned

Measures number of times a particular case has been assigned to the agent.

Interactions Assigned with Brand Response

Measures number of times a particular case that has been assigned to the agent has been responded.

Response Count

Count of unique responses sent by the agent corresponding to the brand response received on the case. Eg: If the messages are in the sequence: F1 F2 B1 B2 F3 B3, then total response count will be 2 in this scenario as B1 will be counted as a response to F1 and B3 will counted as a response to F3.

Average of First Response Time

Measures the duration of first agent response that was sent on the case after every assignment to the queue from either agent assignment time or last un responded customer message on the case as per values selected in "Standard Metrics Screen".

Average of Response Time Excluding First

Measures next response time made by the agent excluding the time taken to respond the first response).

Average of Response Time

Measures the duration of overall responses that was sent on the case by the agent during that assignment. This excludes auto responses, auto imports and surveys.

Average of Handle Time (Assigned Duration)

Depicts the total time a case was assigned to the agent. It will show the assigned duration based on each agent assignment.

Let's look at the various metrics:

Let's have a look at the report now:

  • Interval Split Summary: An Interval Split Summary Report breaks down data or performance metrics into specific time intervals, offering a concise summary for each period. This report helps identify trends and patterns by organizing data into segments like hourly, daily, or weekly intervals, making it easier to analyze and compare performance over time.

    Note: Metrics would be like Overall report.

    Metrics

    Description

    Agent

    The sprinklr user for whom the report is being generated.

    Interactions Assigned

    Measures number of times a particular case has been assigned to the agent.

    Interactions Assigned with Brand Response

    Measures number of times a particular case that has been assigned to the agent has been responded.

    Response Count

    Count of unique responses sent by the agent corresponding to the brand response received on the case. Eg: If the messages are in the sequence: F1 F2 B1 B2 F3 B3, then total response count will be 2 in this scenario as B1 will be counted as a response to F1 and B3 will counted as a response to F3.

    Average of First Response Time

    Measures the duration of first agent response that was sent on the case after every assignment to the queue from either agent assignment time or last un responded customer message on the case as per values selected in "Standard Metrics Screen".

    Average of Response Time Excluding First

    Measures next response time made by the agent excluding the time taken to respond the first response).

    Average of Response Time

    Measures the duration of overall responses that was sent on the case by the agent during that assignment. This excludes auto responses, auto imports and surveys.

    Average of Handle Time (Assigned Duration)

    Depicts the total time a case was assigned to the agent. It will show the assigned duration based on each agent assignment.

Reassigned cases are listed as separate entries, allowing for detailed tracking of assignments and agent actions.

It captures additional details beyond those in the Overall Section, such as:

Name 

Definition 

Date

Date on which event occurred.

Agent

The sprinklr user for whom the report is being generated.

Case Number 

A unique identifier assigned to each case for tracking and reference purposes.  

Case Details 

Descriptive information about the case, including the nature of the issue or request being handled.  

Case Creation Time 

The exact date and time when the case was created or logged into the system.  

Channel

Provides the name of the channel that is associated to the case at the time of the particular action. Once the channel is changed, any action done on the case post that will be reported against the changed channel name i.e it will indicate the snapshot channel associated to the case.

Agent Assign Time 

Date Time stamp when the particular case was assigned to the agent. In case multiple agents were assigned, it will show timestamp for each of those agent assignments.

Assignment Method 

Indicates if the agent assignment was a manual, queue or direct assignment.

Interactions Assigned

Measures number of times a particular case has been assigned to the agent.

Interactions Assigned with Brand Response

Measures number of times a particular case that has been assigned to the agent has been responded.

Response Count

Count of unique responses sent by the agent corresponding to the brand response received on the case. Eg: If the messages are in the sequence: F1 F2 B1 B2 F3 B3, then total response count will be 2 in this scenario as B1 will be counted as a response to F1 and B3 will counted as a response to F3.

Average of First Response Time

Measures the duration of first agent response that was sent on the case after every assignment to the queue from either agent assignment time or last un responded customer message on the case as per values selected in "Standard Metrics Screen".

Average of Response Time

Measures the duration of overall responses that was sent on the case by the agent during that assignment. This excludes auto responses, auto imports and surveys.

Average of Handle Time (Assigned Duration)

Depicts the total time a case was assigned to the agent. It will show the assigned duration based on each agent assignment.

Manage Dashboard

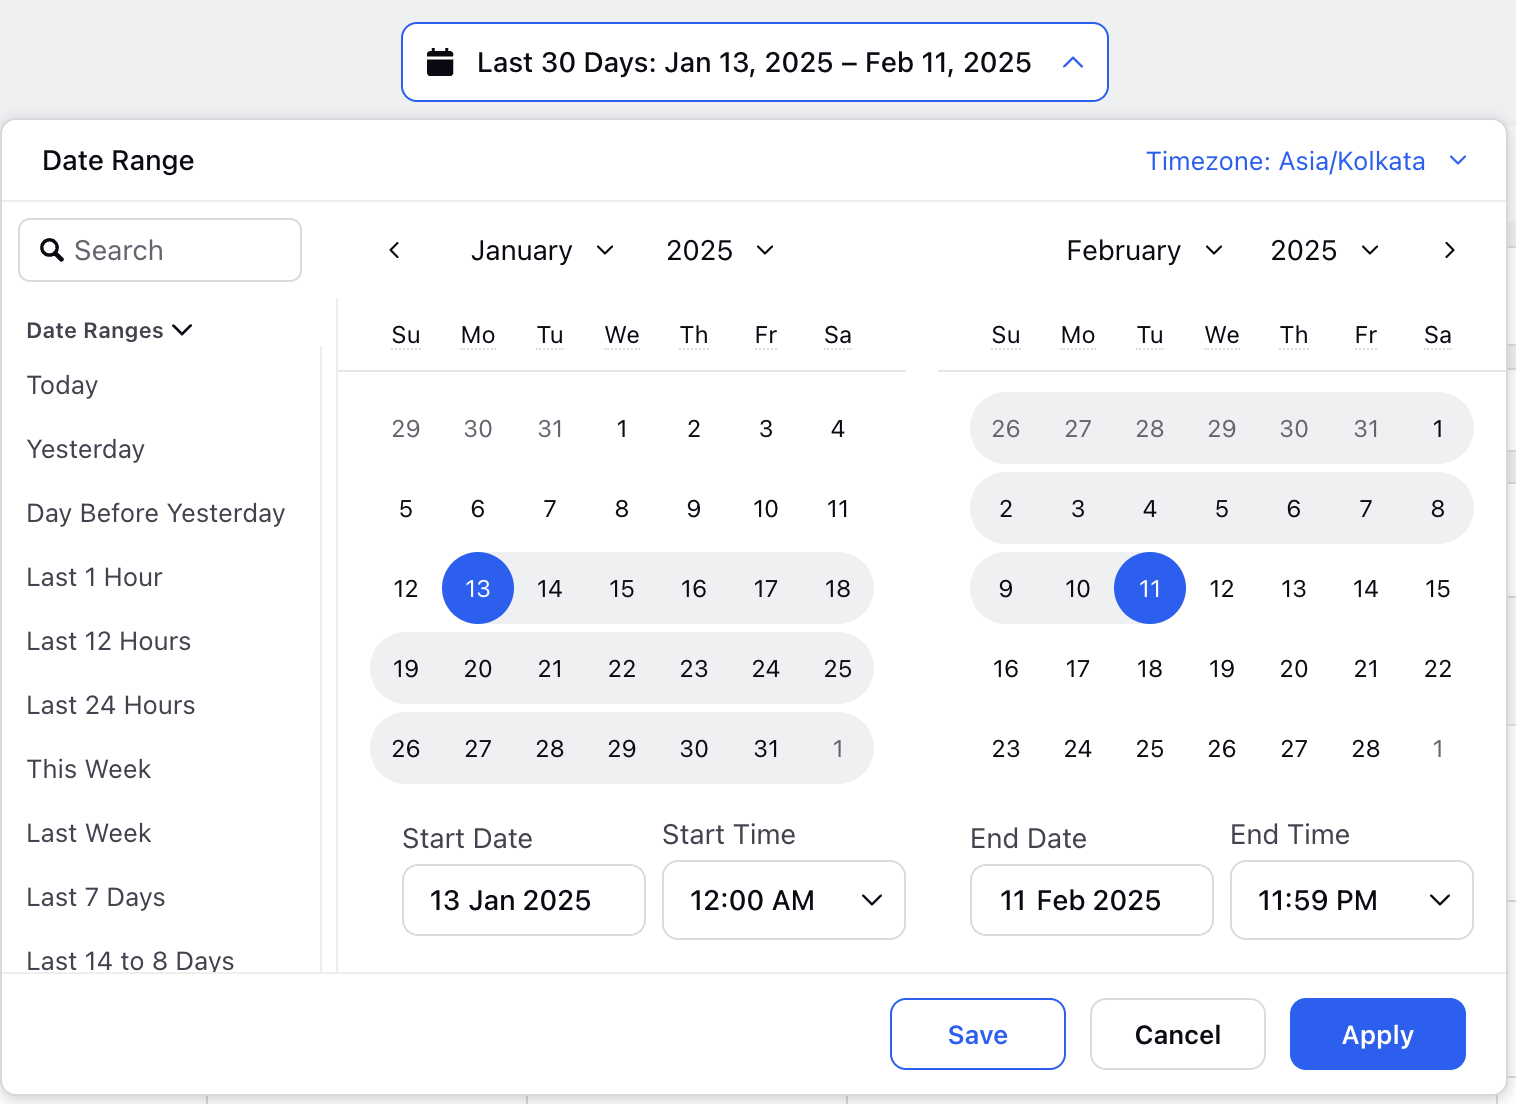
  • Date Range Section: A date range selector allows you to choose the period for viewing data. You can customize the range by setting a start and end date, or select from options like today, this week, last 7 days, last 30 days, last 60 days, last month, last year, or lifetime.