Refining surveys using AI-powered Survey Quality Score

Updated 

The Smart Survey Reviewer in Sprinklr Surveys helps users spot and resolve potential issues in their surveys. It analyzes the survey’s structure, assigns a Survey Quality Score, and highlights areas for improvement. Issues are categorized by severity: Low, Medium, Severe, or Passed by providing clear, actionable feedback to ensure surveys are well-designed and engaging for respondents.

The Smart Survey Reviewer is a powerful tool for ensuring high-quality feedback and minimizing drop-off rates. It is specifically designed for Customer Experience professionals, product managers and digital leads as it provides a structured way to improve survey design, elevate the respondent experience and drive stronger business results.

Business Problems Solved

  • Maximises Survey Response: The AI-Powered Survey Quality Score helps identify areas of opportunity in a survey and provides feedback to improve it, maximizing responses.

    Example: A customer experience manager seeks to understand why survey completion rates are low. Using a survey review tool, they identify confusing questions flagged as high-severity issues and apply recommended changes to improve clarity. These adjustments lead to higher completion rates and more meaningful insights for the team.

  • Streamline Surveys to Sharpen Insights: The AI-Powered Survey Quality Score helps improve surveys by identifying and addressing issues such as redundancy, poor question structure, and outdated phrasing, ensuring your surveys are clear, effective, and up to date.

    Example: Product teams use survey review tools to refine beta-test surveys by addressing redundancy and unclear wording. This helps ensure smoother feedback collection and more accurate data, leading to better-informed product decisions before launch.

Enhances survey quality and respondent experience by identifying and resolving potential issues, optimizing flow and structure, and ensuring high-quality feedback before distribution.

Prerequisites

You will need View, Edit and Delete permissions at the Program Level to access Survey Logics:

  • View: Helps to view the feature.

  • Edit: Helps to edit the feature.

  • Delete: Helps to delete the feature.

Navigation Steps

Access Survey Quality Score

Hover over the Survey Quality Score in the top-right corner of the Survey Builder page to view detailed insights.

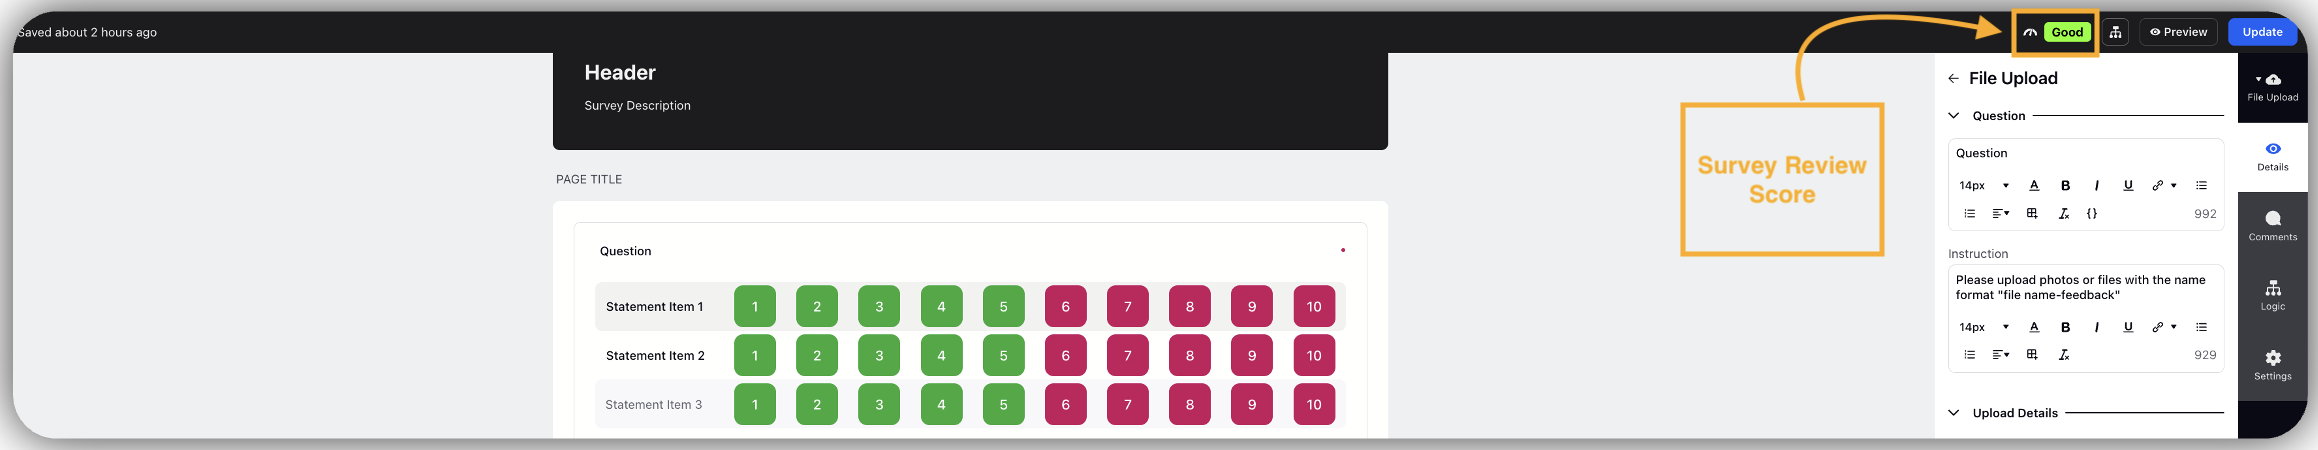
Access Survey Smart Reviewer

  • Click Survey Quality Score button.

  • The resulting modal is called the Survey Smart Reviewer, which provides an intelligent overview of your survey to help identify potential improvements before launch. Scroll up and down to view highlighted issues.
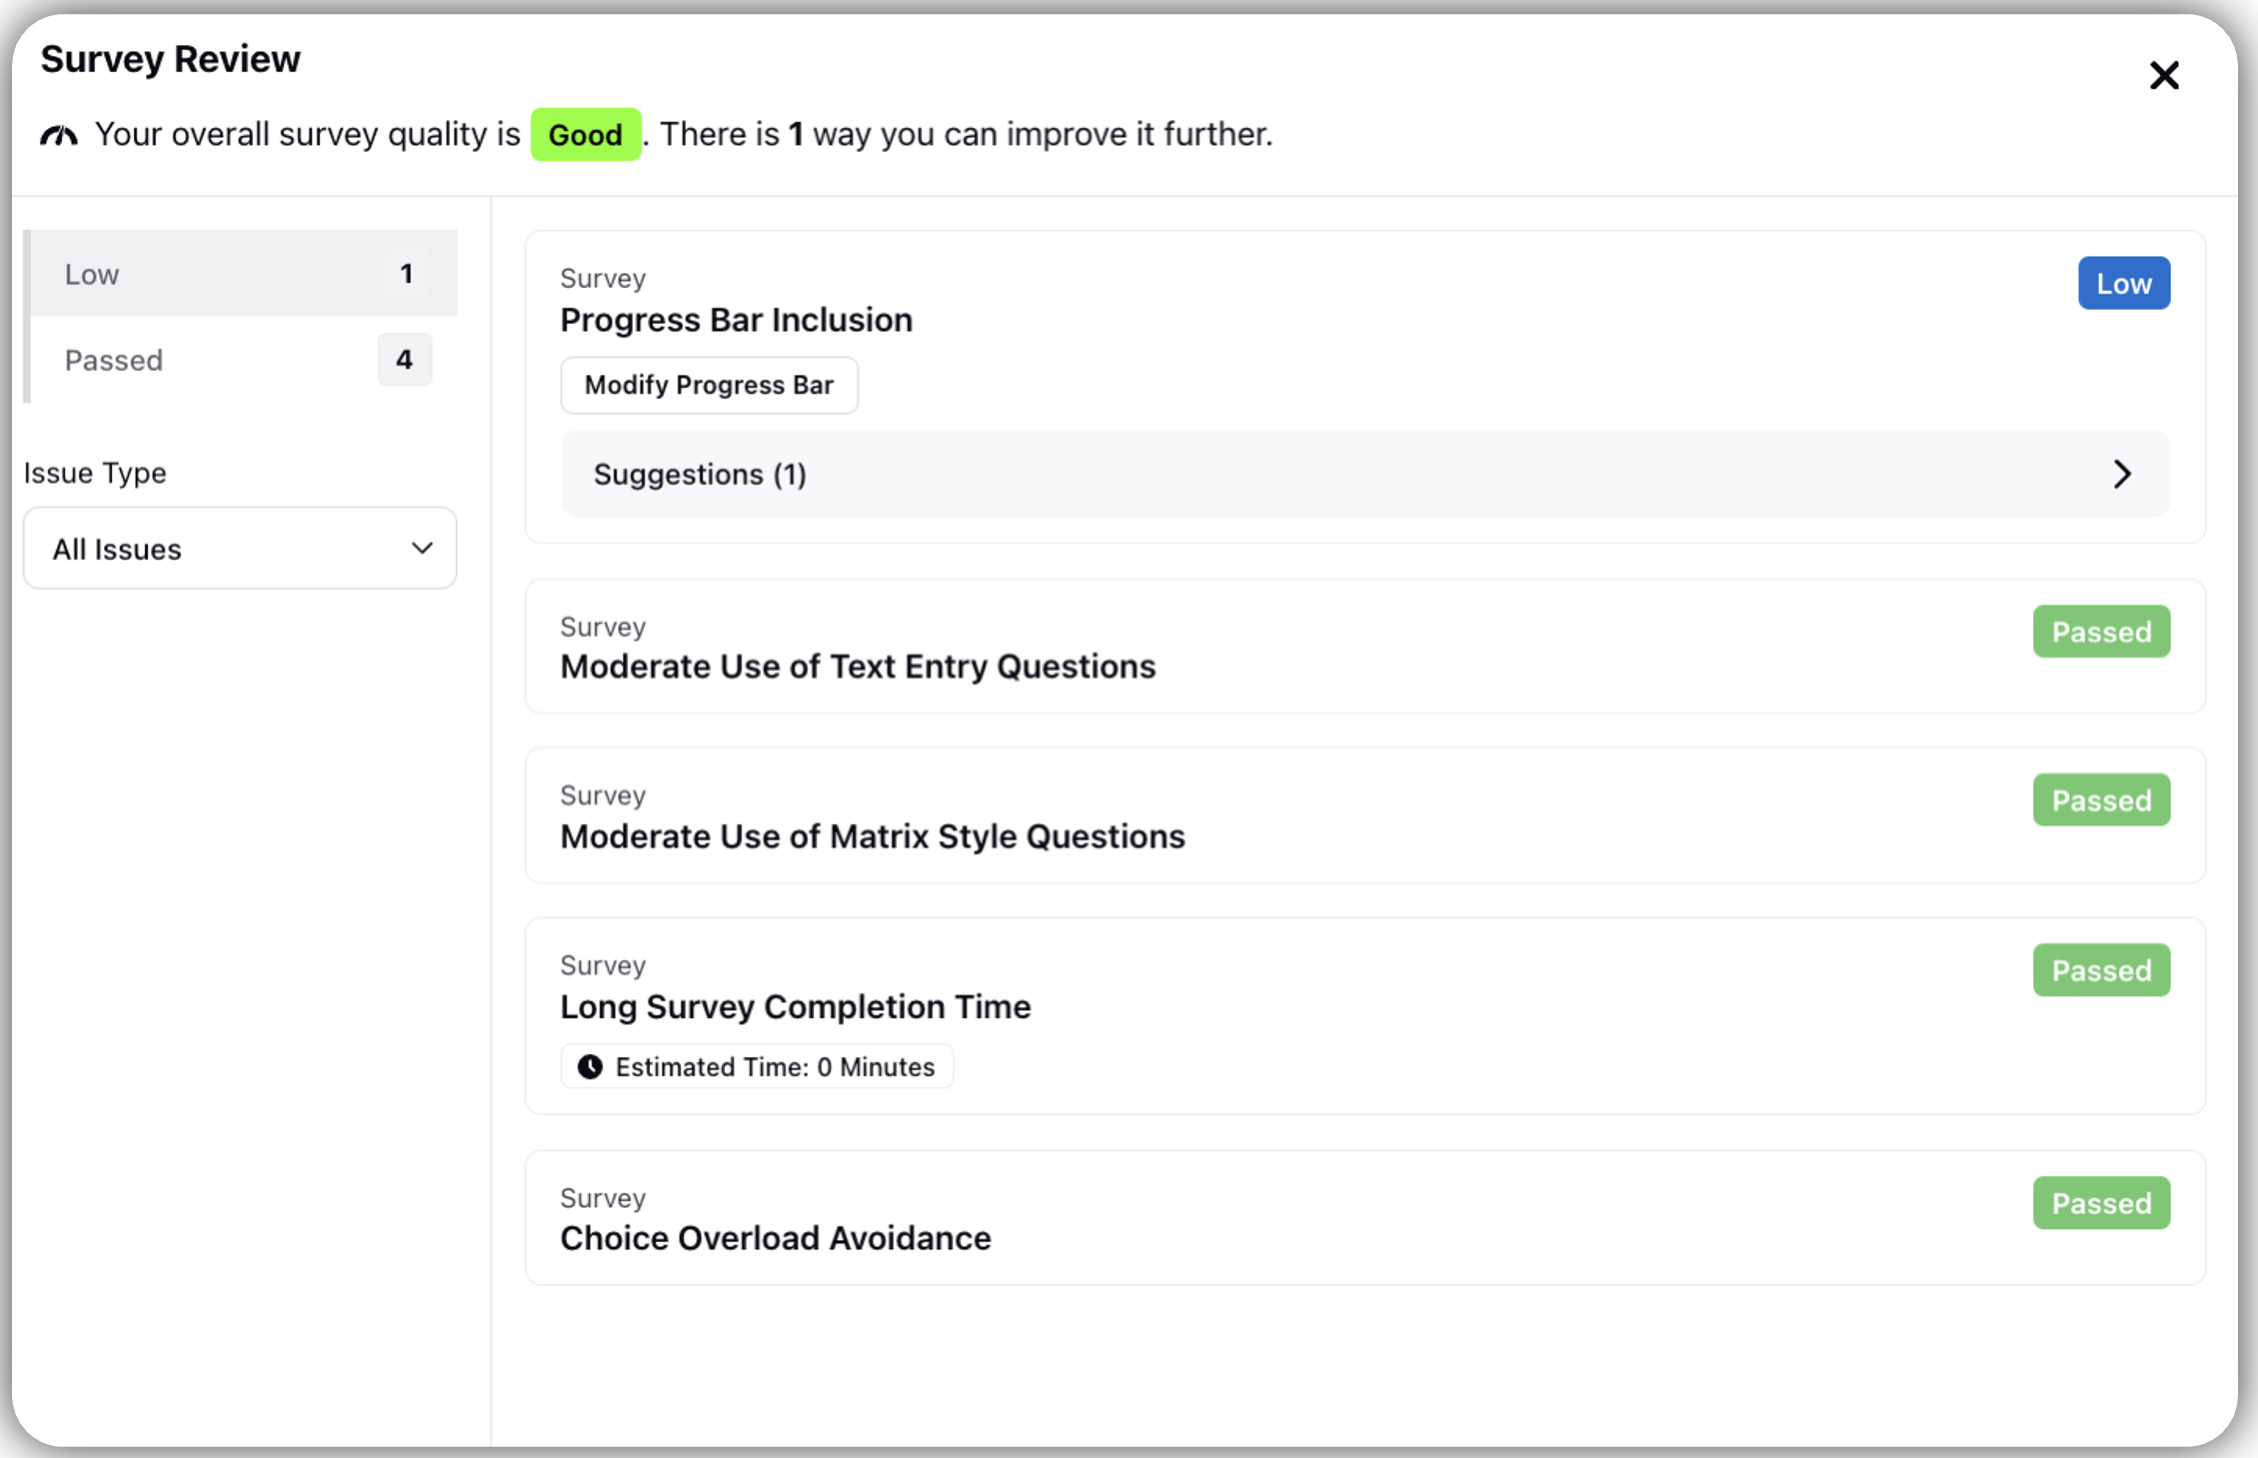
Issue Card

Each highlighted issue with the survey shows up as an Issue Card. Every Issue Card has:

  1. Issue Description: Explains the issue in detail.

  2. Issue magnitude indicator: Indicates severity of the detected issue.

    There are 4 possible levels, that includes:

    1. Low

    2. Medium

    3. Severe

    4. Passed

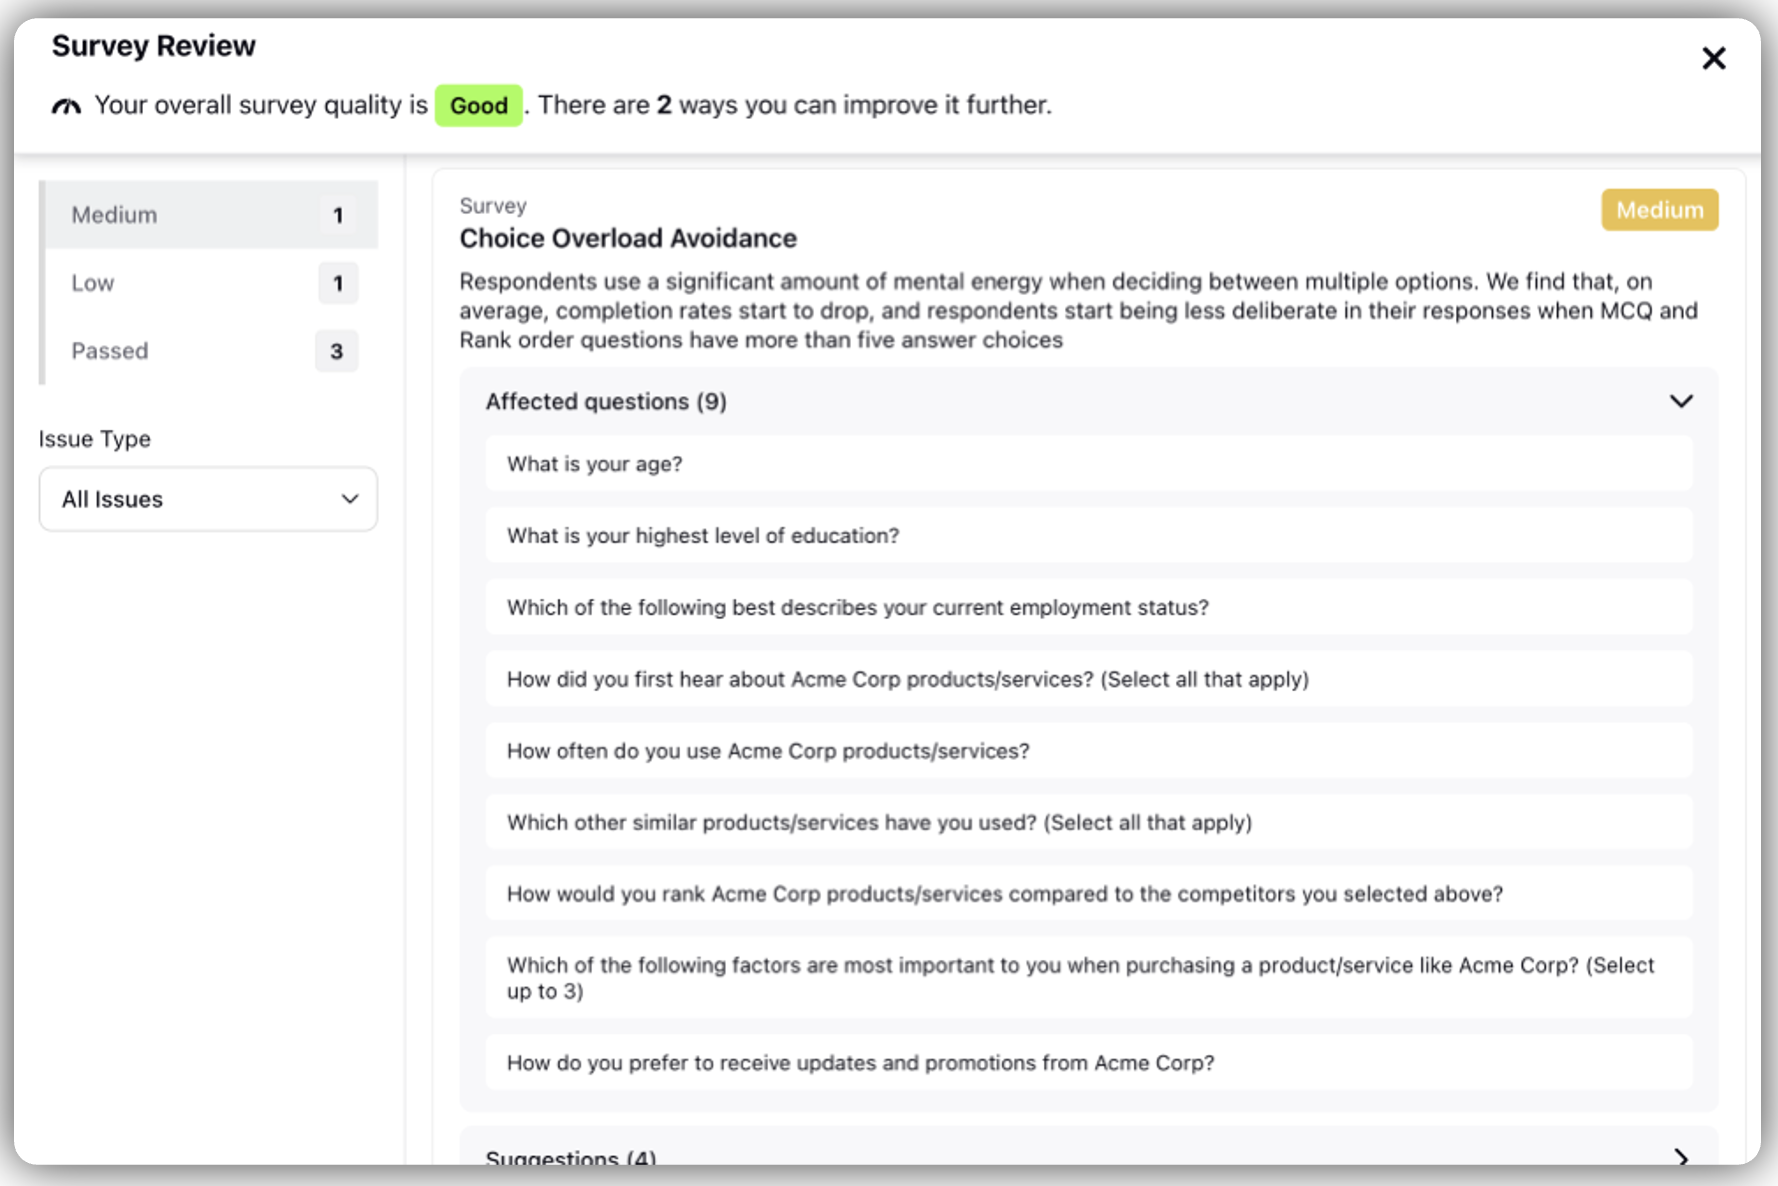
  3. Affected questions dropdown tab: Indicates the count of questions that are affected by an issue.

    Navigation

    1. Go to Survey Builder.

    2. Click Drop down of Affected Question.

    3. Click Question of Interest to be redirected to the question in the builder.

    4. You can use this to quickly make the suggested edits to the relevant question.

  4. Suggestion Dropdown Tab: Gives some possible measures that can be taken to improve the survey.

    Note: Use the Suggestions Dropdown Tab for actionable guidance on resolving specific problems.

    Navigation

    1. Click Suggestions Drop Down Tab to view all possible suggestions.

Survey Issues

The Smart Survey Reviewer currently monitors seven distinct types of survey issues. Below is a summary outlining each issue type, the possible magnitudes of those issues (referred to as Issue Criticality)and how the criticality level is determined for each:

Survey Issue Heading 

Criticality Measures 

Issue Explanation 

Issue Suggestions 

Criticality Criteria 

Use verbal labels for rating questions 

Passed, Low, Medium, Critical 

Respondents find it hard to infer the meaning of a rating scale if abstract numbers are used as labels. We find that, on average, completion rates start to drop, and respondents start being less deliberate in their responses when they feel that questions are ambiguous. 

Consider using verbal labels in rating questions in order to eliminate ambiguity about scale meaning 

1.)Pass if the number of affected questions is 0 
2.)Low if the number of affected questions is 1 
3.)Medium if the number is 2 or 3 
4.)Critical if the number is greater than 3 

Clear and Concise Language 

Passed, Low, Medium, Critical 

Dynamically flags issues around spelling and grammar, tone, profanity, clarity of questions, unnecessary length of questions 

Specific to questions 

1.)Pass if number of affected questions is less than or equal to 2 
2.)Low if number of affected questions is between 3 and 5 
3.)Medium if number of affected questions is between 5 and 8 
4.)Critical if number of affected questions is greater than 8 

Moderate use of text entry questions 

Passed, Low, Medium, Critical 

Respondents use a significant amount of mental energy when writing text. We find that, on average, completion rates start to drop, and respondents start writing far less in their responses when a survey has more than three open-text areas. 

1.)Consider deleting text boxes if they are not very necessary at a particular place 
2.)Consider using simple, straight forward, easy-to-answer question text to increase the likelihood of them being answered 
3.)Consider ensuring that the majority of the text entry questions are not response-required questions 
4.)Consider converting them into other question types if possible, reducing the cognitive load for the respondent. Example: Instead of asking “What is your age?” as a Text Entry question, a drop down can be asked, with different age categories the respondent might belong to) 

1.)Pass if number of text entry questions less than or equal to 2 
2.)Low if number of text entry questions between 3 and 5 
3.)Medium if the number of text entry questions between 5 and 8 
4.)Critical if the number of text entry questions greater than 8 

Choice Overload Avoidance 

Passed, Low, Medium, Critical 

Respondents use a significant amount of mental energy when deciding between multiple options. We find that, on average, completion rates start to drop, and respondents start being less deliberate in their responses when MCQ and Rank order questions have more than five answer choices. 

1.)Consider deleting answer choices if they are not very necessary 
2.)Consider combining two answer choices if they address very similar concerns 
3.)If all answer choices look equally important, consider breaking down the question into two smaller questions 
4.)Use simple, straight forward, easy-to-answer question text to increase the likelihood of them being answered  

For the number of MCQ questions in a survey with more than 5 answer choices: 
1.)Pass if number of all such MCQ questions is less than or equal to 4 
2.)Low if number of all such MCQ questions is 5 or 6 
3.)Medium if the number of all such MCQ questions is 7 or 8 
4.)Critical if the number of all such MCQ questions is greater than 8 

Moderate use of matrix style questions 

Passed, Low, Medium, Critical 

Research has shown that response quality and completion rates both decline when questions use the matrix format. We’ve detected that the number of matrix rows contained in your survey may negatively impact the quality of data that you collect. 

1.)Consider simplifying possible responses (for example: Strongly Disagree, Disagree, Neutral, Agree, Strongly Agree could be simplified to Disagree, Neutral, Agree). 
2.)Consider using separate multiple-choice questions where applicable, and try to keep matrix tables to a minimum. 

1.)Pass if number of matrix questions less than or equal to 2 
2.)Low if number of matrix questions between 3 and 5 
3.)Medium if the number of matrix questions between 5 and 8 
4.)Critical if the number of matrix questions greater than 8 

Progress Bar Completion 

Passed, Low 

Gives dynamic suggestions depending on when the Progress Bar is enabled or not, and the survey length.  

1.)In case progress bar SHOULD be added but it is currently disabled: 
a.)For medium-sized surveys, a respondent is more likely to get eager to know how much progress they have already made in completing the survey. A progress bar gives them a hint about the percentage of the study that has already loaded. Consider adding a progress bar to make it easier for the respondent to visualize their progress in the survey 
2.)In case progress bar SHOULD NOT be added but it is currently enabled: 
a.)While a progress bar can be a helpful indicator to survey respondents, research indicates that for very short or very long surveys, or for surveys that use extensive skip logic, adding a progress bar can be counterproductive as it can lead to inconsistent progress bar behaviour. Consider disabling the progress bar to make your respondents' survey experience better 

Details given in the attached ticket 

Long Survey Completion Time 

Passed, Low, Medium, Critical 

According to our research, surveys that are longer than six minutes (or three minutes on a mobile device) begin to experience significant respondent drop-off. While lengthy surveys have their place, we always advise looking for methods to shorten your surveys to improve survey completion rates. 

1.)Consider deleting unimportant questions 
2.)Consider avoiding Textbox questions (Instead of asking respondent to enter age, MCQ with age groups can be used) 
3.)Consider using less Matrix questions (Breaking down matrix questions to multiple MCQ’s reduces the time taken) 

1.)Pass for survey duration less than 6 minutes 
2.)Low for survey duration between 6 and 8 minutes 
3.)Medium for survey duration between 8 and 12 minutes 
4.)Critical for survey duration above 12 minutes 


Issue Magnitude Sort

Smart Survey Reviewer automatically sorts the various Issue Cards by severity.

Navigation

  1. Click Specific Issue Magnitude to view issue cards of specific issue magnitude in the sorting tab ( in the left column on the Survey Smart Reviewer page).

Note: No Survey Review Score is shown for a newly created survey before any questions are added.

Review and resolve issues with severe magnitudes first to improve survey quality.

Best Practices

  • Prioritize reviewing and resolving high-severity issues first to ensure optimal survey quality.

  • Use the Suggestions dropdown tab to access actionable guidance for resolving specific issues within your survey.

  • The suggestions provided are designed to support you with guidance rooted in industry best practices. However, since every organization is unique, we recommend reviewing and validating each recommendation to ensure it aligns with your specific goals and context before implementing any changes.

FAQs

No, the severity levels are predefined within the system and cannot be modified.