Cross Tab widget
Updated
Use Cross Tab Widget to see the Interaction between two dimensions.
In a Listening dashboard, you can add different widgets (visualization types) to visualize data for multiple metrics in real time, and Cross Tab is one of them. By adding this widget to your dashboard, you can see the interaction of two dimensions in a table matrix, where each cell displays a value associated with a dimension pairing. The Cross Tab widget can provide a better understanding of the relationship between two widgets like "Time of Day and Day of Week" or "Country and Language".
To Create a Cross Tab widget
The Cross Tab widget can be plotted in any custom Reporting dashboard, depending on permissions. To get started, you can use any existing editable dashboard or create a new one. Refer to this article to learn how to set up a custom dashboard.
Once you have the dashboard where you want to add the visualization widget, follow the steps below –
On the custom dashboard, click Add Widget in the top right corner.

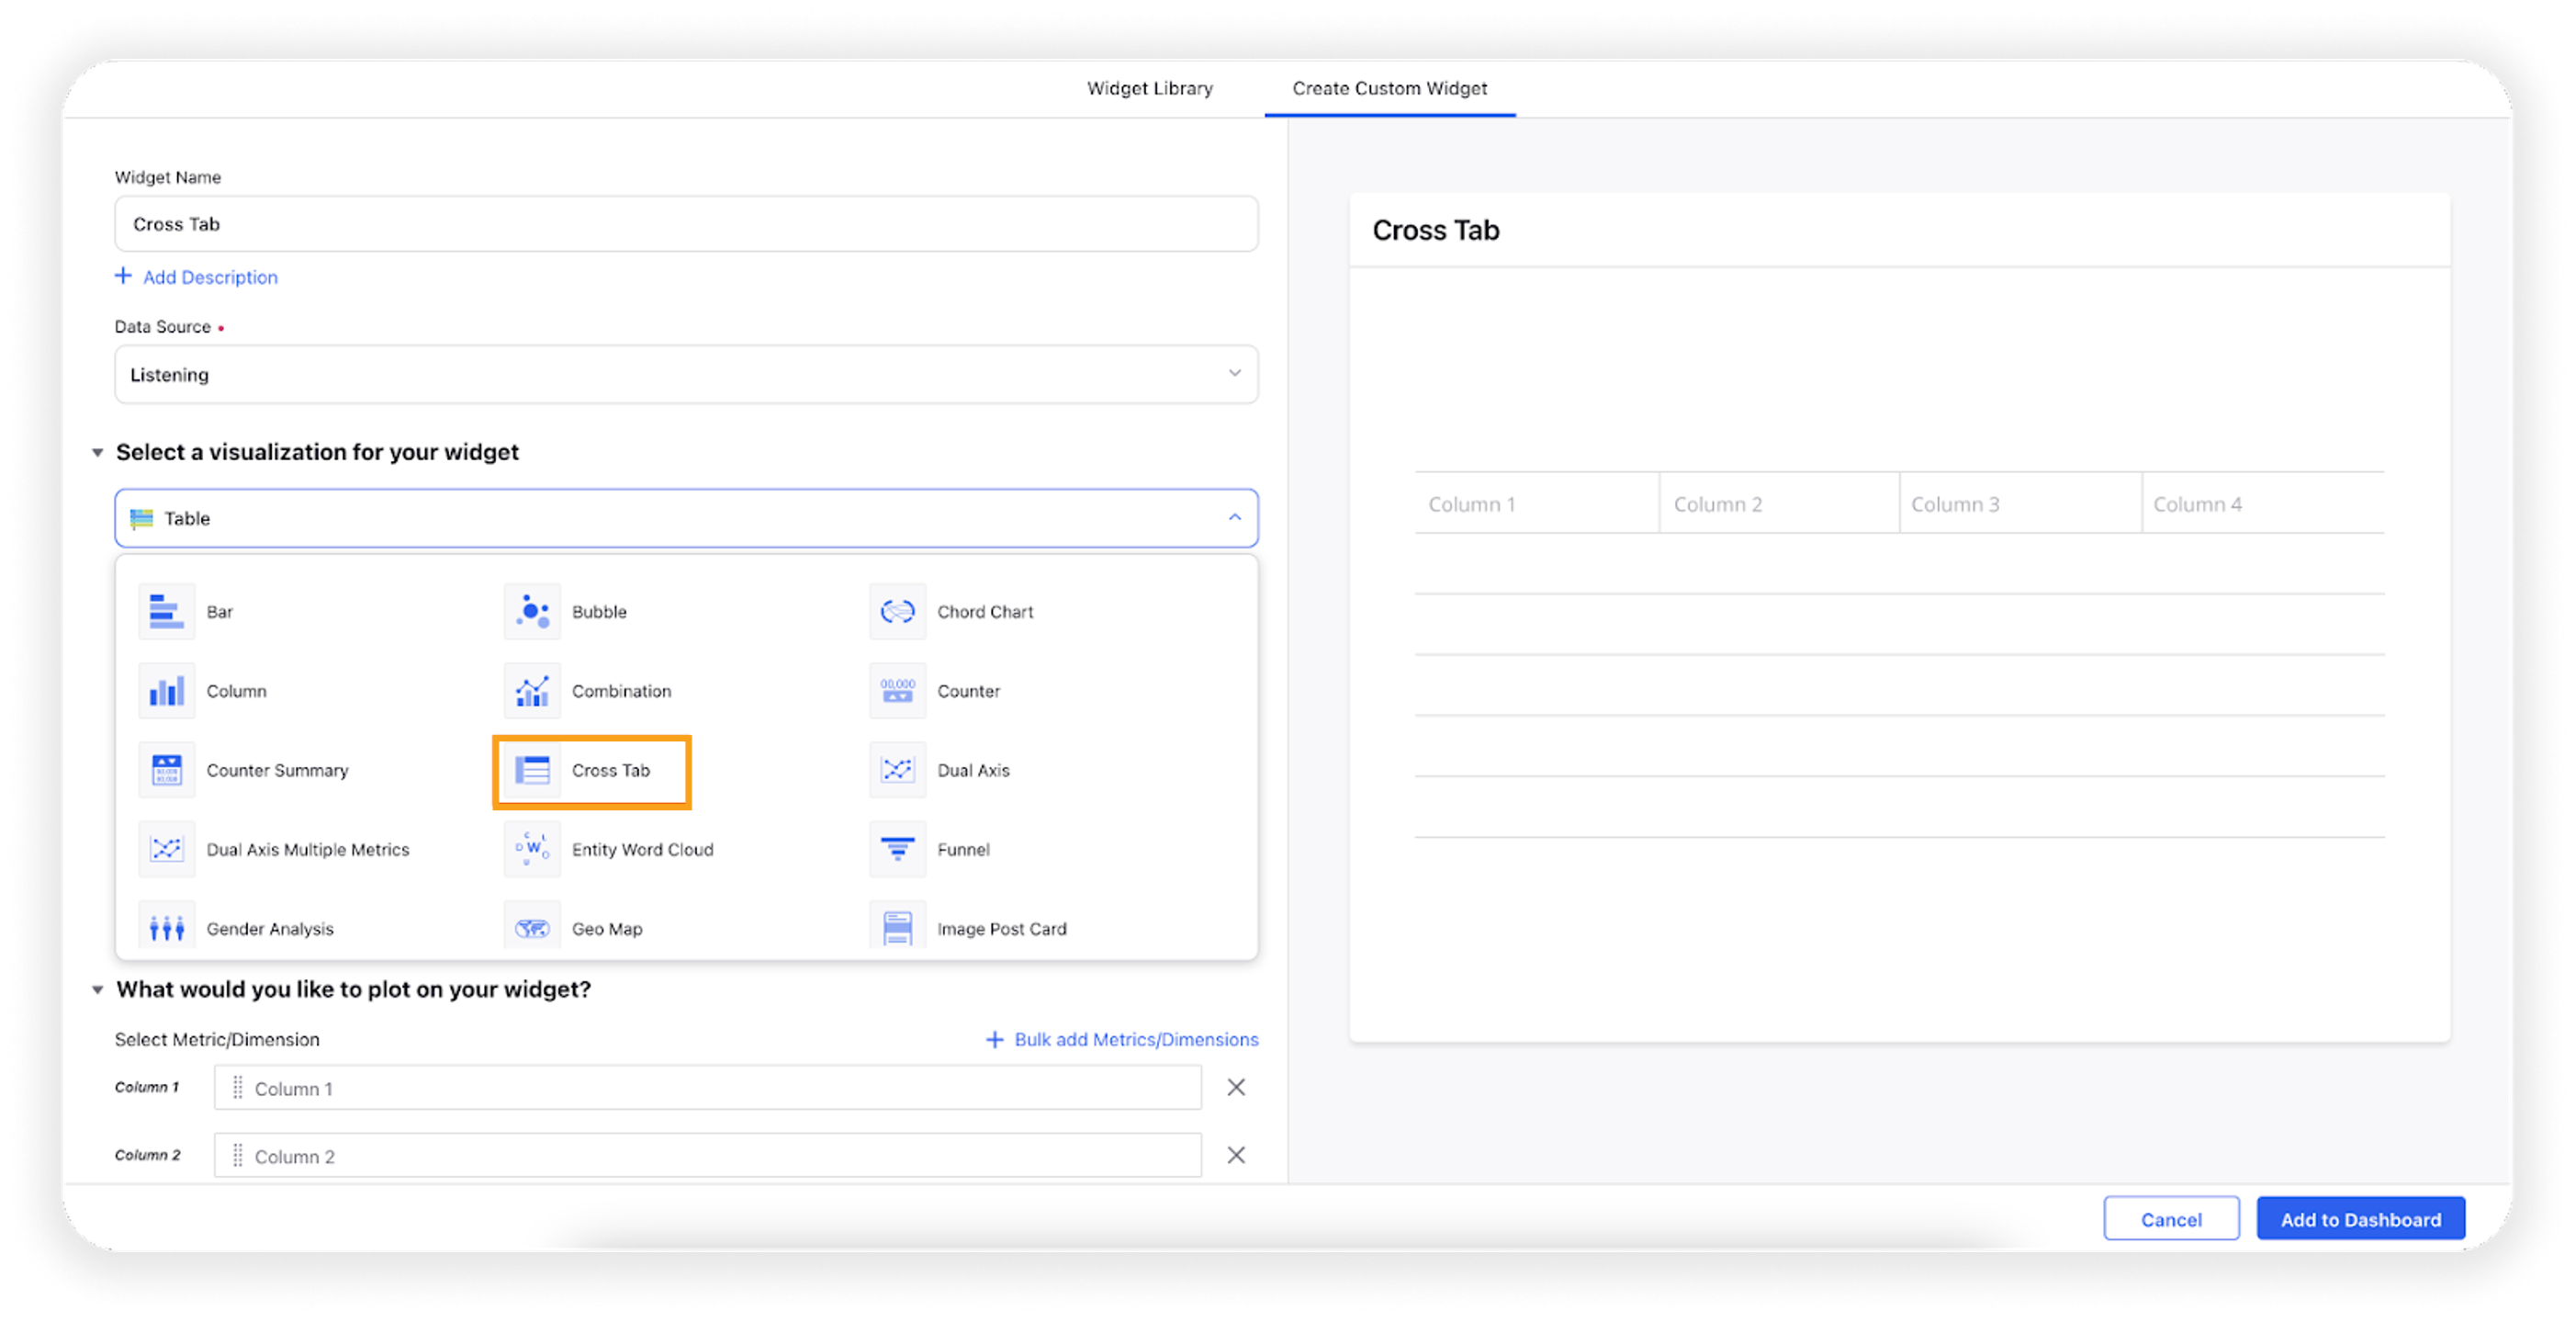
On the widget builder, enter the widget's name.
Select Cross Tab as a visualization type for your widget.
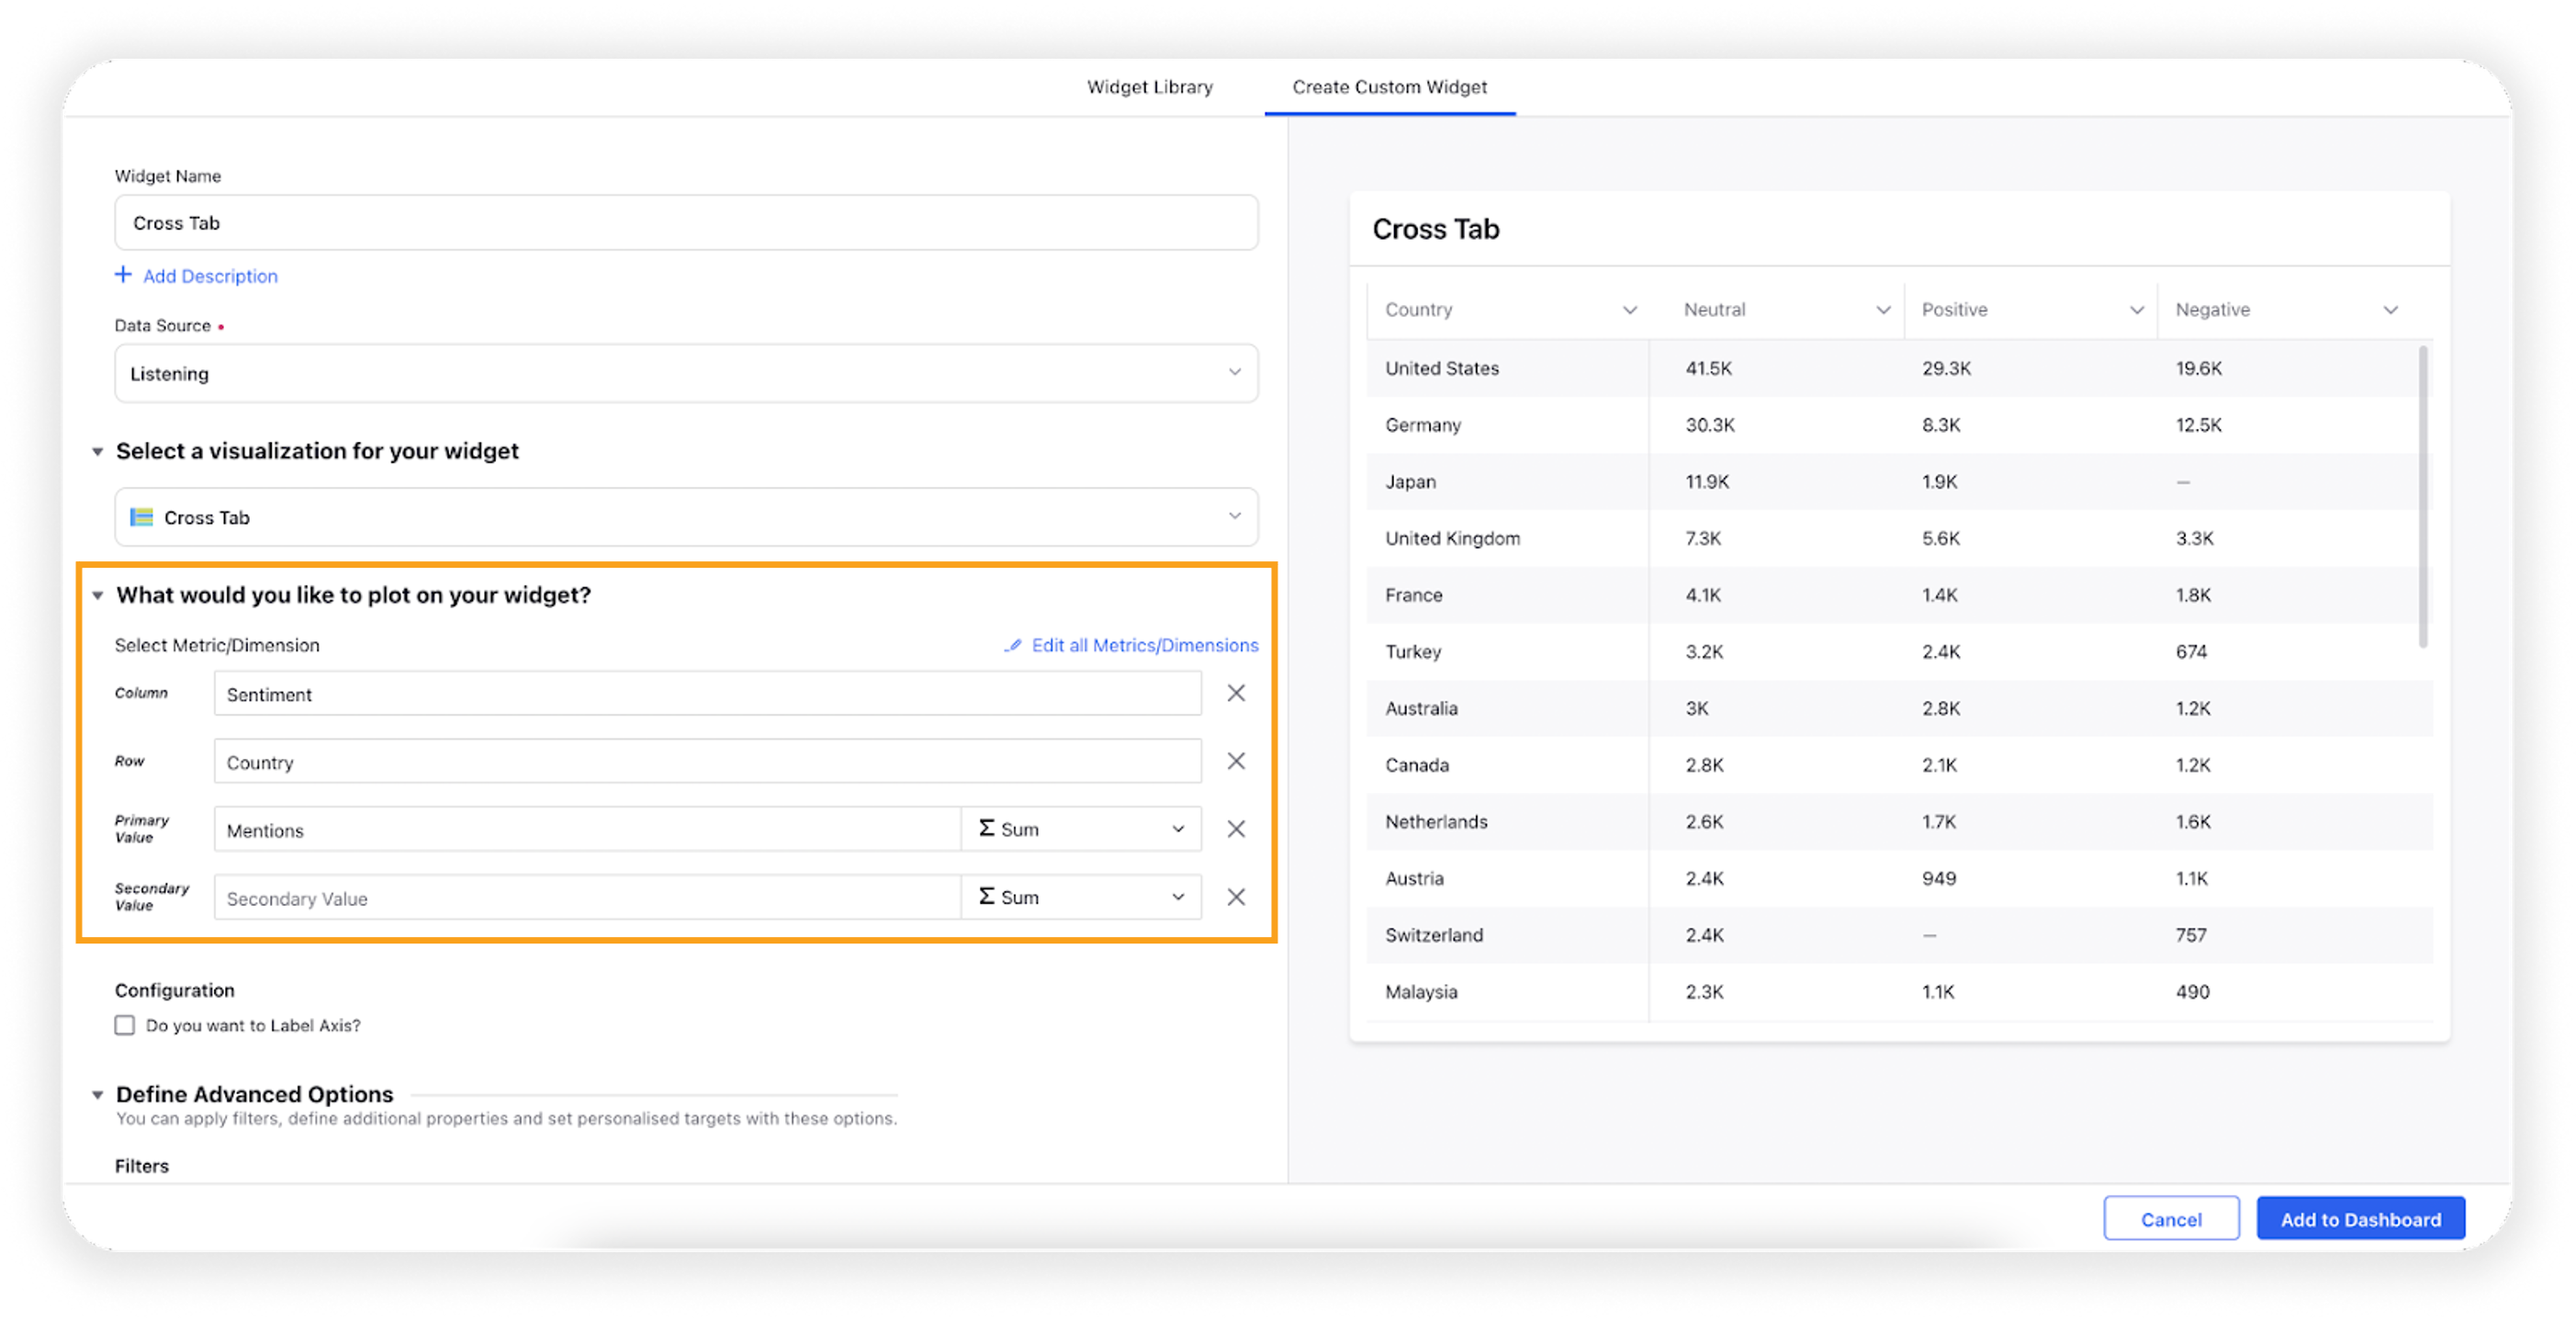
Under the What would you like to plot on your widget section, select two initial dimensions in the Column and Row fields. These two dimensions will be displayed in the Cross Tab visualization in relation to one another.
Provide a metric in the Primary Value field by which you want to measure these dimensions. The metric Mentions is commonly used in this field and will provide the number of mentions for each cross-section of the dimensions you have selected.
Optionally, you can select a second measurement in the Secondary Value field.
Select the configuration options as desired.
Configuration Option
Action
Do you want to Label Axis?
If you want to add names for your Metrics, you can select this configuration option, and then you can enter the desired names as labels.
Under the Defined Advanced Options section, you can apply filters, define additional properties and set personalized targets with these options.
Click Add to Dashboard on the bottom right corner to create your new widget.
Configuration option
After adding the widget, it will be shown on the Listening dashboard, where you can see the interaction of two dimensions in a table matrix. Each cell displays a value associated with a dimension pairing.

Export the Cross Tab widget
You can download your Cross Tab widget's information in various formats – PDF, PNG, Excel, and CSV. To do that, click the Options icon on the Cross Tab widget, and hover over to Export Widget to see the available options.
Apart from the above options, you can also export the Cross Tab widget as an Excel pivot table.
Enablement note: To learn more about getting the New Export Support for the Cross Tab widget enabled in your environment, please work with your Success Manager.