Alerts in Reporting
Updated
Alerts are automated notifications triggered by specific conditions, thresholds, or detected anomalies within a system or dataset. They are designed to keep you informed in real time about important changes, potential issues, or critical events. By providing timely updates, alerts enable you to respond quickly, make informed decisions, and take corrective actions before problems escalate. This helps ensure system reliability, improves operational efficiency, and supports proactive monitoring.
In the Sprinklr Reporting module, you can set up alerts for specific widgets to stay on top of important metrics. For example, if there's a drop in CSAT, a spike in case volume, or a breach of SLA, Sprinklr will automatically send you an alert. You'll receive the notification through email or in-platform messages, so you or your team can respond quickly and take the necessary action.
Types of Alerts
Sprinklr Reports currently supports Custom Alerts, allowing you to define specific conditions and thresholds tailored to your reporting requirements.
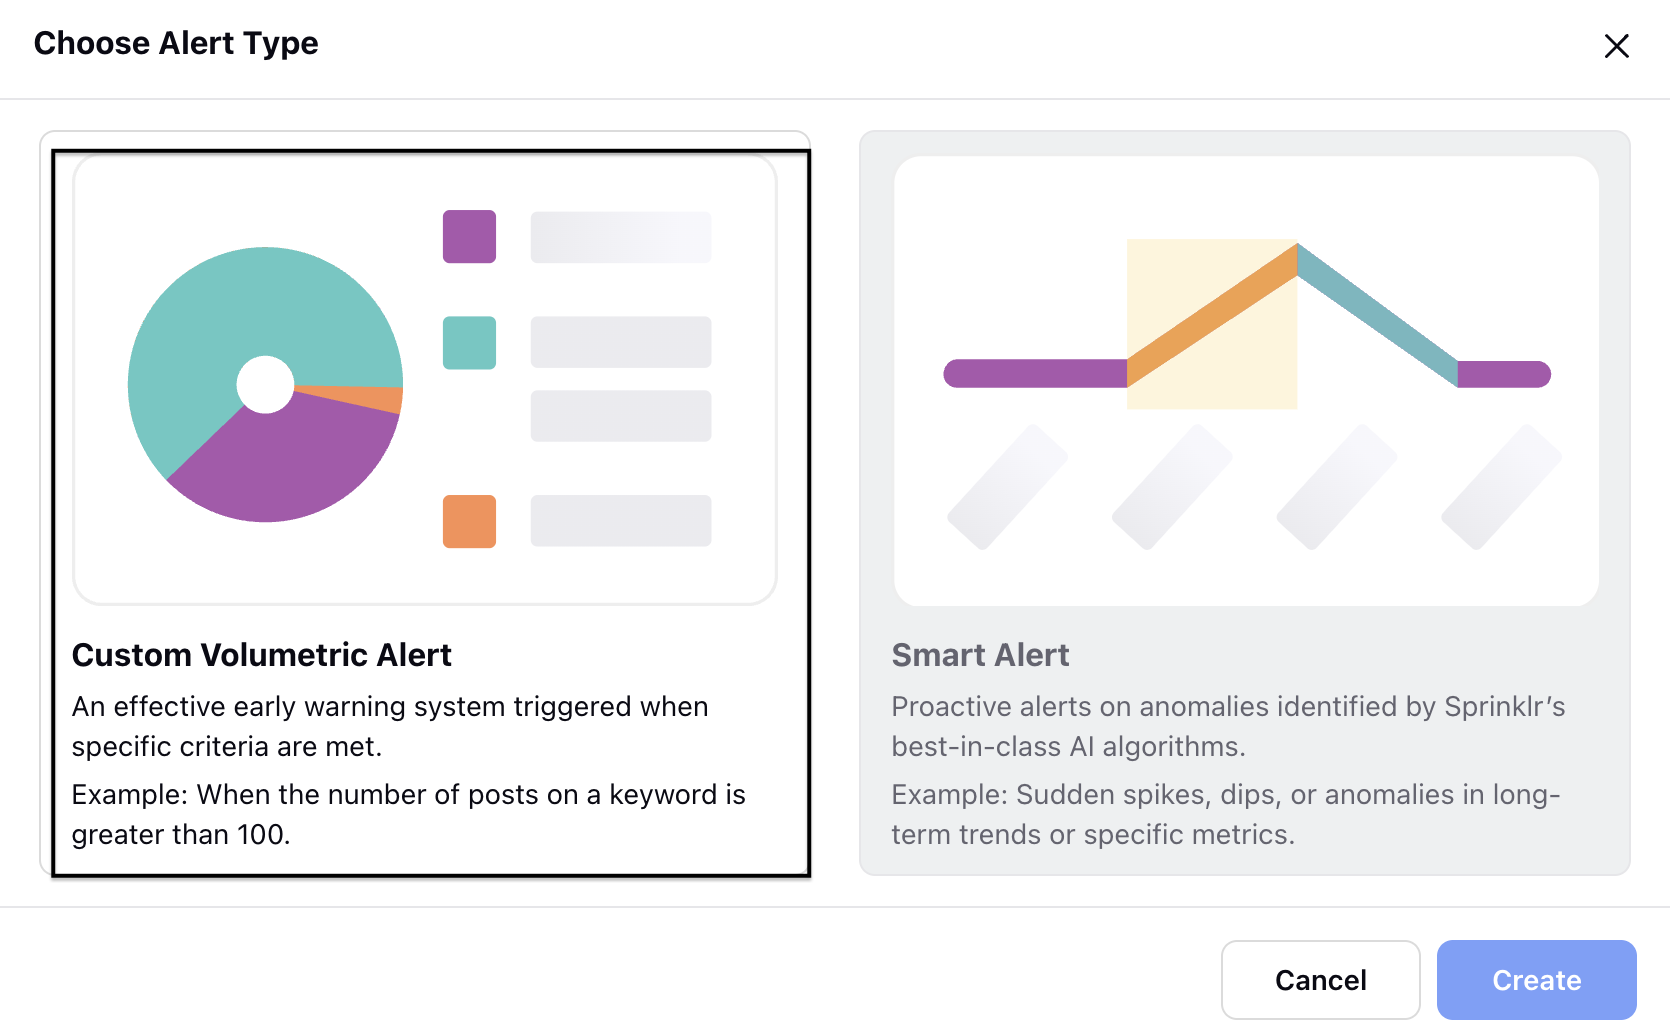
Custom Volumetric Alerts serve as an effective early warning system, triggering notifications when certain volume-based criteria are met. Whether it's a sudden spike or drop in key metrics, these alerts help you stay informed and respond quickly to changes that could impact your business.
Prerequisites
In order to access alerts in reporting, you would need View, Create, Edit, Delete and Admin permissions under Alert Manager.

Setting Up Alerts
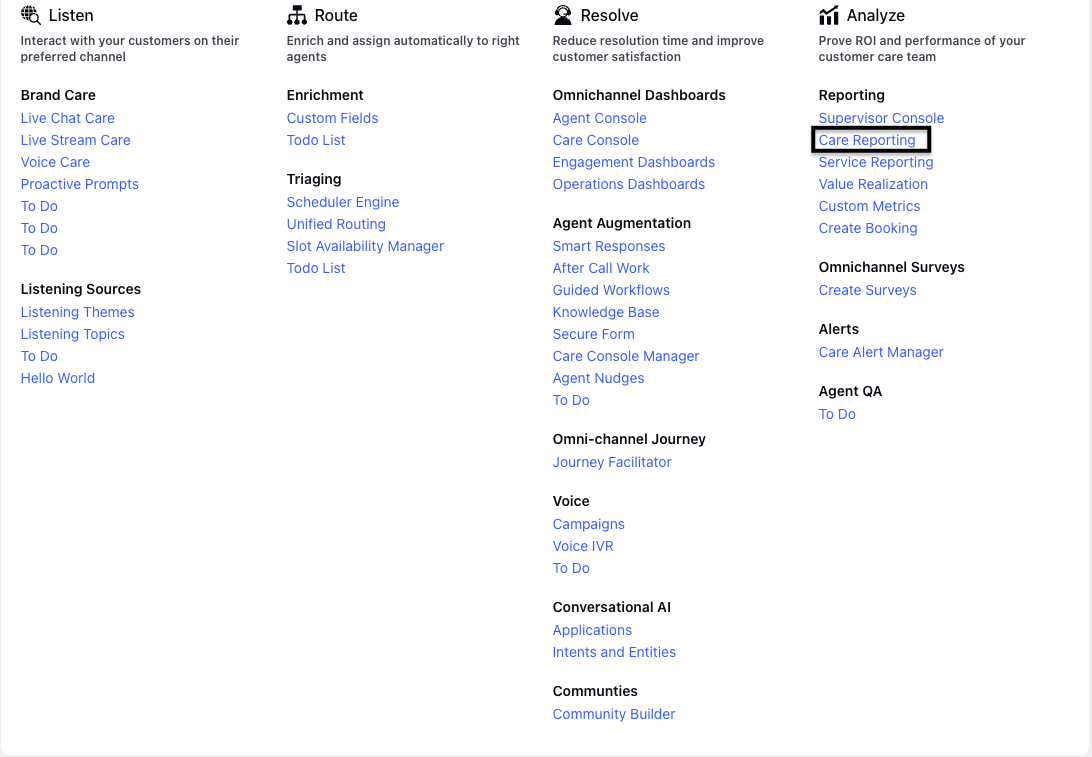
Go to Sprinklr Service and navigate to Care Reporting(within Reporting under Analyze).
Create a new dashboard by clicking on + Create Dashboard or access an existing dashboard from the Record Manager.
Next, click "+ Add Widget" to begin adding a new widget. Choose the data source, then select the relevant metrics and dimensions to configure and create your widget.
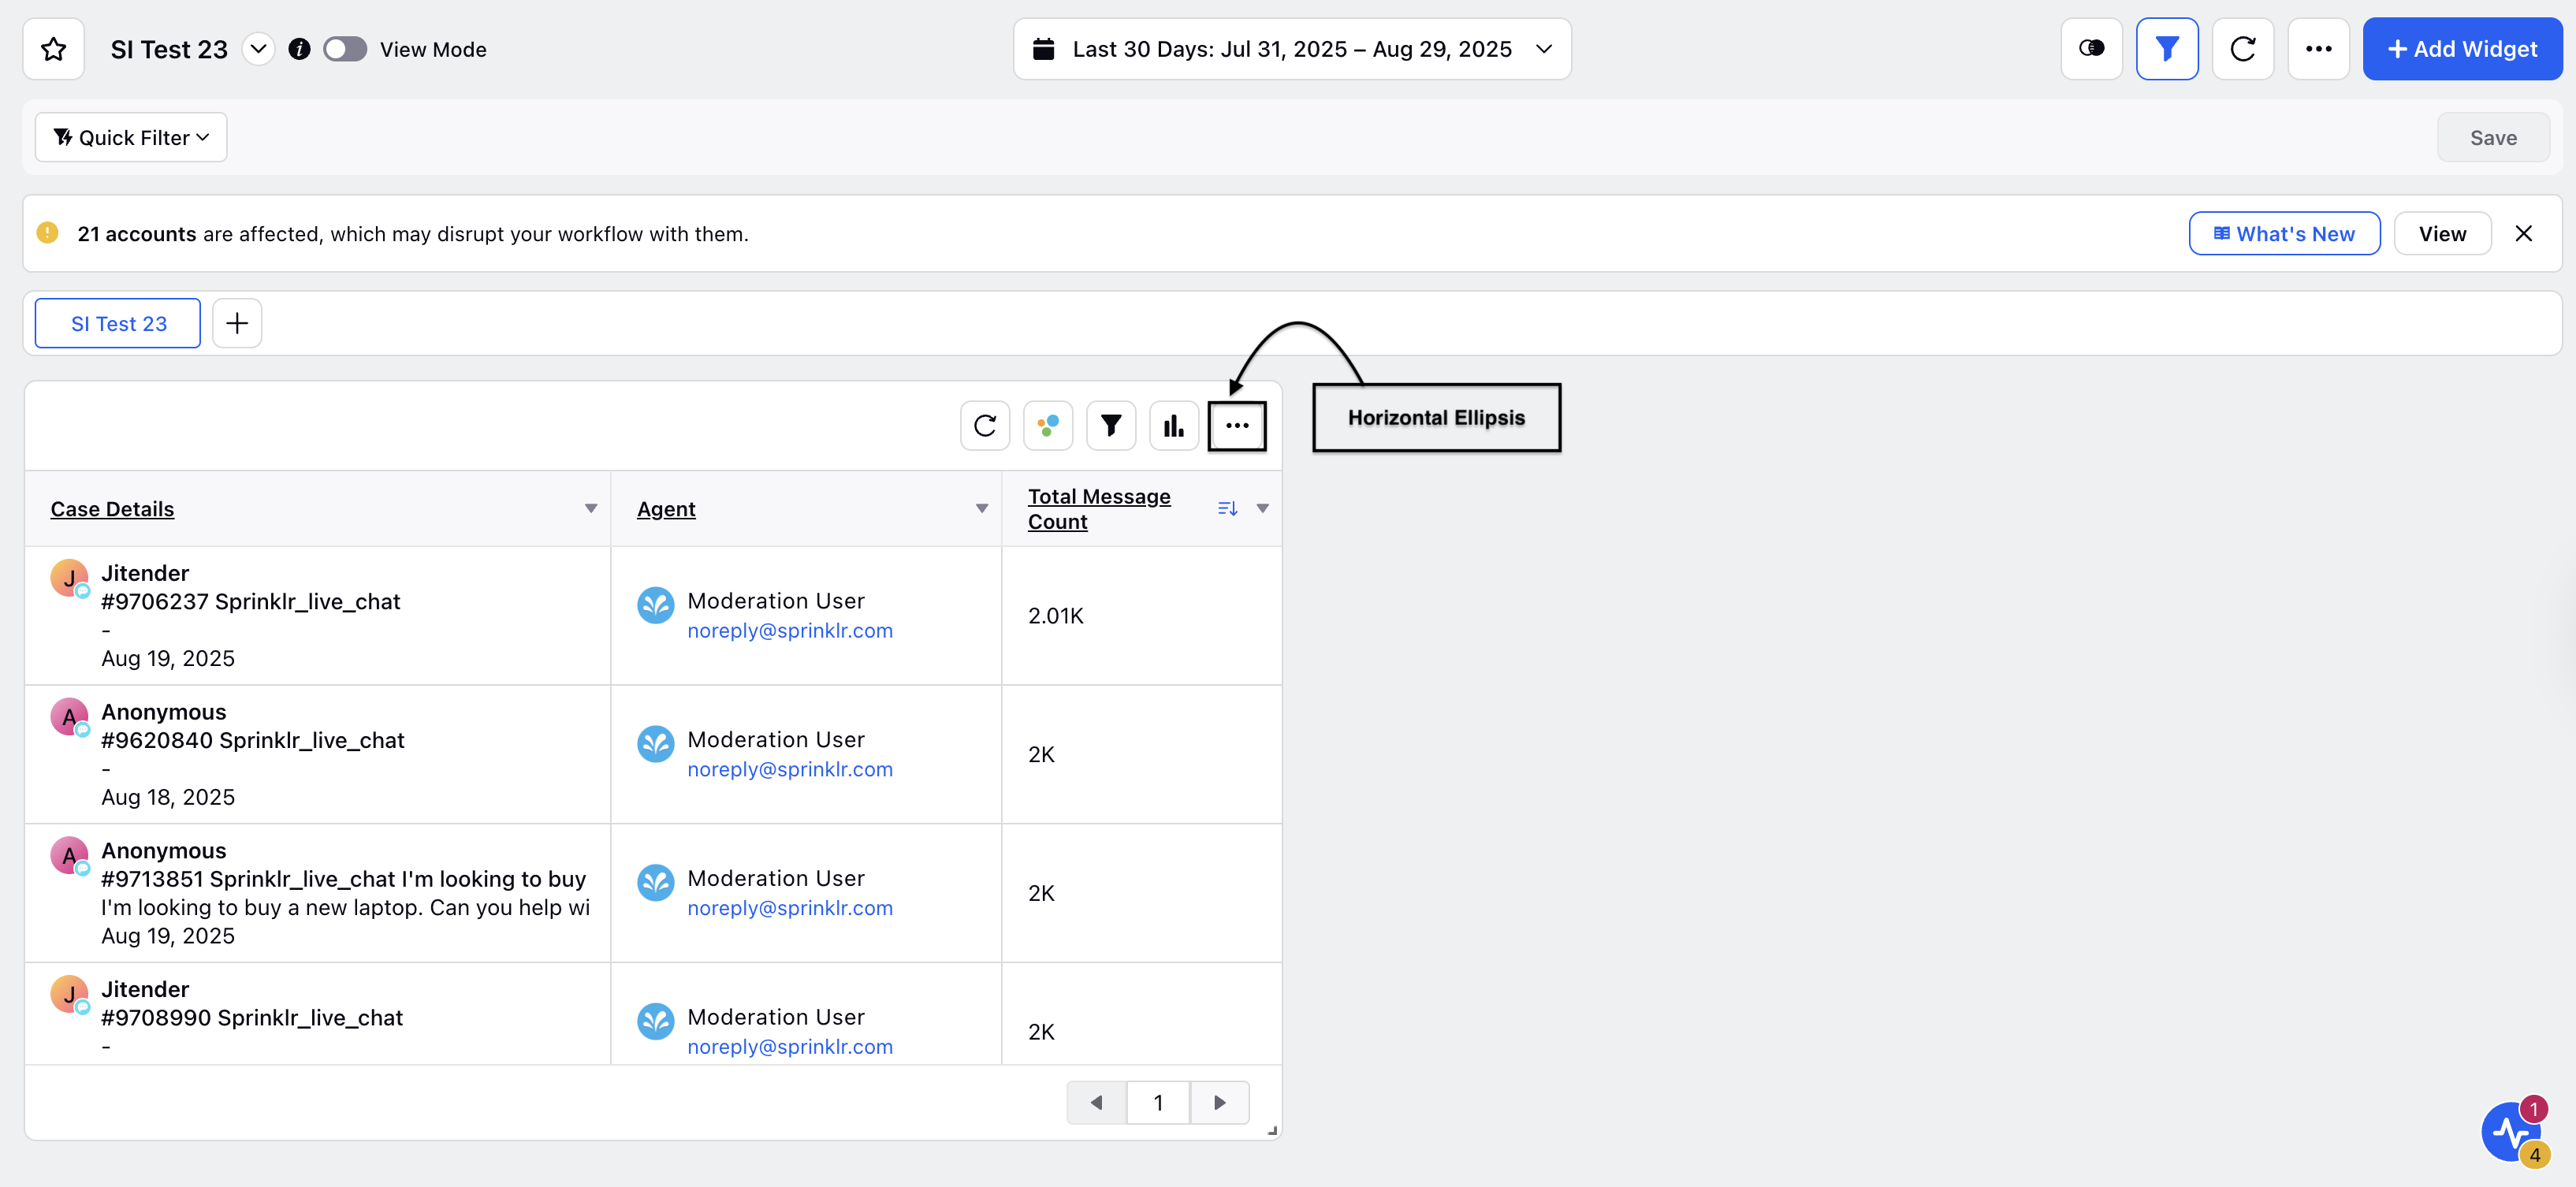
Once the widget is created, click the Horizontal Ellipsis (...) on the widget and click Create an Alert.
Select Custom Volumetric Alert from the Choose Alert Type window and click Create.
Go to the Create Volumetric Alert page and fill in the details:


Alert Name: Add a meaningful name to the alert.
Add Description: Add a description to the alert.
Add Tag: Add a tag to the alert.
Module: The Module Type field will be automatically taken from the widget data engine that was selected.
Alert type: The default setting for Alert Type will be Custom Volumetric Alerts.
Alert Dimensions: These values are based on the dimensions you selected during widget creation. When a dimension is applied, the alert criteria for the chosen metric will be evaluated separately for each value within that dimension.
Alert dimensions filters: Initiate the process by selecting filters, defining the necessary conditions, and inputting the desired values. Alerts can be customized using a more extensive array of metric aggregations—such as average and percentile, to more precisely align with customer reporting demands. Furthermore, you can click "+ Add New Filters" to include additional metrics and establish conditions tailored to your specific requirements. Decimal thresholds are now supported, allowing more precise alert conditions.
Note: Multiple conditions will be combined using the AND operator.
Trigger Conditions: You can select the trigger condition type. You can select the trigger type from the drop-down. Let us look at the functioning:
Threshold-based alerts: An alert is triggered when the selected metric exceeds the defined threshold within the specified time period. Let us understand the set up of Threshold-based alerts:
Metrics Filters: Select the metrics and define the condition and enter the value.
Time Frame: Select the time frame. Example: Every 5 minutes, every 15 minutes, etc.
Date Range: Select a custom date range to specify the time period over which the alert should evaluate the metrics.
Business Hours: Define business hours for the alerts to be triggered.
Irregular activity alerts: Trigger an alert when a metric changes from the previous time period, based on either a percentage difference or an absolute value change.
Metric: Select the metric you want to monitor.
Note: Only the metrics utilized during the creation of the widget will be available for selection.
Change Type: You can select the change type by selecting increment or decrement.
Measure by: Select how you want to measure the change: either by Absolute value or Percentage (%).
Value: Enter a numeric value for which you want to define the threshold.
Previous Date Range: Choose the prior date range to analyze the discrepancies in relation to the current date range.
Date Range: Choose the date range from the custom options to analyze the discrepancies between the prior and the current date range.
Business Hours: Define business hours for the alerts to be triggered.
Avoid spam by adding maximum notification frequency: Set the maximum notification frequency to control how many alerts can be sent per hour, day, week, or month.
Maximum alerts: You can set a numeric value for the alert.
Duration: You can set the to hourly, daily, weekly, etc.
Permissions: You can define view and edit permissions by adding users, user groups and workspace and click Next.
Go to Alert distribution details page and fill in the details:
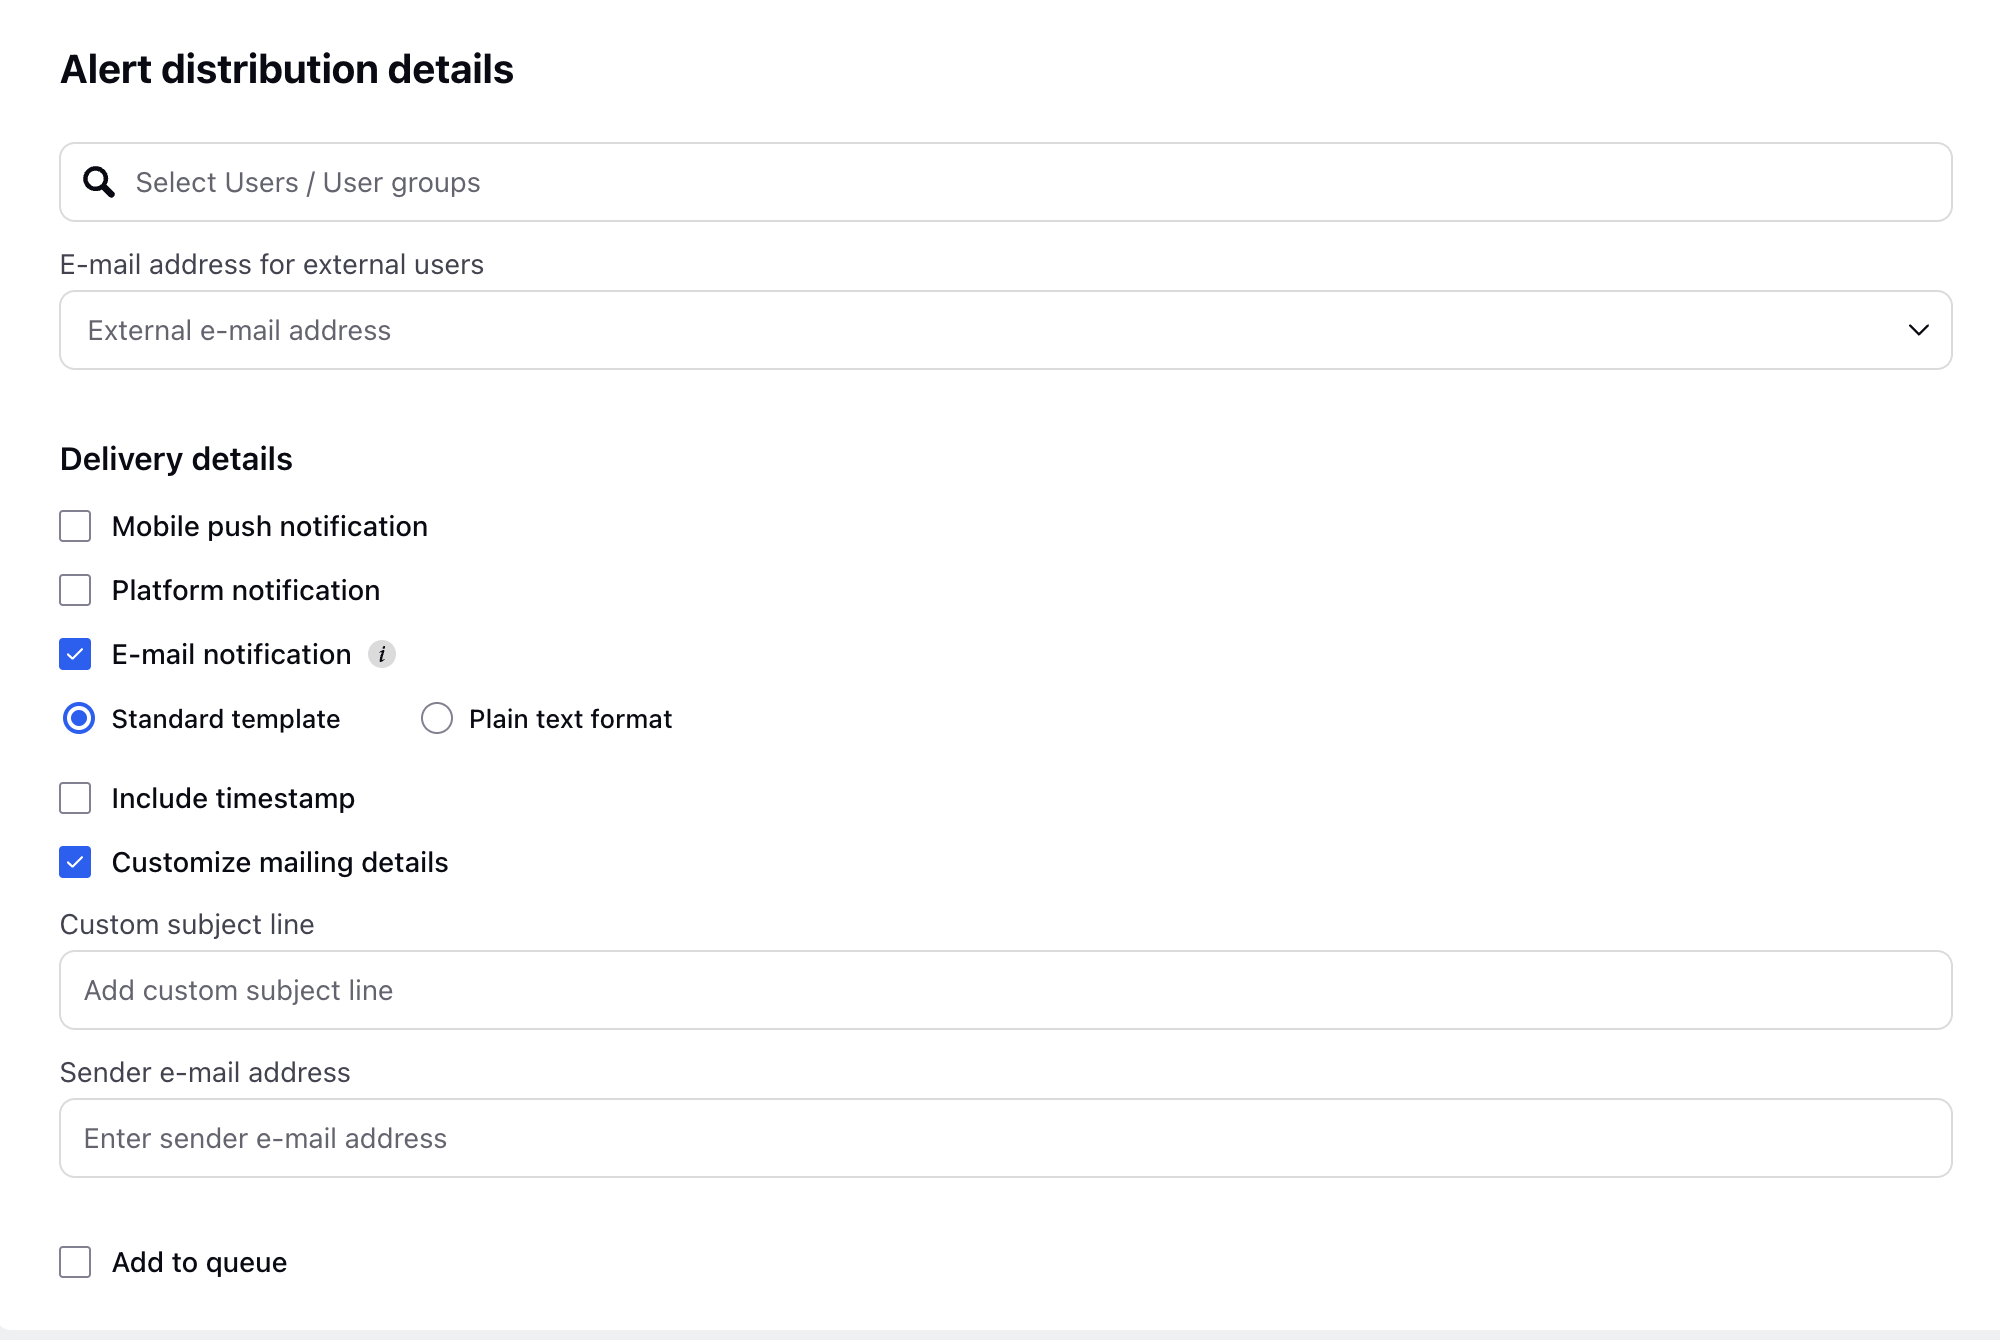
Select User/ User Group: Select Users or user groups in the search option.
E-mail address for external users: You can add Email ID of external users who can get notified for alerts.
Delivery details:
Mobile push notification: You can enable mobile push notifications which will notify through Sprinklr mobile app.
Platform Notification:You can activate platform notifications to receive alerts on the platform.
Email Notification: You can activate email notifications to receive alerts via email.
Standard Template: You have the option to select the Standard template to utilize Sprinklr’s default email format.
Plain text format: You can select the Plain text format if you prefer a simple text-only version.
Include time Stamp: You can enable the option to include timestamp.
Customize mailing details: You can customize the mail details by adding custom subject line and sender email address.
Add to queue: You can enable this option to manage emails through inbound message queue.
Click Save.
Note: Volumetric Alerts have been extended to Service Analytics, Task and Community as data source.
Alerts now display the user interface name instead of the backend name.
Manage Alerts
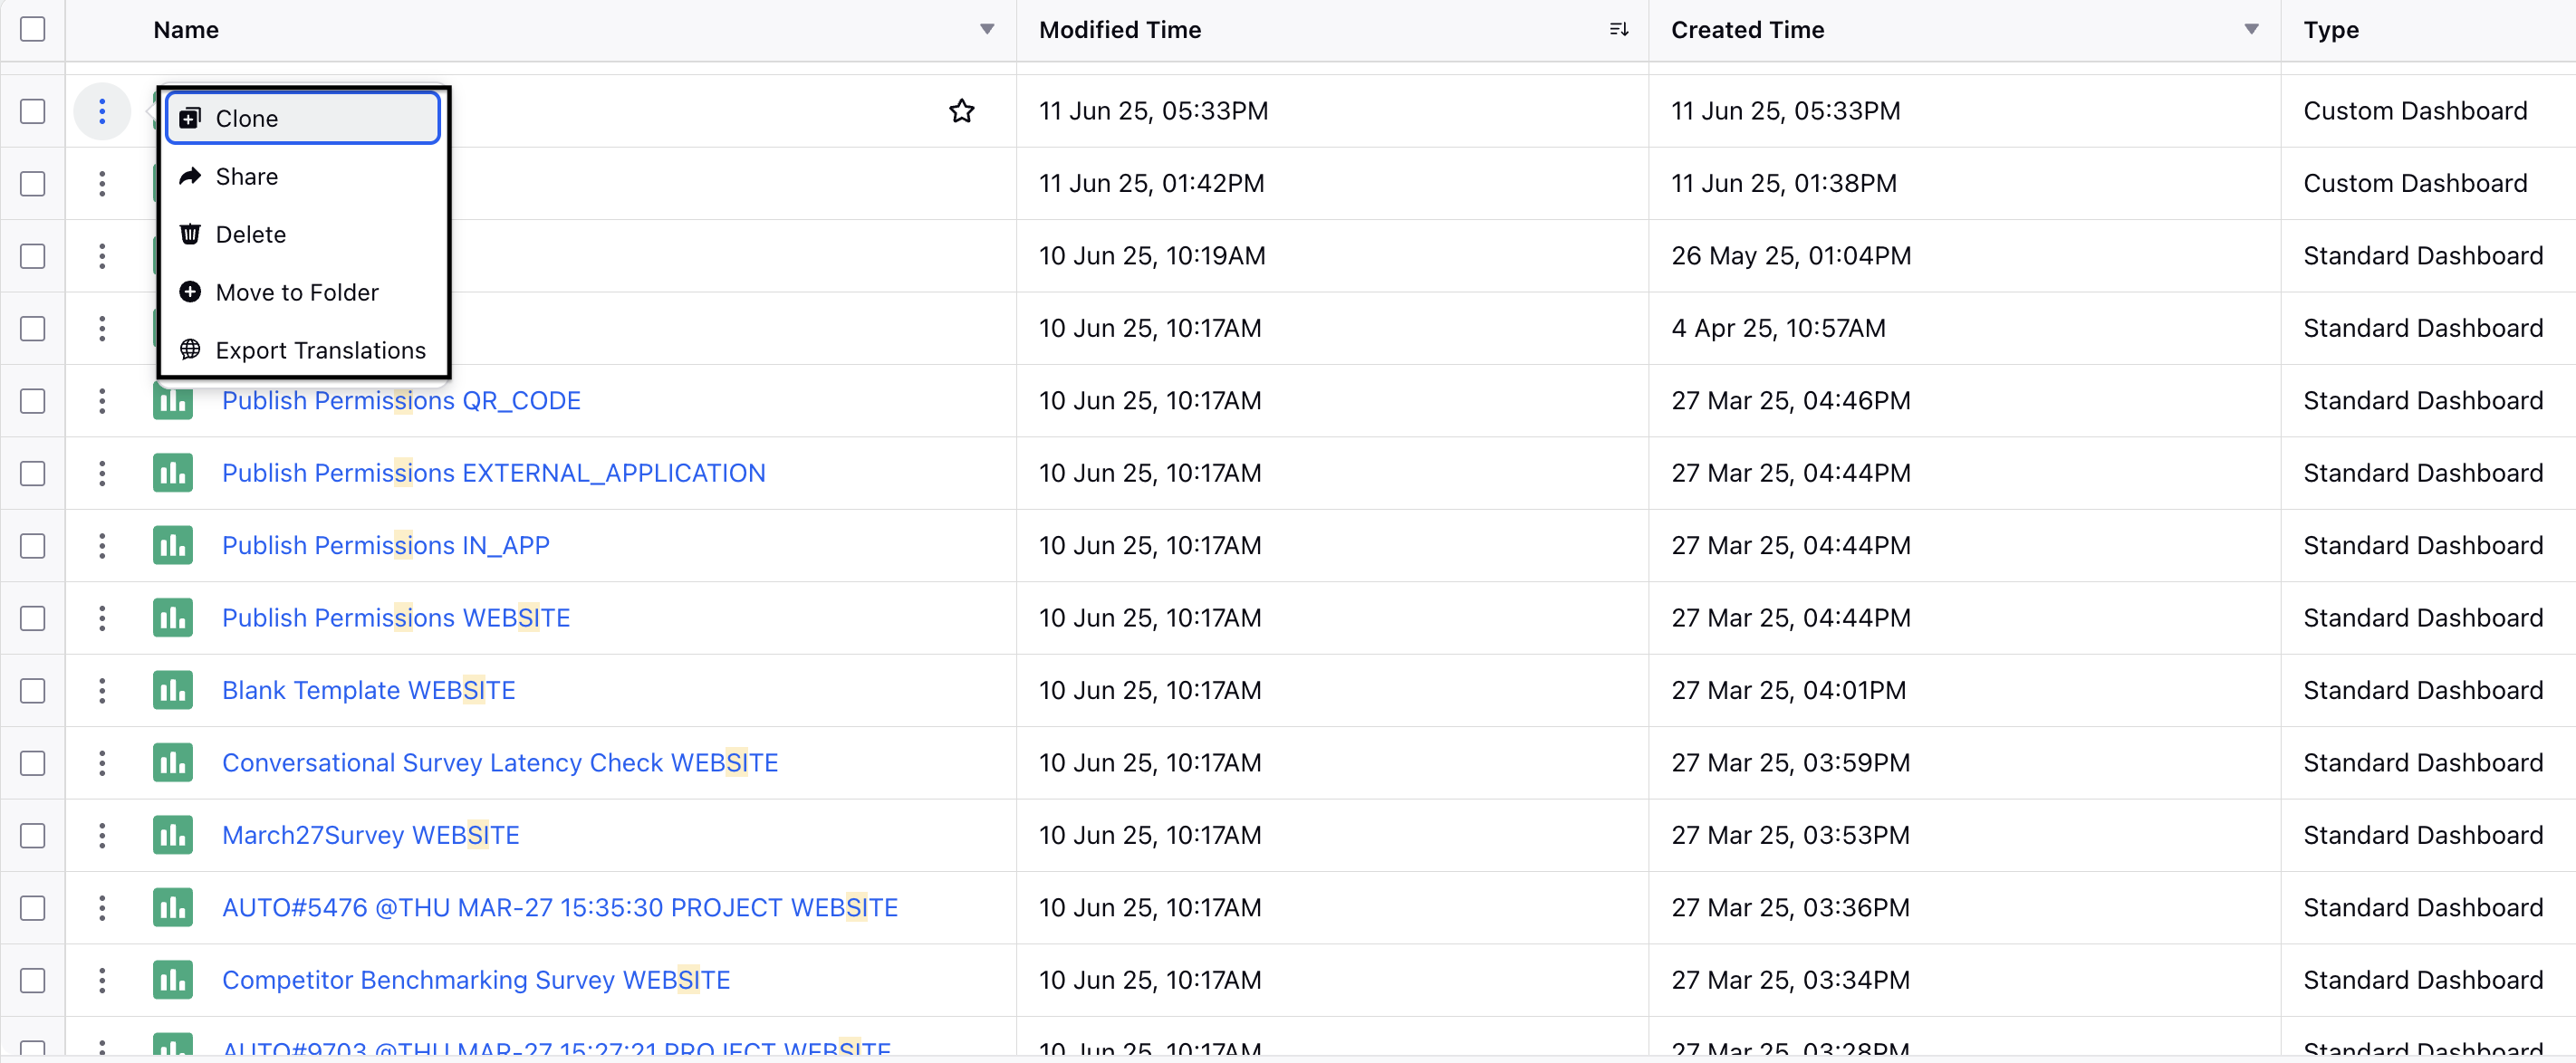
Navigate to Platform Modules and then go to Alerts Manager (under Mitigate Brand Crisis under Love).In the Alert Manager window, activate the alert by switching on the toggle that corresponds to it. Click the Vertical Ellipsis(⋮).
Edit: Select Edit to reach the alert configuration settings and adjust the alert settings as required.
Clone: Choose clone to make a duplicate.
Audit: You can select the audit option to view the audit trail. The audit log will be displayed, showing a record of modifications made to the alert, along with details of who made each change and the time it occurred.
Delete: You can select the delete option to permanently eliminate the alert.