Create Custom Listening dashboards
Updated
Listening Dashboards helps you track and monitor brands, markets, customers, products, competition, and crisis scenarios by aggregating conversations from across the social web and allowing you to analyze this information dynamically. You can visualize data in the form of charts and graphs in the Listening widgets. You can create the Listening dashboards and customize them by adding widgets and tuning in to specific conversations – allowing you to engage, respond, and take appropriate action.
![]() Enablement note: In order to use this feature, Social Listening should be enabled in your environment. To learn more about Social Listening, please reach out to your success manager.
Enablement note: In order to use this feature, Social Listening should be enabled in your environment. To learn more about Social Listening, please reach out to your success manager.
To create a custom Listening dashboard
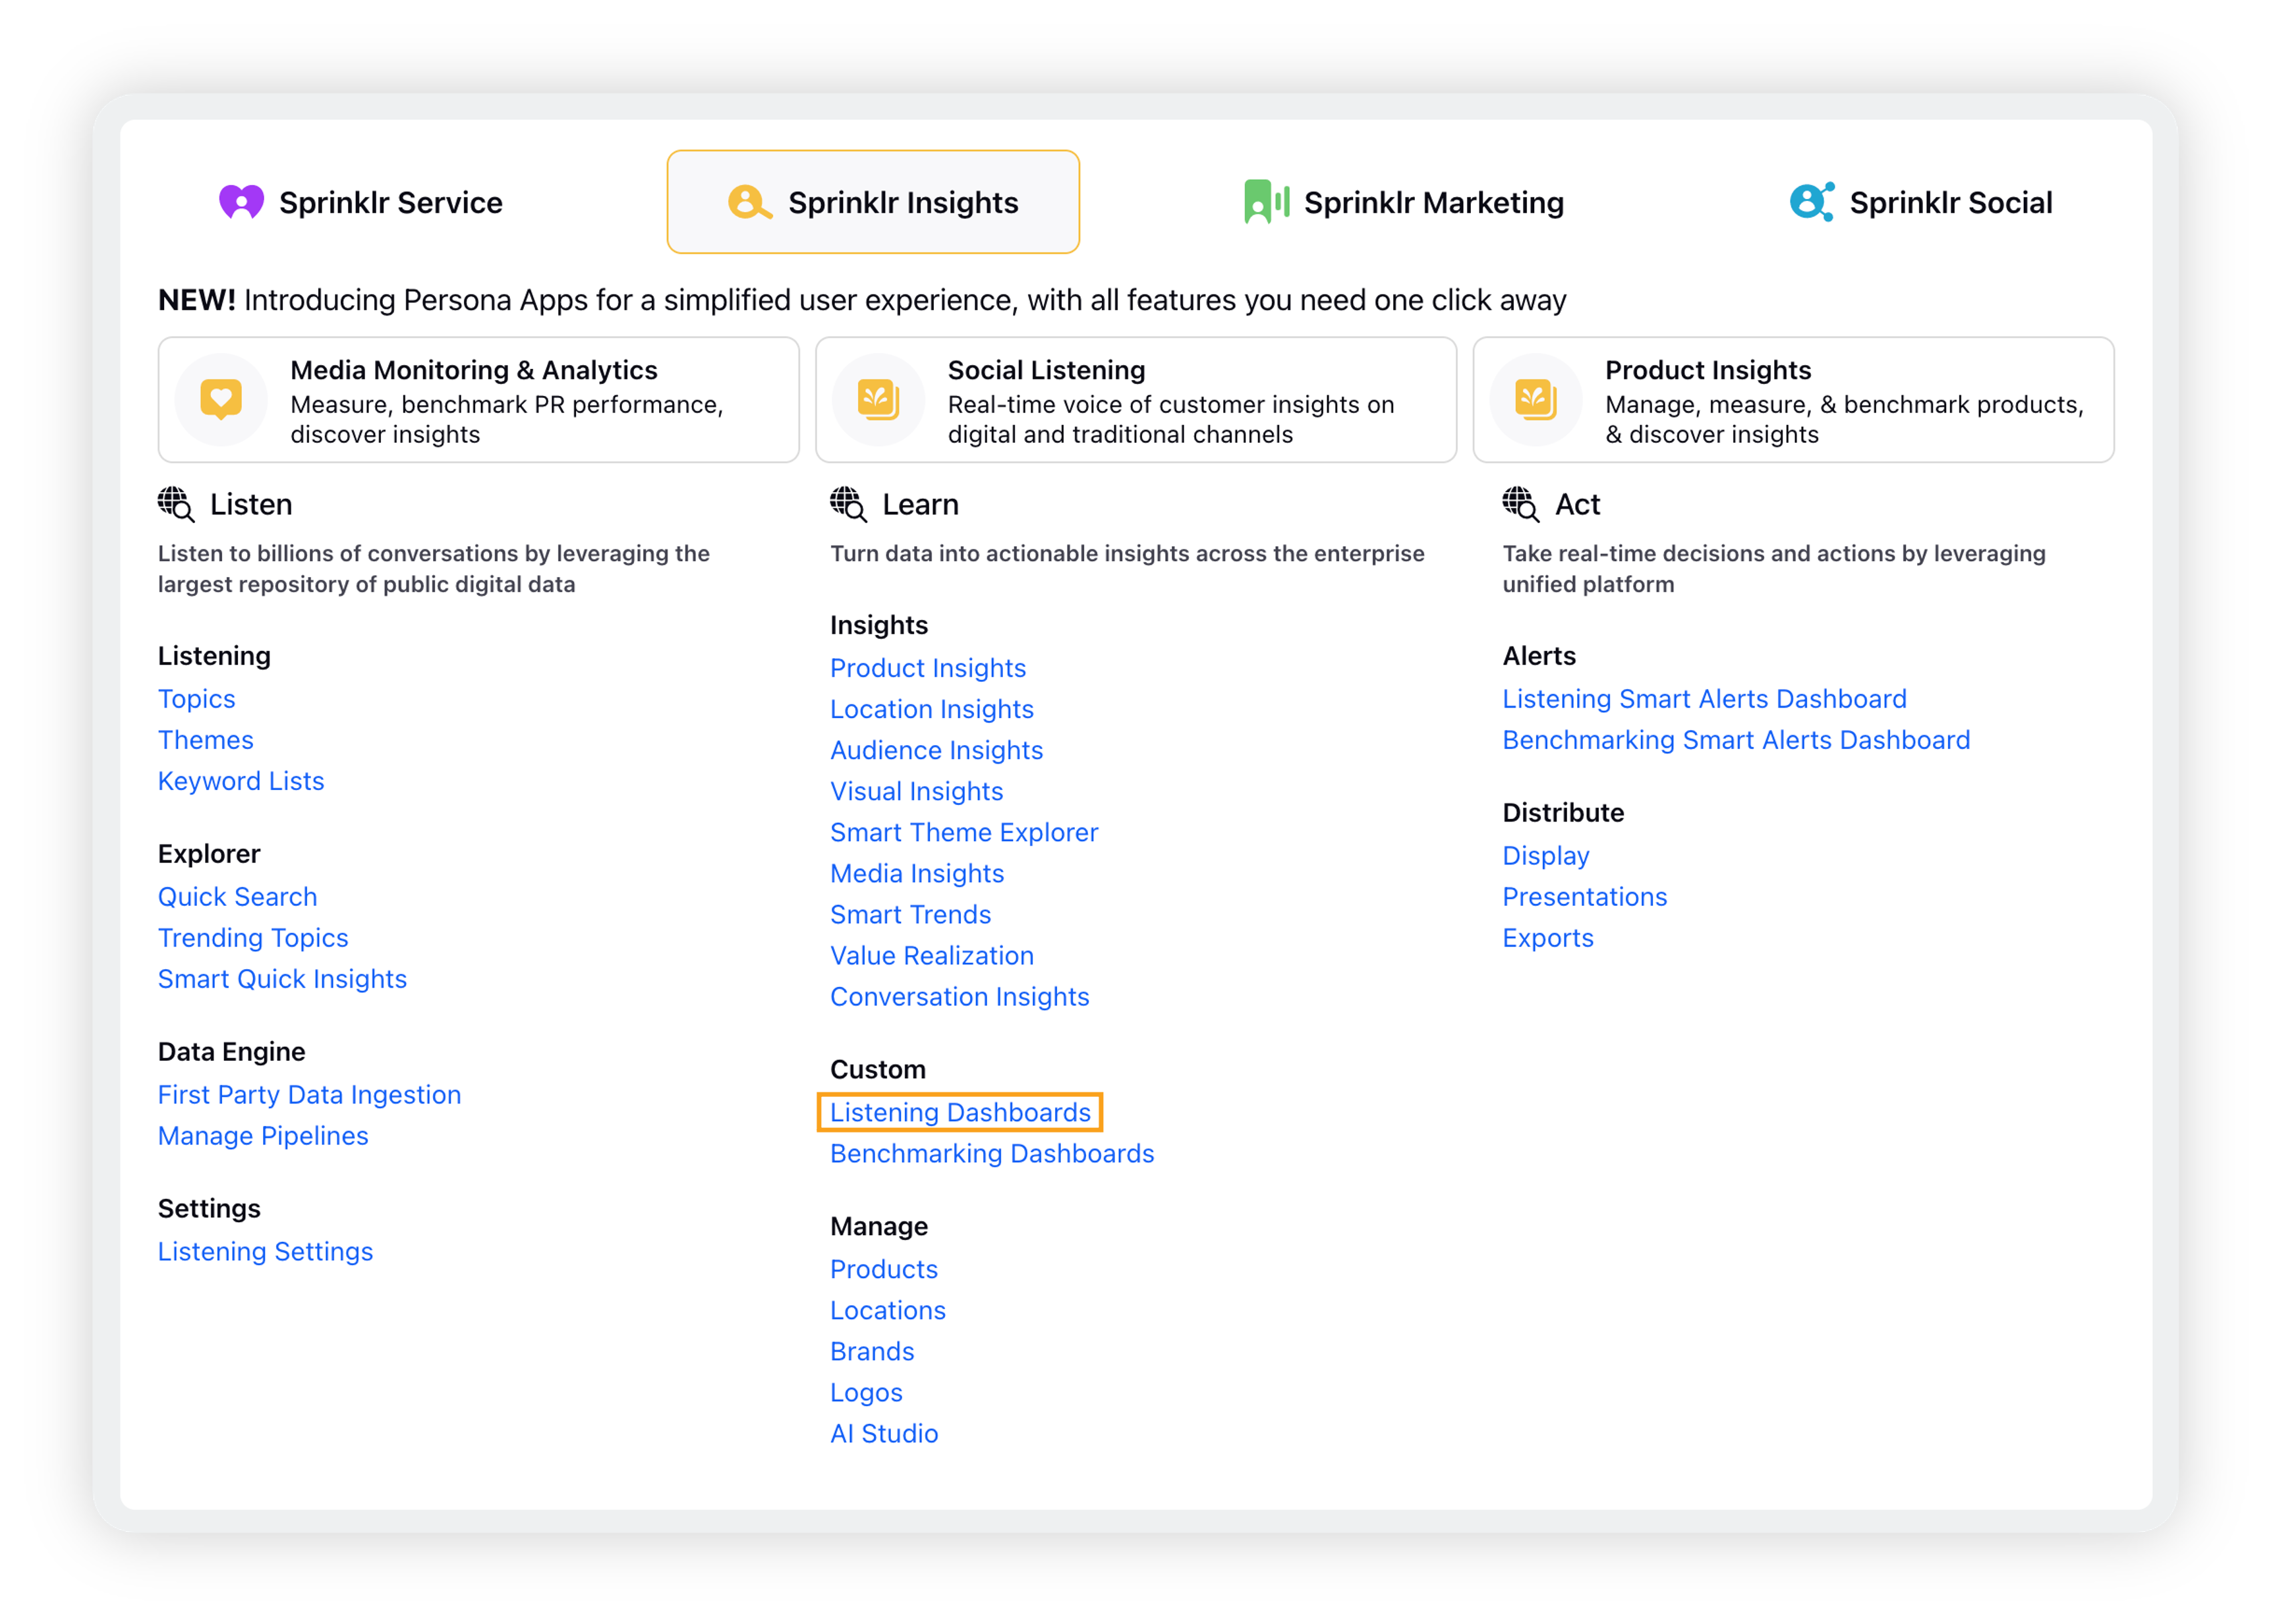
Click the New Tab icon. Under Sprinklr Insights, select Listening Dashboards within Custom.
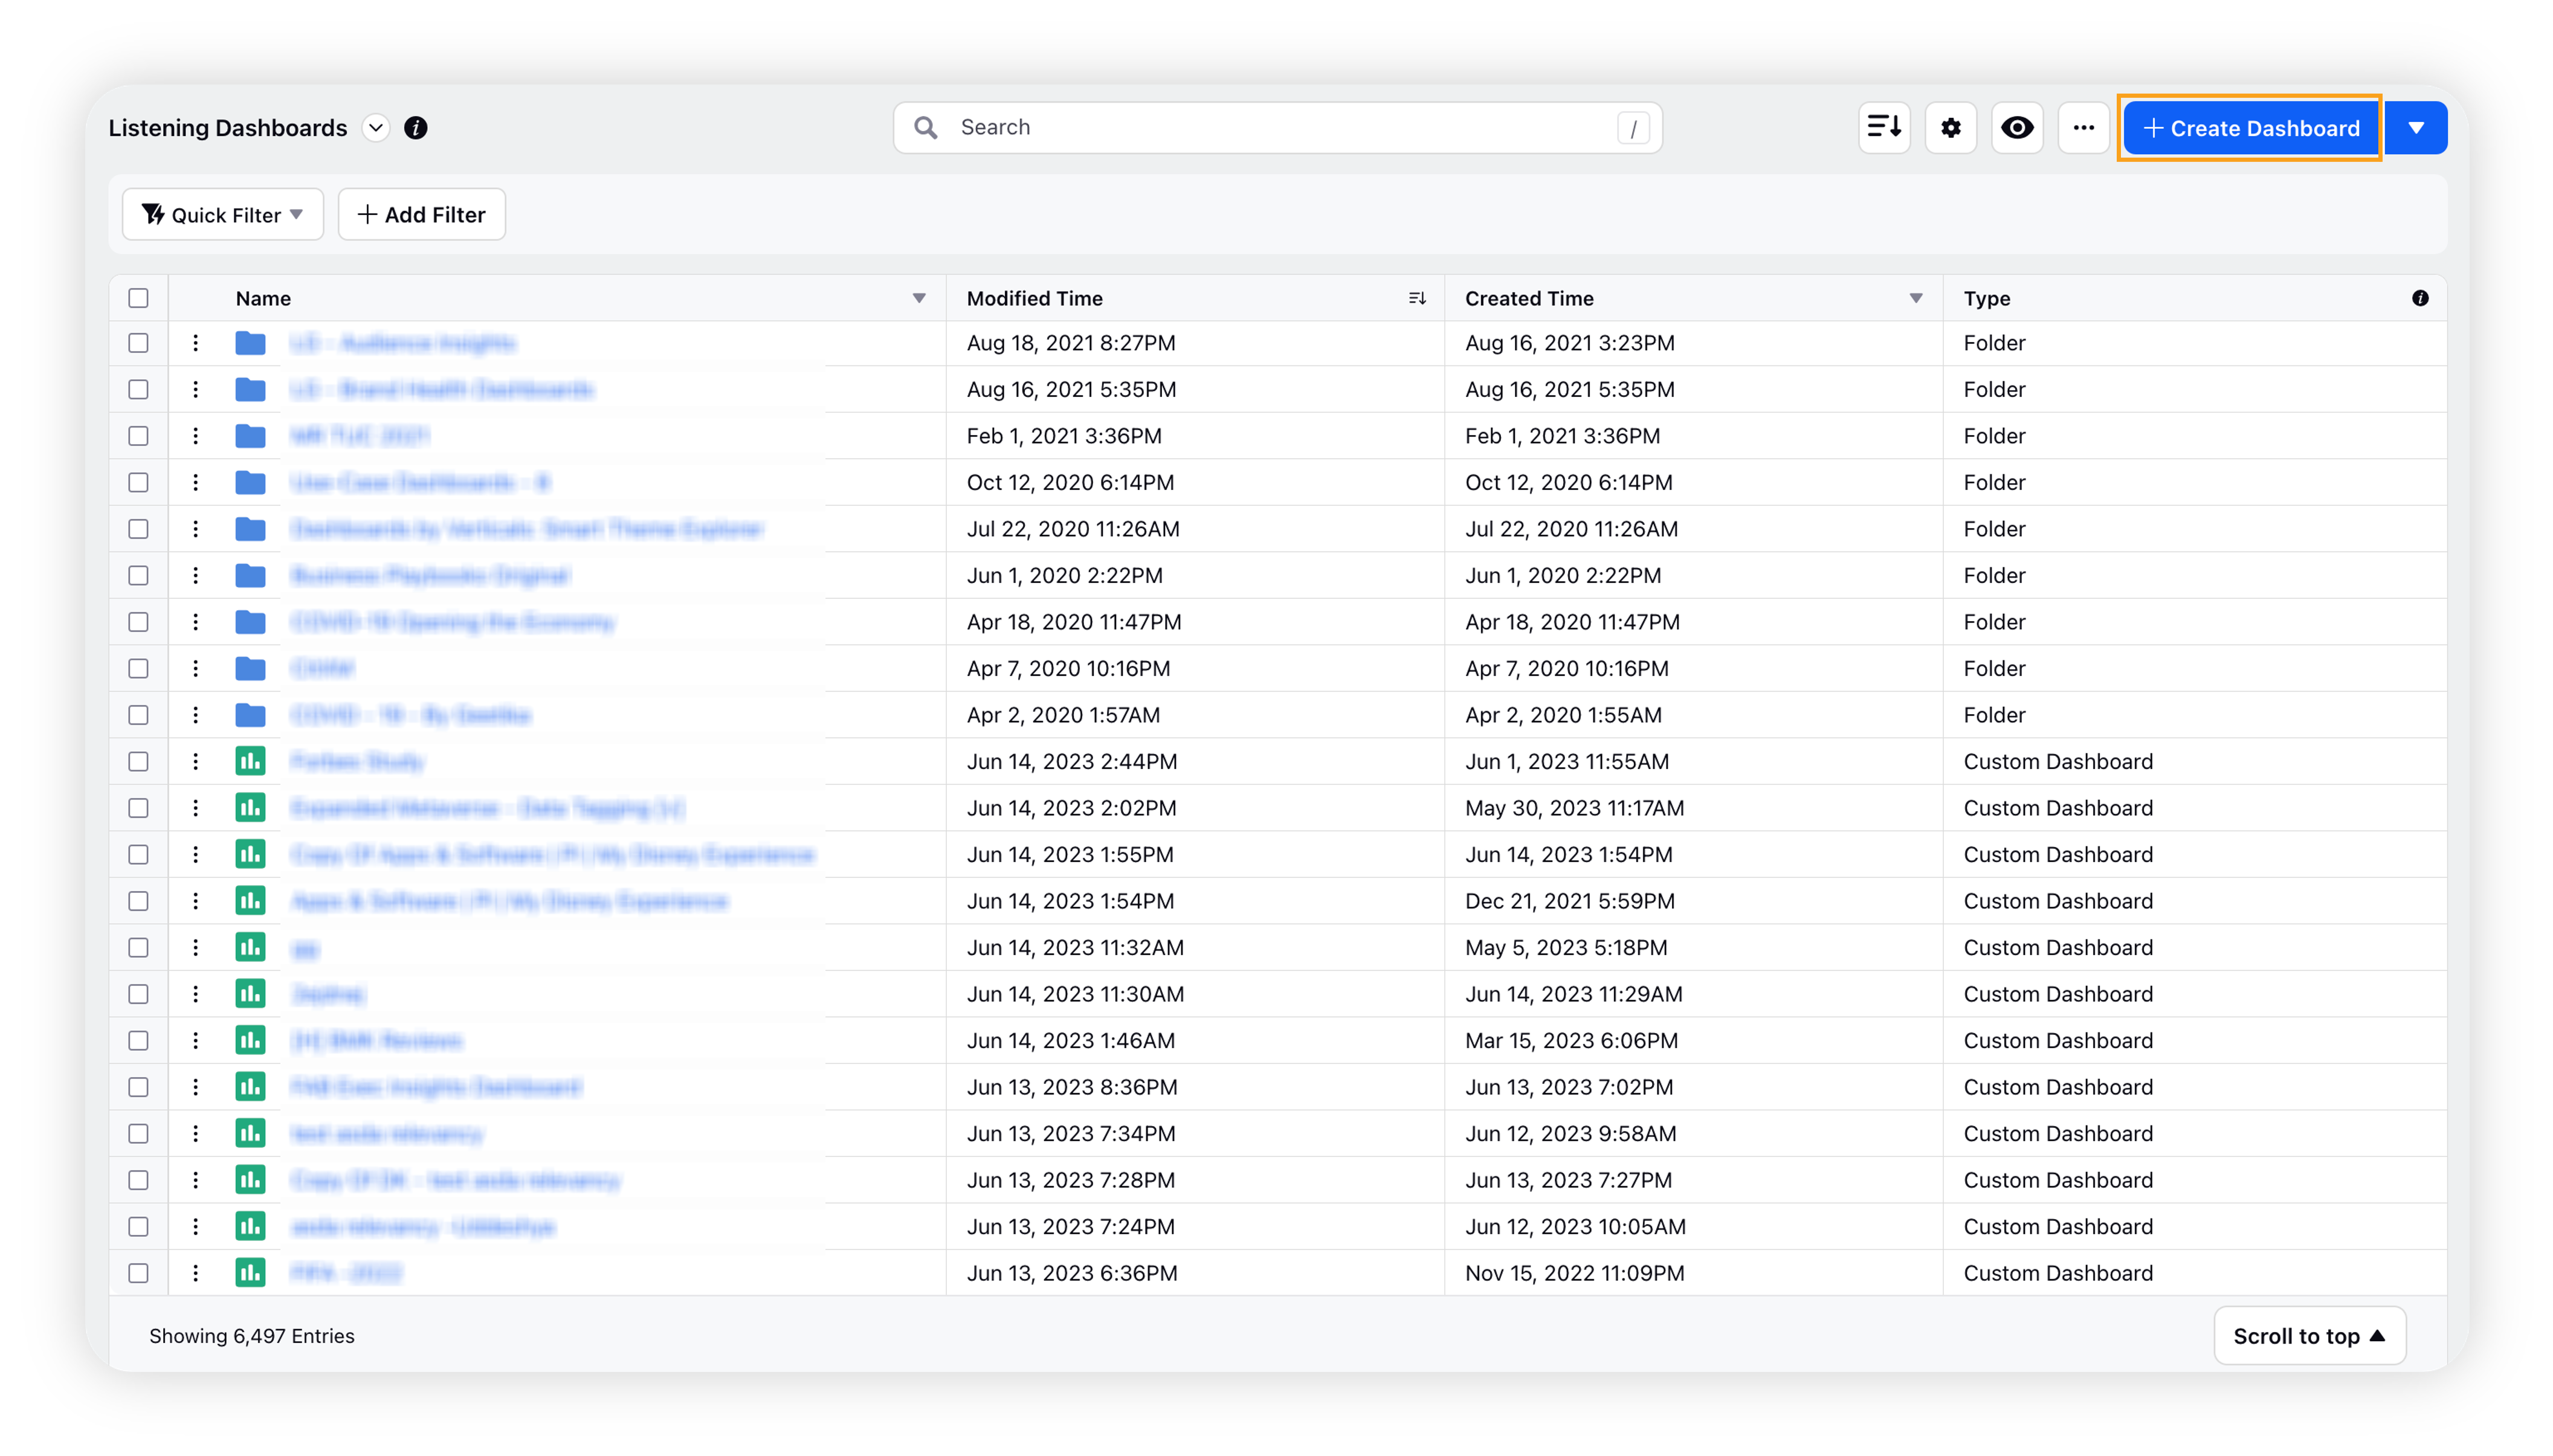
On the Listening Dashboards homepage, click the Create Dashboard icon in the top right corner.
Select Create your own and then click Continue in the bottom left corner to create your own dashboard.
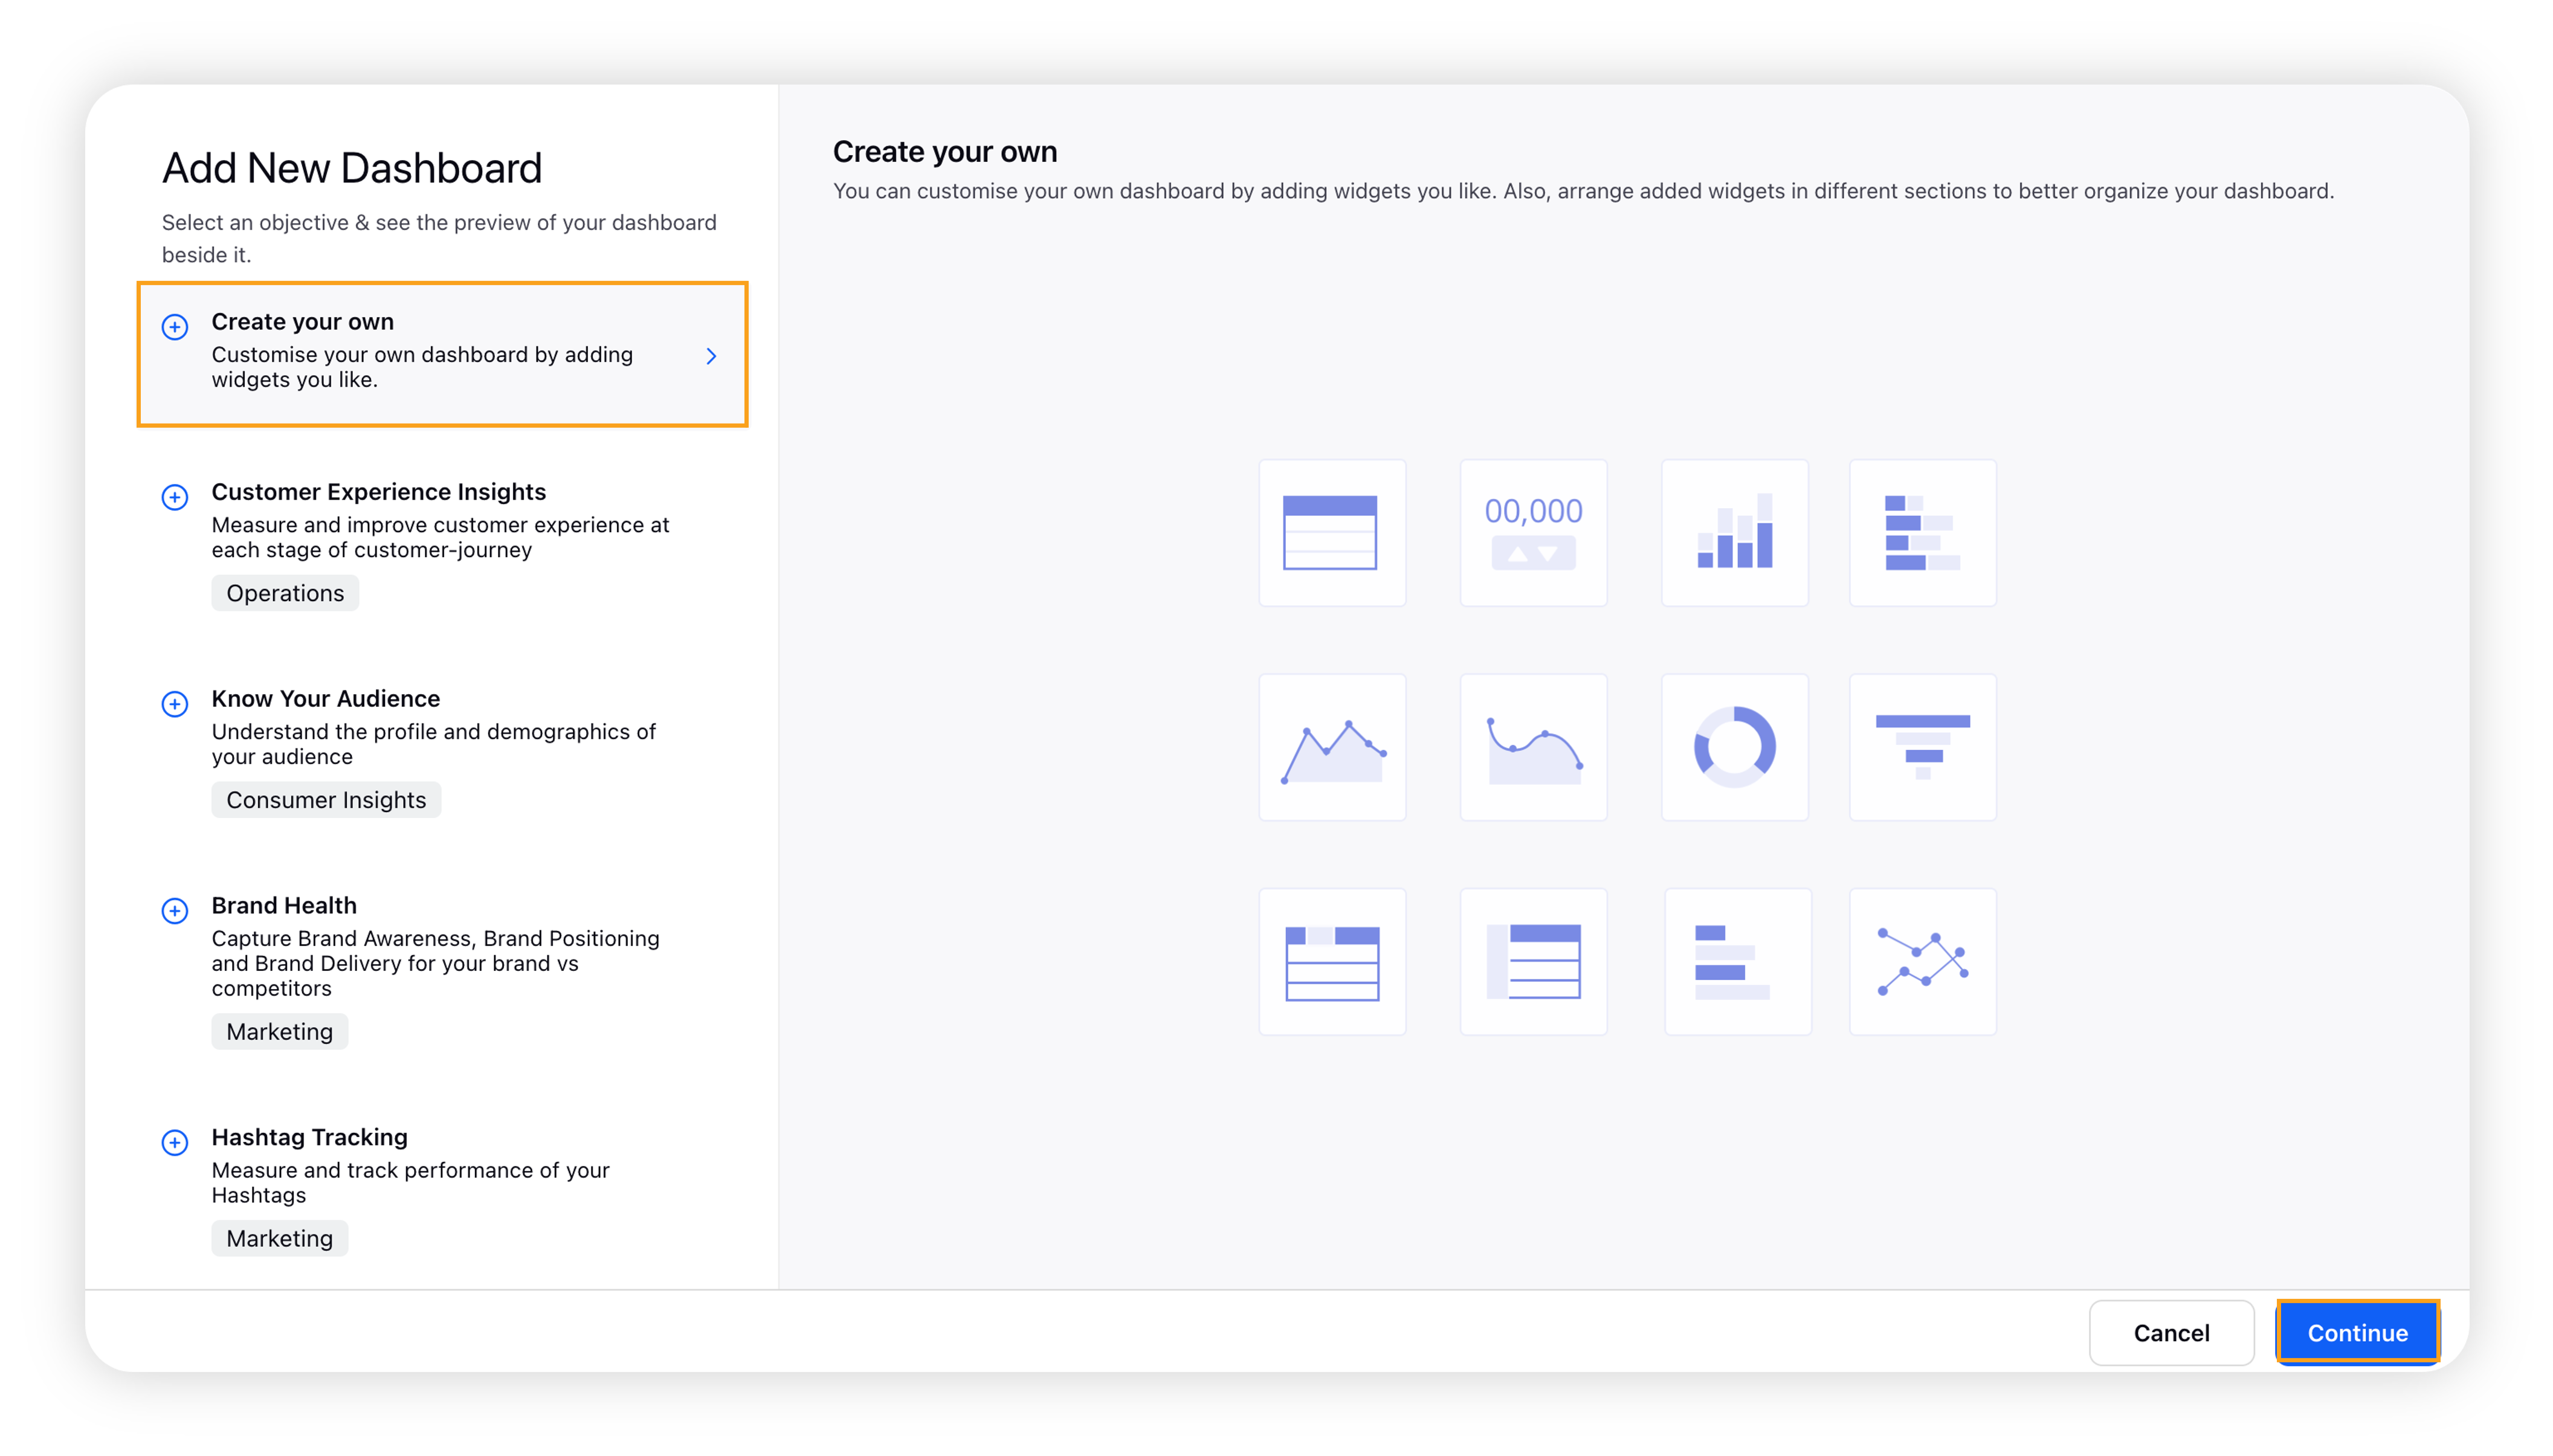
You can also choose to select different standard use-case-based templates to create your custom dashboard.
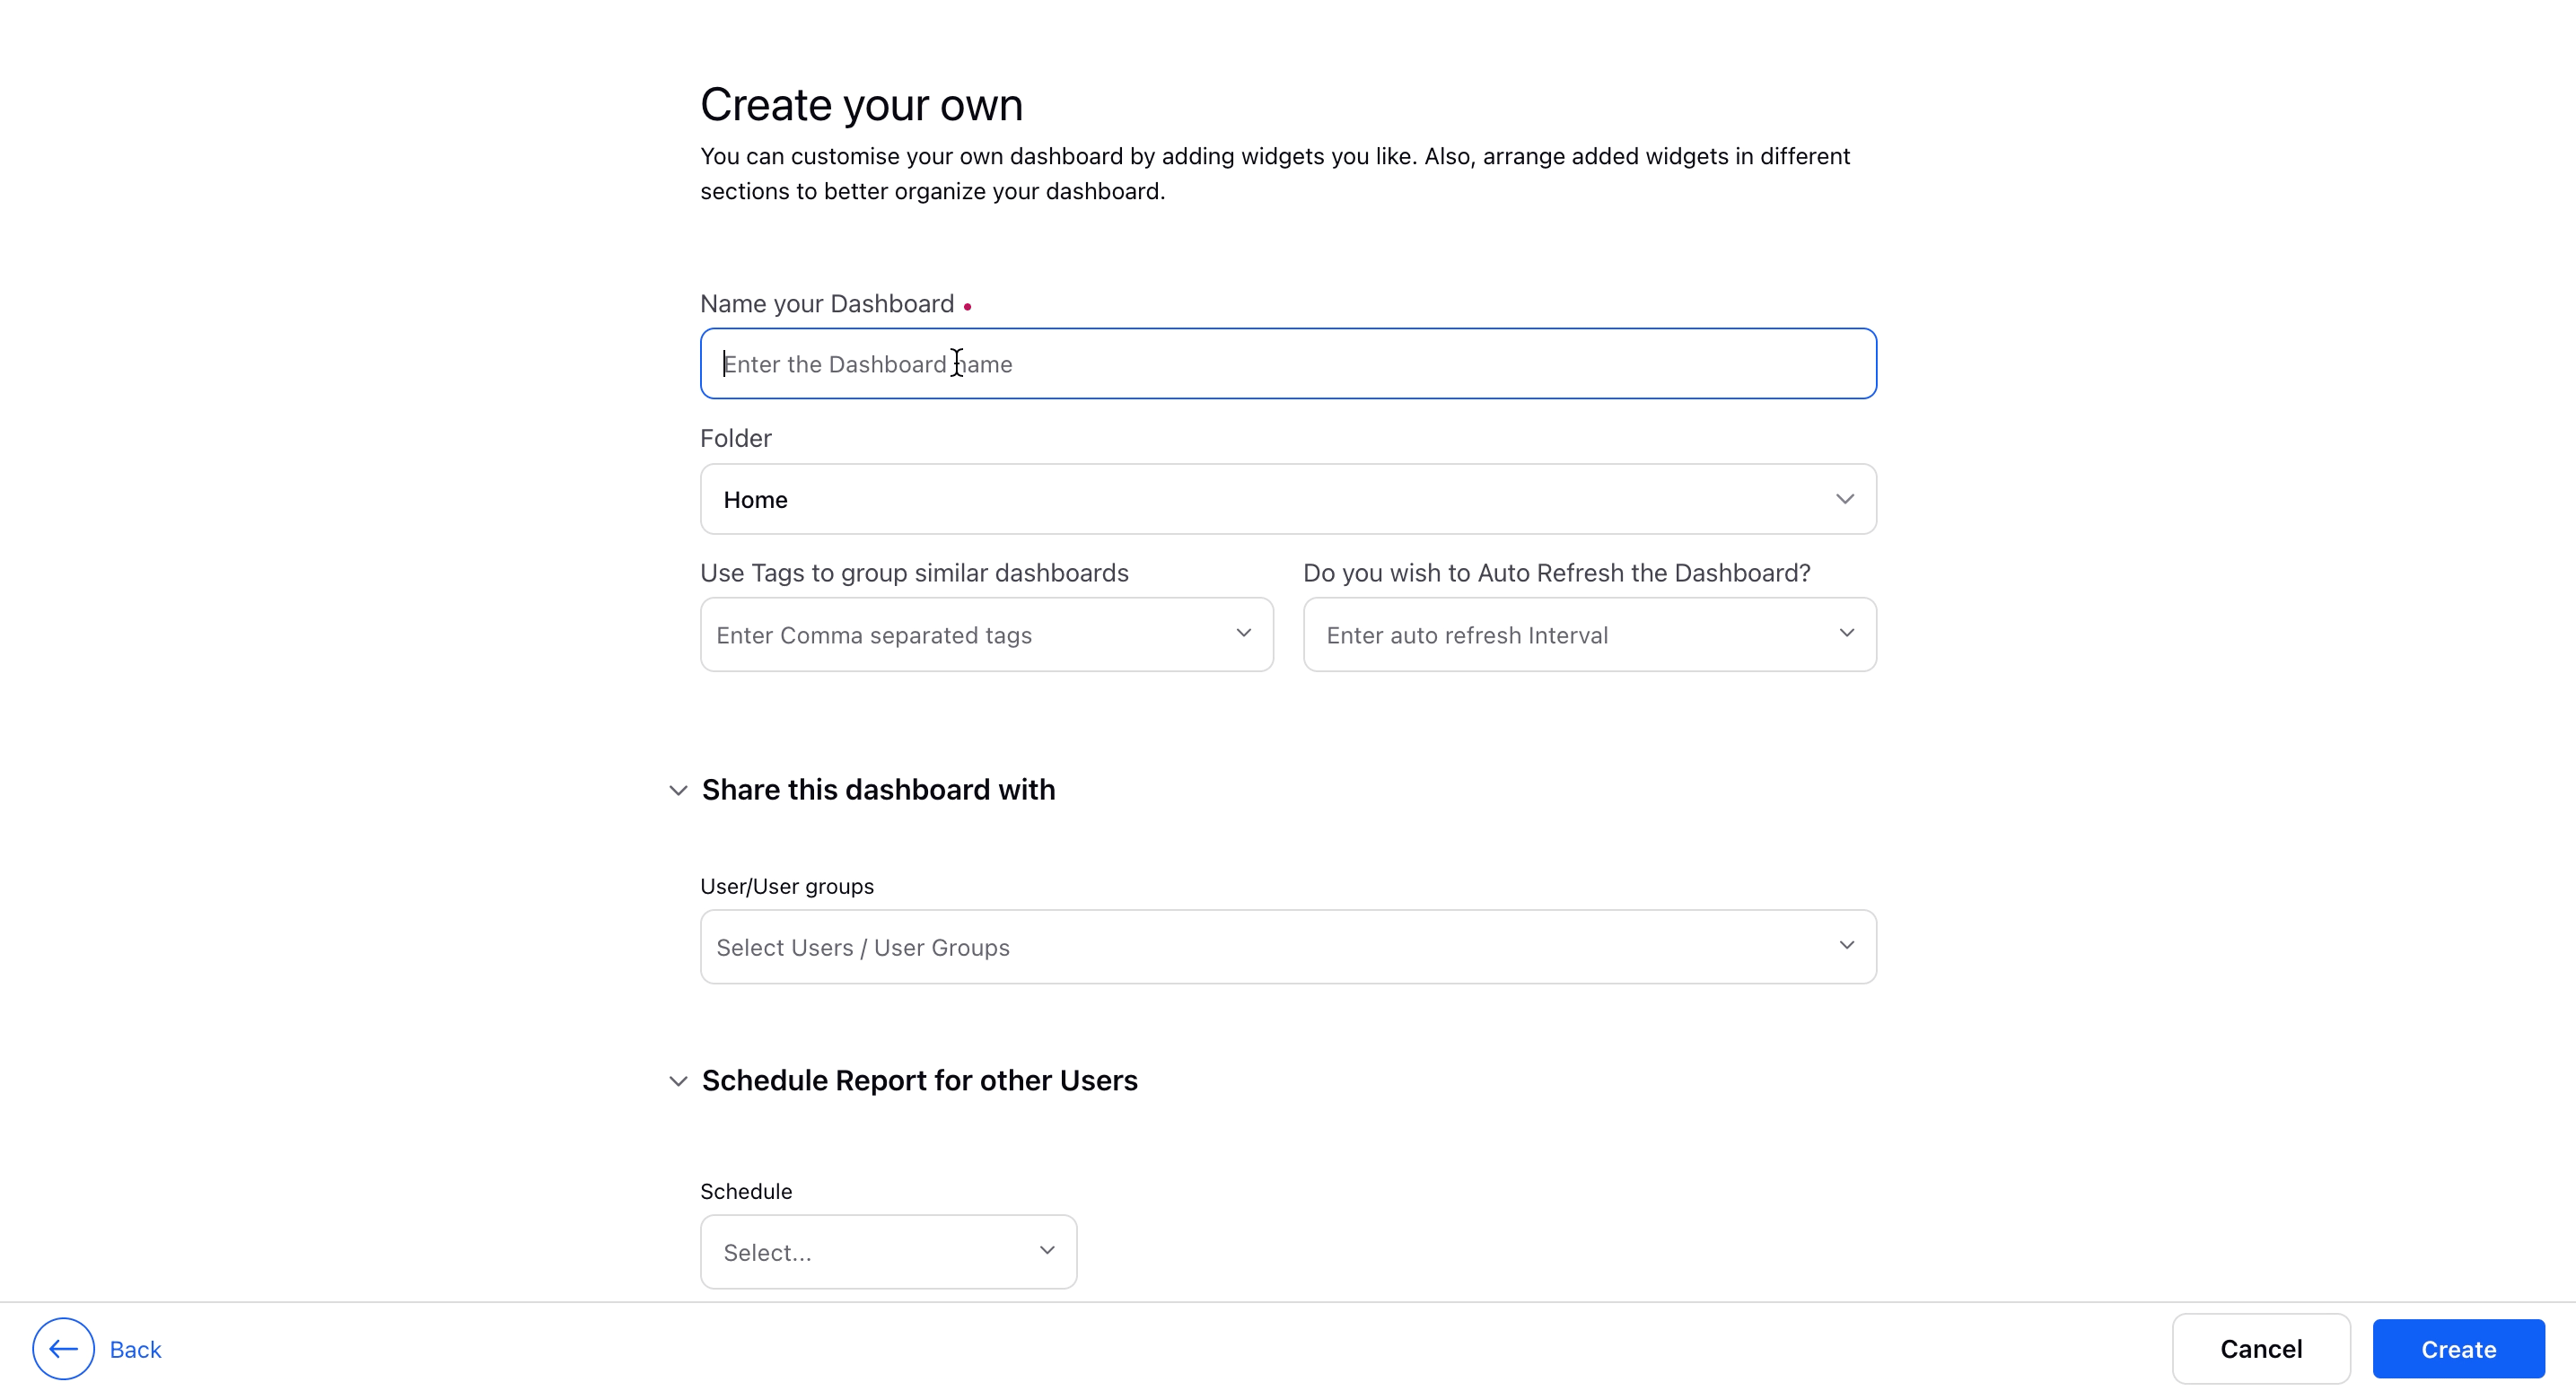
On the Create your own dashboard form, fill in the required fields and then click Create in the bottom left corner.
Upon clicking the Create button, your custom dashboard is successfully created and it will be opened on the screen as a blank dashboard.
 Note: A dashboard name must be unique, duplicate names are not allowed. If a dashboard with the same name already exists, a new one cannot be created with that name. However, existing dashboards with duplicate names will remain unchanged until edited.
Manage Dashboard Fields
You can click on the Horizontal Ellipsis to access these fields on the dashboard.
Field | Description |
Create | Create a dashboard from a usecase template or from scratch. |
Edit | Modify dashboard details such as name, folder and tags. |
Edit Layout | Arrange widgets to create desired dashboard layout. |
Clone | Create a copy to customize the dashboard further. |
Delete | Remove the dashboard for all the users. |
Share | Share access to the dashboard with users/user groups. |
Generate External Link | Generate a live external link for non-Sprinklr users to have view access. After selecting this option to export either a complete dashboard or a specific part of it, you can choose the export format as Presentations or JSON, then click on Export. |
Manage Drilldown | Configure Explore lens as standard drilldown for different metrics in this dashboard. |
Export | Export the dashboard in PDF, Excel, PNG, PPT, CSV & JSON formats. |
Generate Presentation | Generate a Sprinklr presentation from the dashboard. |
Activity | View all the changes made on the dashboard. |
Show Translated Text | Translate the message text in widgets to preferred language. |
Lock | Lock the dashboard to prevent accidental edits. |
Custom Interval | Customise the monthly or quarterly intervals used in charts. |
Extend | Create a child dashboard with similar configuration. |
Export Dashboard Mapping | A detailed description of fields used within widgets. |
Export to Snowflake | Quickly export widgets in this dashboard to a Snowflake table. |
Settings | Add additional settings to the dashboard. |
Dashboard Creation – Fields & Description
Field | Description |
Name of your Dashboard | Enter a name for your dashboard. |
Folder | Select the folder you want to put this dashboard. |
Use Tags to group similar Dashboards | Tag the dashboard to group that under similar dashboards. |
Do you wish to Auto Refresh the Dashboard? | Select frequency for automatically updation of your dashboard. |
Share this dashboard with user/user groups | Select the user/user groups with whom you want to share the dashboards. |
Schedule Reports for other users |
|