Agent Case Processing Time Report
Updated
The Agent Case Processing Time Report displays the total time agents spend on Cases using the Agent Console/Care Console or Third Pane. It includes overall time, timestamps, and counts of how often each Case was opened. This information helps supervisors track active working time on Cases based on the timer/clock added to the Care Console for each agent at the case level.
The Agent Case Processing Time Report belongs to the Agent Performance Report Group.
Below are some scenarios where the Agent Case Processing Time Report is beneficial:
Calculating the overall time spent by agents on Cases is based on the case processing clock.
Calculating the processing time split by each case and agent.
Analyzing the number of times a Case was opened and the processing start time for each Case.
Attribute | Status |
Behavior of User Custom Fields | User Custom fields are supported in this report. The field will show the value attribute for that field mapped against the 'Agent' Dimension. The User can use the Dimension Configurator to select whether to show the snapshot value or the current value of the field. |
Behavior of Case Custom Fields | Case-level Custom Fields (CF) are supported in this Report. Plotting any Case-level CF will display the value attribute for that field on the Case. The field shows the snapshot value of the field for the case. The Current Value of the Custom field can also be plotted by selecting "Current" in the Dimension Configurator. |
Date Filter | Processing Clock Start Time. |
Record Creation Time | Records are created for sessions when the processing clock pauses while agent leaves Console/Third Pane. |
Refresh Frequency | 5 minutes. |
Aggregation Supported | Supported at 15-minute intervals. |
Metrics and Dimensions
The following are the Metrics and Dimensions available under the Agent Case Processing Time Report:
This concludes our comprehensive coverage of the Agent Case Processing Time Report. For more details on the Reports available under Service Analytics, please refer to the Detailed Reports Glossary.
Case Process SLA Clock
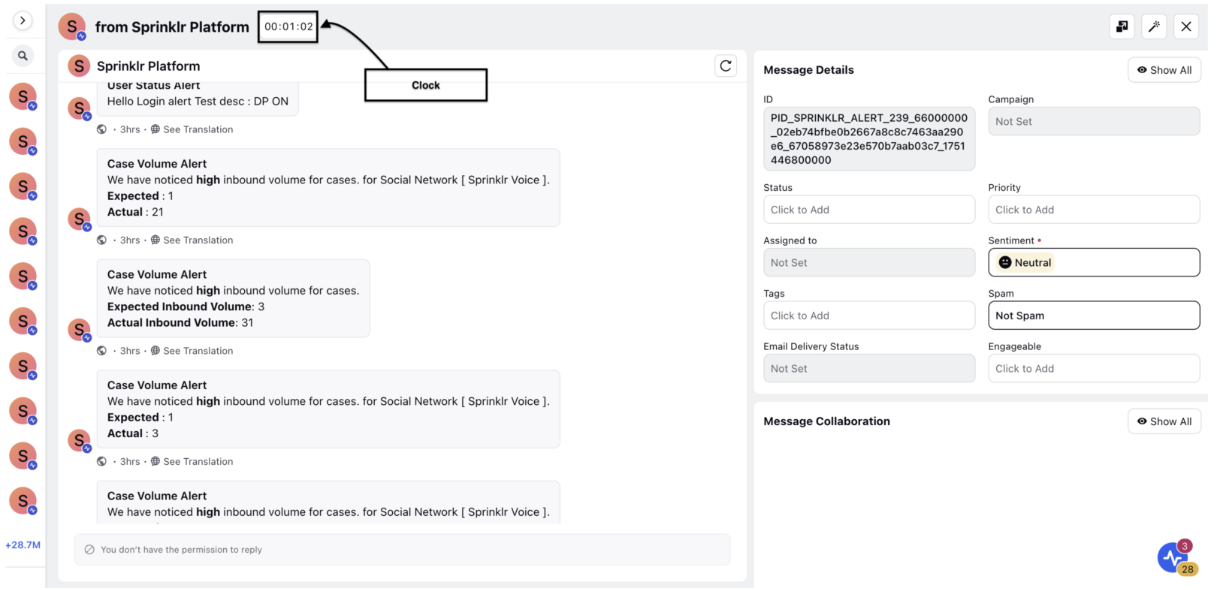
In the Care Console, a built-in clock helps track how much time an agent spends actively working on your case. The timer starts as soon as the agent opens your case and pauses if they switch tabs or step away. It automatically resumes when they return, ensuring only the actual time spent on your case is counted.
Even if an agent searches for your case using the case ID, it opens seamlessly in the third pane, and the clock keeps running to maintain accurate tracking.
This processing time gives a clear picture of how much focused attention your case is receiving. It’s a key part of measuring Total Handle Time and Average Handle Time (AHT), which helps teams improve response times and deliver better support for digital cases like yours.

Working of the Case Processing Clock Opened by assignee SLA Filter
Let's try and understand the working in details:
Case Assignment: A case is created and assigned to an agent.
Clock Starts: The clock starts from the moment the case is opened (in the 3rd pane or in the care console) and pauses once the case is moved out of sight.
The field “Case Processing Clock Opened by Assignee” as a dimension helps to identify who has accessed the case:
True: If opened by the assigned agent.
False: If opened by an agent who was not the assignee at the moment the clock was started.