Manage Forecast Scenarios
Updated
The Forecast Scenario is an entity in Sprinklr Service’s Workforce Management (WFM) module that predicts inbound traffic volume (Volume Forecast) for a specified time interval along with agents required to maintain the service level based on the Volume Forecast.
With integrated Forecasting and Capacity Planning, Forecast Scenario enables you to make more precise predictions and align staffing levels closely with actual needs. This reduces the risk of overstaffing or understaffing, which leads to lower labor costs and optimal volume handling. It also supports Daylight Saving Time (DST).
This section outlines the essential steps for managing Forecast Scenarios, including:
Understanding Forecast Scenario Record Manager
Creating Forecast Scenarios
Publishing Forecast Scenarios
Editing Forecast Scenarios
Sharing Forecast Scenarios
Deleting Forecast Scenarios.
Note: This feature is Dynamic Property (DP) controlled. Contact your Success Manager to enable this feature for your environment.
Note: The steps and information provided in this article pertain to Sprinklr WFM Version 2 (v2), which is the latest version. For information on Sprinklr WFM Version 1 (v1), please refer to the Version 1 section.
Understanding Forecast Scenario Record Manager
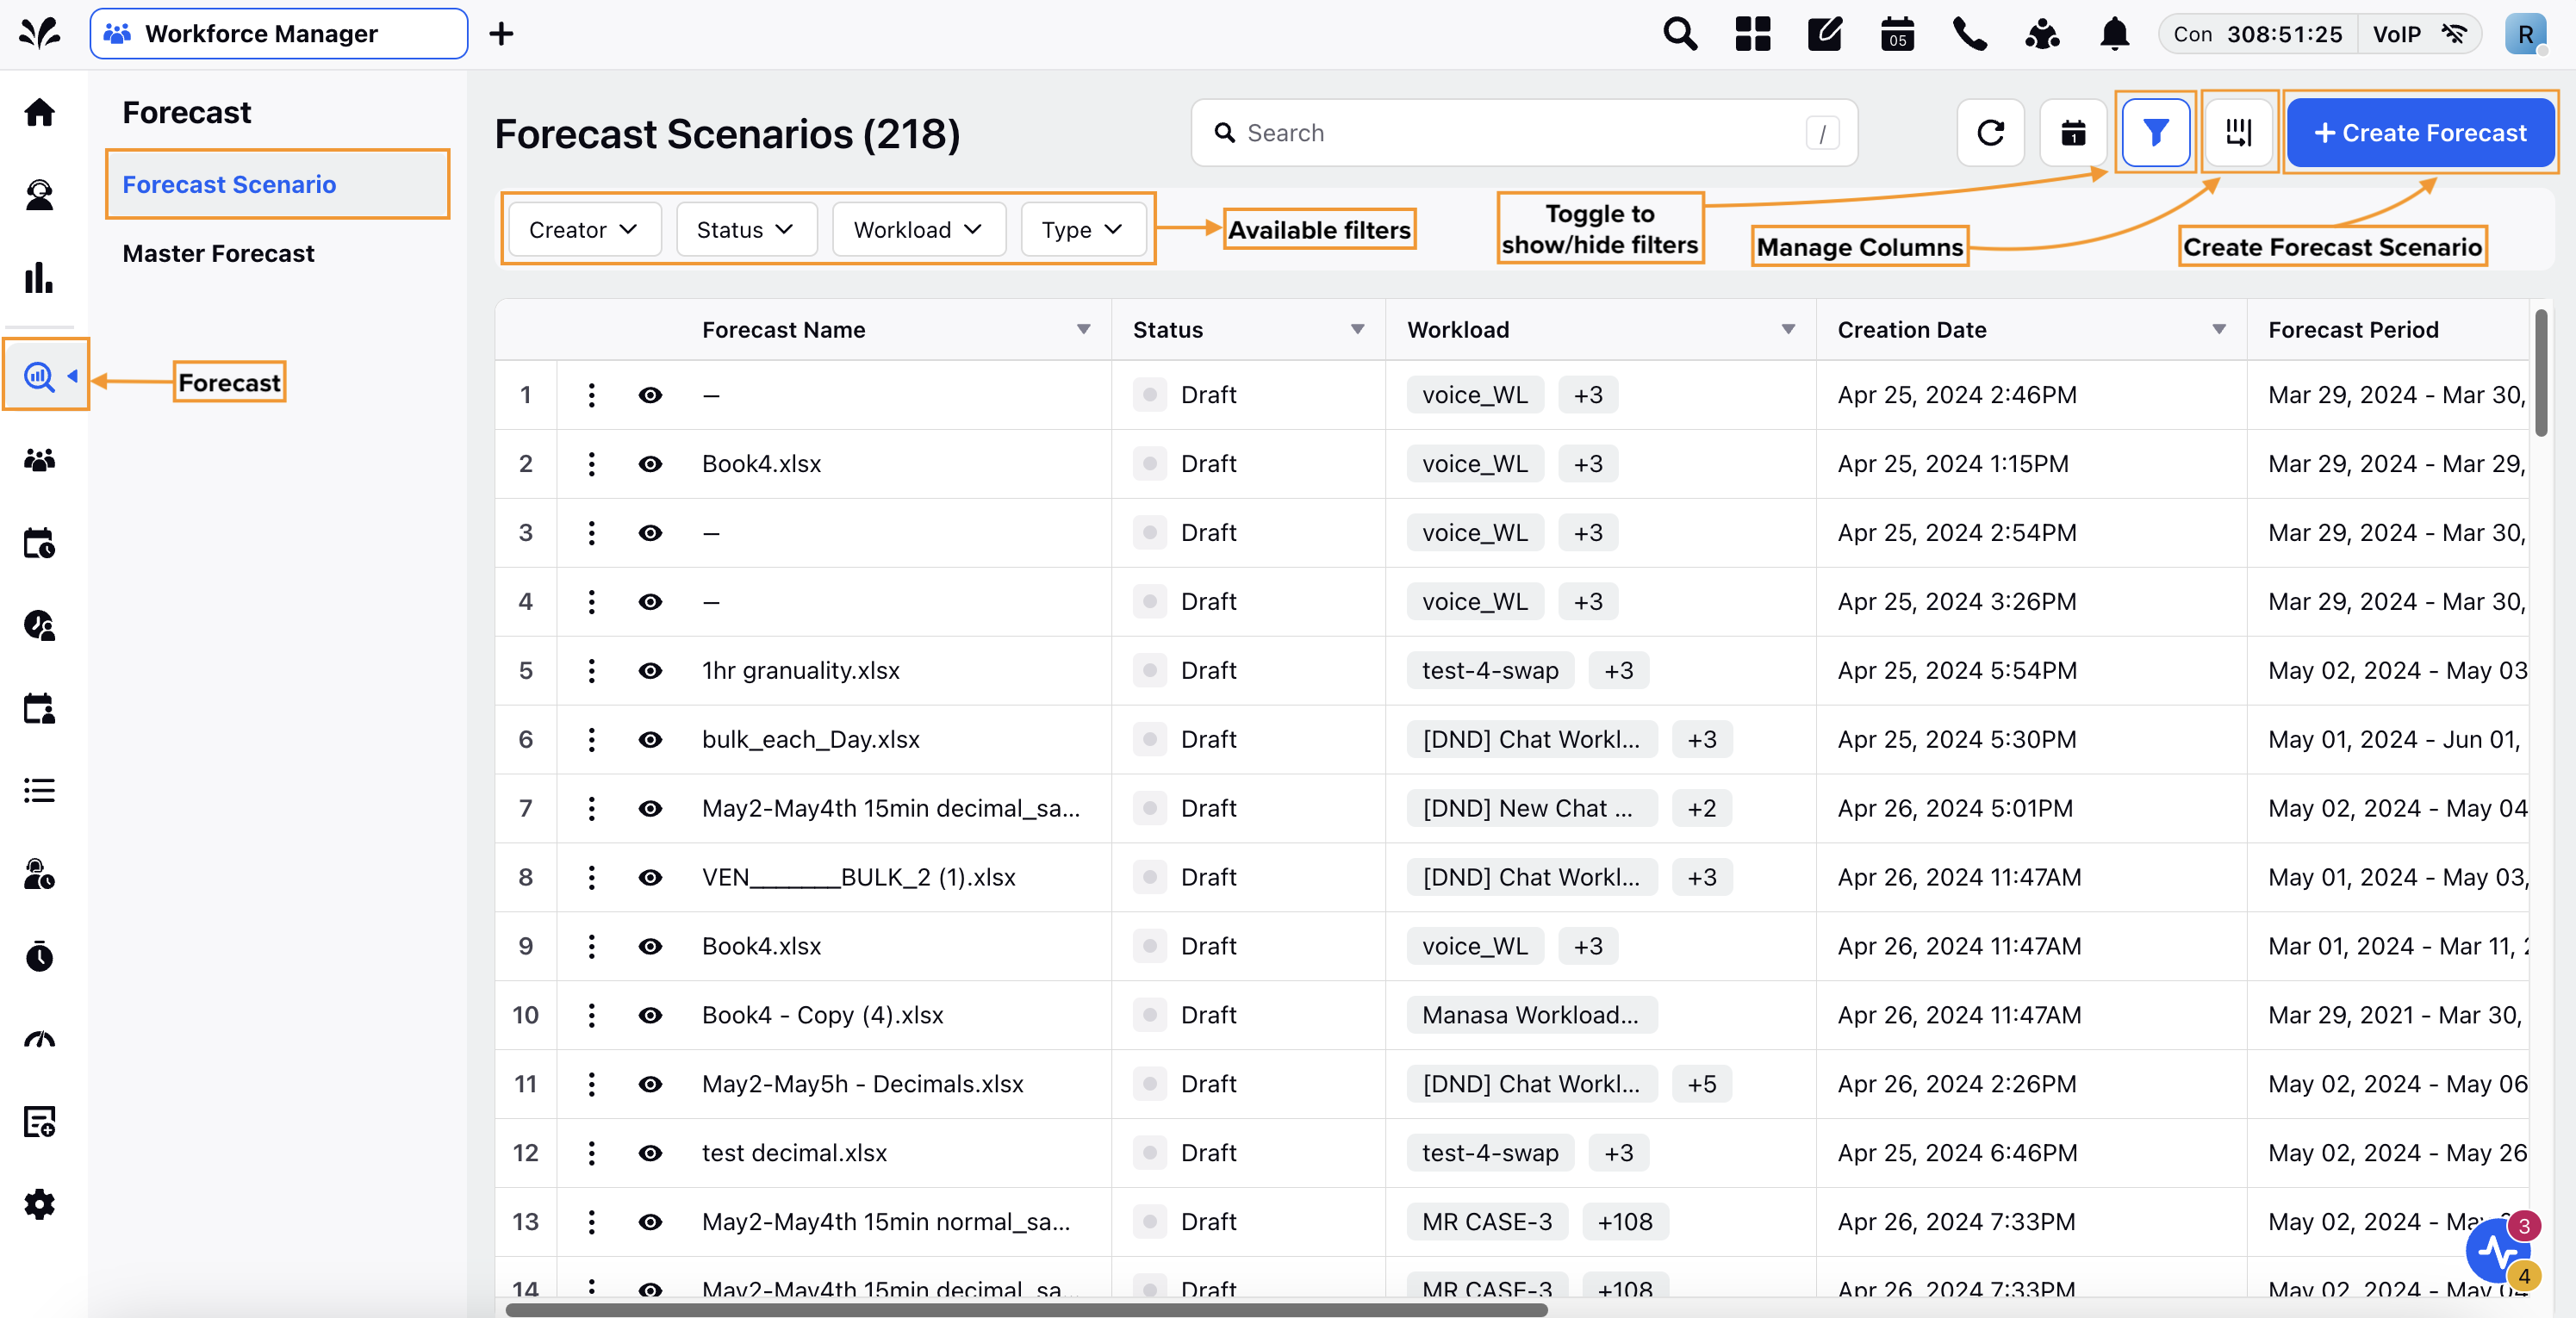
The Forecast Scenario Record Manager shows the list of all the Forecast Scenarios currently available, along with their overview. This page is a versatile hub where you can perform various actions on Forecast Scenarios, including creating, editing, changing release status, and viewing the type of Forecast Scenario.
Navigate to Forecast Scenario Record Manager
Follow these steps to navigate to Forecast Scenario Record Manager:
Go to the Workforce Manager Persona App on the Launchpad.
Select Forecast from the Left Pane to open the Forecast Scenario Record Manager.
The Forecast Scenario Record Manager has multiple columns that can be hidden or rearranged depending on your requirements or preferences. You can search for Forecast Scenarios by their names, and they can also be filtered based on Workloads, Type, Granularity, Status, and forecast Date Range. The Forecast Scenarios can be sorted by Creation Date and Last Modified in either ascending or descending order.

The following columns are available on the Forecast Scenario Record Manager:
Column Name | Description |
Name | This column shows the name of the Forecast Scenario. |
Workloads | This column shows the Workload(s) used for the Forecast Scenario. |
Type | This column shows the Type of the Forecast Scenario. It can be Run-time Model, Pre-trained Model, or Import. |
Granularity | This column shows the granularity at which the Forecast Scenario is generated. |
Status | This column shows the current status Forecast Scenario. It can be a Draft, Failed, or Released. |
Forecast Date Range | This column shows the date range for which the Forecast Scenario is generated. |
Creation Date | This column shows when the Forecast Scenario was created. |
Last Modified On | This column shows when the Forecast Scenario was last edited. |
Creator | This column shows which user created the Forecast Scenario. |
Create Forecast Scenario
Forecast Scenarios can be created using the Run-Time Model, Pre-Trained Model, or imported. The Run-time Model is suitable if your contact center already uses the Sprinklr Service module for on-the-fly forecasting using historical data. The Pre-trained Model is suitable for generating Forecast Scenarios using an existing custom-trained model.
Create Forecast Scenario Using Run-Time Model
Prerequisites for creating Forecast Scenarios:
Sprinklr WFM should be enabled for the environment.
You must have access to the Workforce Manager Persona App.
Follow these steps to create a Forecast Scenario using Run-Time Model:
Go to the the Workforce Manager Persona App on the Launchpad.

Select Forecast from the Left Pane to open the Forecast Scenario Record Manager.
Click the Create Forecast Scenario button at the top right of the page to open the Forecast Scenario creation page.
Fill in the required fields on the Forecast Scenario creation page. Fields marked with a red dot are mandatory. Below are the descriptions of the fields on this page:
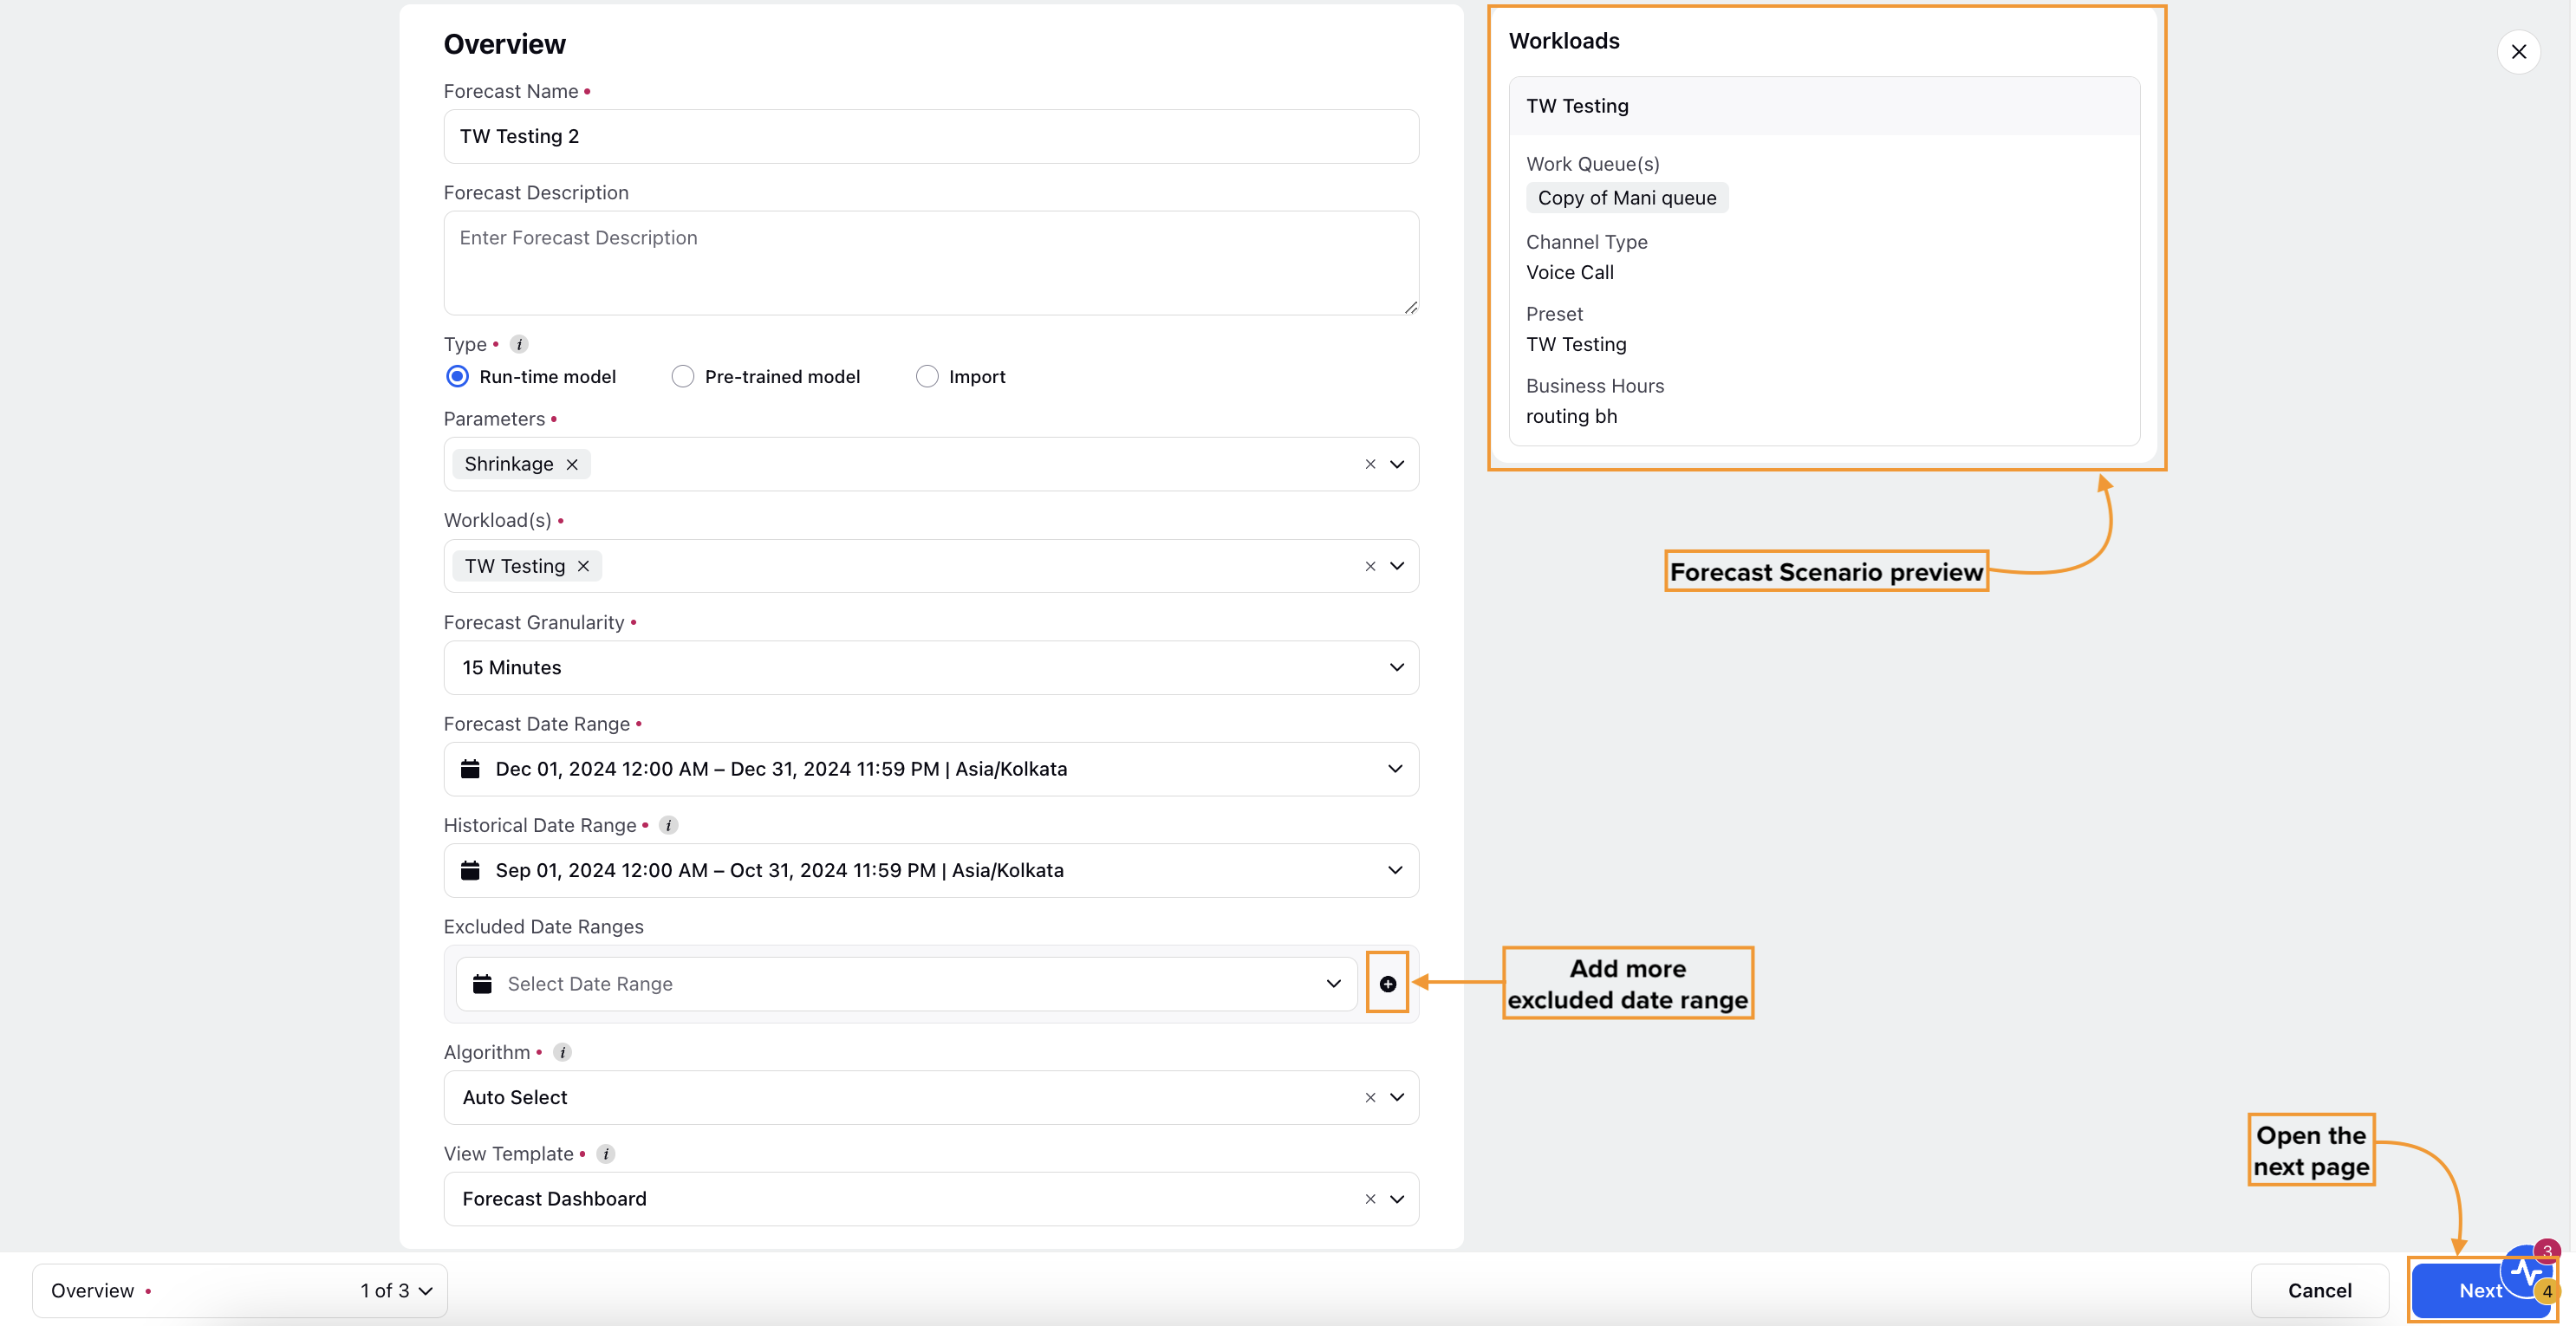
Forecast Name: Enter a unique and descriptive name for the Forecast Scenario. This name will be used to identify the Forecast Scenario within the system. (Required)
Description: Provide a summary or explanation of the Forecast Scenario.
Type: Select Run-time model. (Required)
Algorithm: Select from the available algorithm options. By default, Auto Select is pre-selected. (Required)
Prophet: Prophet is based on an additive model where non-linear trends are fit with yearly, weekly, and daily seasonality, plus holiday effects. It works best with time series with strong seasonal effects and several seasons of historical data.
ARIMA: ARIMA combines elements of Differencing, Moving Average, and Auto-Regression. In time-series data, it works well for capturing seasonality and linear patterns.
SARIMAX: SARIMAX extends the capabilities of the ARIMA model by incorporating exogenous variables, making it a versatile choice for forecasting.
Weighted Moving Average: Weighted Moving Average (WMA) assigns different weights to historical data points, giving more importance to certain periods. It allows you to emphasize specific weeks based on their relevance.
Seasonal Naive: The Seasonal Naive algorithm is useful when there is clear seasonality in the data, and you expect that patterns from previous seasons will repeat without much change.
Triple Exponential Smoothing: Triple Exponential Smoothing (TES), also known as Holt-Winters Exponential Smoothing, is used to forecast seasonal and trend-based data. It is suitable for complex and fluctuating patterns in customer support requests.
Simple Exponential Smoothing: The Simple Exponential Smoothing (SES) algorithm is used for data that assumes no trend or seasonality. It is useful for short-term forecasting where the data does not exhibit strong seasonal patterns.
Note: The Seasonal Naive, Triple Exponential Smoothing, and Simple Exponential Smoothing algorithms are used only when the Auto Select option is selected. You cannot explicitly select these algorithms for your Forecast Scenario.
Parameters: Select parameter(s) for your Forecast Scenario. (Required)
Workload(s): Select the Workload(s) associated with the selected parameter(s). You can only select a Workload if a parameter is selected. The available Workload(s) in this list will be those that include the selected parameter(s) as their constituent. (Required)
Note: Only Parent Workloads and Independent Workloads are available for selection in the list.
Forecast Date Range: Enter the beginning and ending date and time for which the Forecast Scenario will be generated. (Required)
Historical Date Range: Enter a historical date and time range based on which the Forecast Scenario will be created. For optimal accuracy, a minimum duration of two weeks is required. (Required)
Excluded Date Ranges: Enter the date and time range to be excluded from the above historical date range. Click the ‘+’ symbol to enter more than one date range to exclude.
No. of Historical Weeks: Specify how many weeks of historical data, starting from today, the system should use to train the AI model for this Forecast Scenario. It must be an integer greater than or equal to 2. (Required)
Note: The No. of Historical Weeks field will appear only when Weighted Moving Average is selected in the Algorithm field.
Note: The Historical Date Range and Excluded Date Ranges fields will not appear when Weighted Moving Average is selected in the Algorithm field.
View Template: Select a view to visualize the parameters. (Required)
Click the Next button at the bottom right of the page to open the Weightage Distribution page.
Note: The Weightage Distribution page will appear only when Weighed Moving Average is selected in the Algorithm field.
This page allows you to assign a specific weight to each historical week. These weights determine how much influence each week’s data will have when generating the Forecast Scenario.
Apply Equal Weight: Enable this toggle to assign equal weight to all historical weeks in the Forecast Scenario calculation. For example, if 5 historical weeks are selected, each will be weighted at 20%.
Alternatively, you can assign different weights to each historical week based on your needs.
Note: The total weightage of all the historical weeks must be 100%.
Click the Next button at the bottom right of the page to open the Detect Event page.
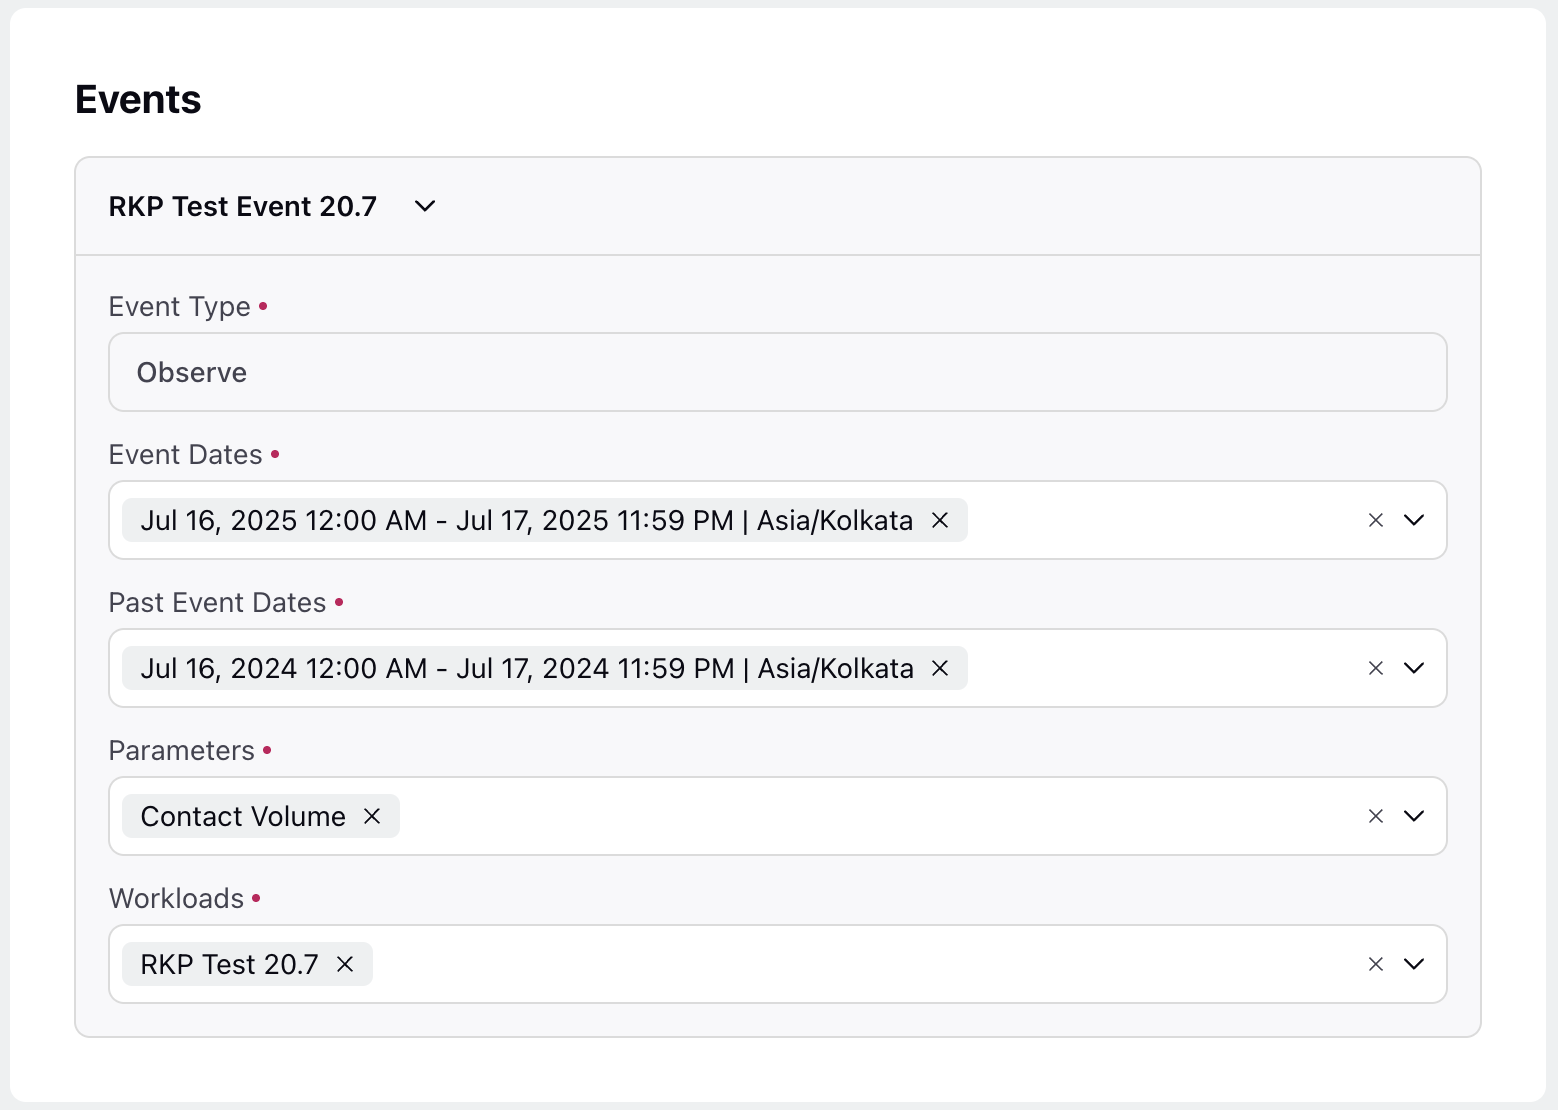
Select any pre-existing Event(s) on the Detect Events page that you want to consider in the Forecast Scenario.
Click the Save button at the bottom right of the page to create the Forecast Scenario.
This completes the Forecast Scenario creation process using Run-Time Model.
Create Forecast Scenario Using Pre-Trained Model
Prerequisites for creating Forecast Scenarios:
Sprinklr WFM should be enabled for the environment.
You must have access to the Workforce Manager Persona App.
Follow these steps to create a Forecast Scenario using Pre-Trained Model:
Go to the Workforce Manager Persona App on the Launchpad.

Select Forecast from the Left Pane to open the Forecast Scenario Record Manager.
Click the Create Forecast Scenario button at the top right of the page to open the Forecast Scenario creation page.
Fill in the required fields on the Forecast Scenario creation page. Fields marked with a red dot are mandatory. Below are the descriptions of the fields on this page:

Forecast Name: Enter a unique and descriptive name for the Forecast Scenario. This name will be used to identify the Forecast Scenario within the system. (Required)
Description: Provide a summary or explanation of the Forecast Scenario.
Type: Select the Pre-trained model option. (Required)
Parameters: Select parameter(s) for your Forecast Scenario. (Required)
Workload(s): Select the Workload(s) associated with the selected parameter(s). You can only select a Workload if a parameter is selected. The available Workload(s) in this list will be those that include the selected parameter(s) as their constituent. (Required)
Forecast Date Range: Enter the beginning and ending date and time for which the Forecast Scenario will be generated. (Required)
View Template: Select a view to visualize the parameters. (Required)
Click the Save button at the bottom right of the page to create the Forecast Scenario.
This completes the Forecast Scenario creation process using Pre-Trained Model.
Import Forecast Scenario
Prerequisites for creating Forecast Scenarios:
Sprinklr WFM should be enabled for the environment.
You must have access to the Workforce Manager Persona App.
Follow these steps to import a Forecast Scenario:
Go to the Workforce Manager Persona App on the Launchpad.

Select Forecast from the Left Pane to open the Forecast Scenario Record Manager.
Click the Create Forecast Scenario button at the top right of the page to open the Forecast Scenario creation page.
Fill in the required fields on the Forecast Scenario creation page. Fields marked with a red dot are mandatory. Below are the descriptions of the fields on this page:

Forecast Name: Enter a unique and descriptive name for the Forecast Scenario. This name will be used to identify the Forecast Scenario within the system. (Required)
Description: Provide a summary or explanation of the Forecast Scenario.
Type: Select the Import option. (Required)

Upload Forecast: Upload the Template file with details of the Forecast Scenario. Refer to the Important Considerations for Importing Forecast Scenario section below for details on the headers of the data import template. (Required)
Timezone: Select the time zone of the start date and time value entered in the “startTime” header in the import template.
View Template: Select a view to visualize the parameters
Date Pattern: Select the date and time value format entered in the “startTime” header in the import template, such as DD-MM-YYYY, MM-DD-YYYY, MM/DD/YYYY, or DD/MM/YYYY. Date patterns that include "AM/PM" at the end indicate a 12-hour format, while those without "AM/PM" use a 24-hour format.
Note: It is mandatory to provide the timestamp for each Date Pattern in HH:MM:SS format.
Click the Save button at the bottom right of the page to import the Forecast Scenario.
Important Considerations for Importing Forecast Scenario
CSV, XLS, and XLSX are the approved file formats.
A Workload ID can be the exact ID, the Name, or any alphanumeric value. Once imported, the system will ask for the Workload ID to be mapped exactly to the already existing Workloads.
You must create the Workloads as per your naming convention.
Ensure no duplicate values are present for the same ‘timestamp’ and ‘workloadIds’ in the file.
Verify all forecast values are present for each ‘timestamp’ and ‘workloadId’ according to the specified granularity. For example, with a 30-minute granularity over 30 days, there should be exactly 1440 rows for each ‘workloadId’.
Confirm the epoch is in GMT, like other models, and ensure the granularity is not less than 15 minutes.
It is mandatory to provide the timestamp for each Date Pattern in HH:MM:SS format.
The following headers are mandatory in the file (Do not modify the header, including their case):
Parameter | Header | Remarks |
Start Date and Time | startTime | Recommended format: |
Workload ID | workloadId | Does not support decimal points; requires whole numbers. |
Average Handling Time (AHT) | averageHandleTime | The unit of this header is seconds. It must be a numeric value greater than 0. |
Inbound Volume | volume | Should be >=0. Supports decimal point. |
Service Level Goal | ServiceLevelGoal | It must be a percentage value, that is greater than 0 and less than 100. |
Service Time | ServiceTime | The unit of this is header is seconds. The value must be greater than 0. |
Maximum Occupancy | maxOccupancy | It must be a percentage value, that is greater than 0 and less than 100. |
In-office Shrinkage | inOfficeShrinkage | Percentage value. It must be greater than 0 and less than 100. |
Out-of-Ofice Shrinkage | outOfOfficeShrinkage | Percentage value. It must be greater than 0 and less than 100. |
Required Full Time Equivalents (FTEs) | requiredFTEs | The value must be greater than 0. |
This completes the process of importing a Forecast Scenario.
Publish Forecast Scenario
Prerequisites for publishing Forecast Scenarios:
Sprinklr WFM should be enabled for the environment.
You must have access to the Workforce Manager Persona App.
View and Publish permissions under the Forecasting section in the Workforce Management module.
Existing Forecast Scenario.
Follow these steps to publish a Forecast Scenario:
Go to the Workforce Manager Persona App on the Launchpad.

Select Forecast from the Left Pane to open the Forecast Scenario Record Manager.
Click the View Forecast (eye icon) button corresponding to the Forecast Scenario to be published. This will open a detailed view of the Forecast Scenario.

Click the Publish button at the top right of the page.
This completes the process of publishing a Forecast Scenario.
Edit Forecast Scenario
Prerequisites for editing Forecast Scenarios:
Sprinklr WFM should be enabled for the environment.
You must have access to the Workforce Manager Persona App.
Existing Forecast Scenario.
Follow these steps to share a Forecast Scenario:
Go to the Workforce Manager Persona App on the Launchpad.
Select Forecast from the Left Pane to open the Forecast Scenario Record Manager.

Hover over the vertical ellipsis (⋮) icon corresponding to the Forecast Scenario you want to edit. This will show a list of options.
Select Edit from the list of options to open the Forecast Scenario editing page.
Update the necessary details for the selected Forecast Scenario. The fields are the same as those used when creating a Forecast Scenario.
After entering the updated details, click the Save button at the bottom right of the page to save the Forecast Scenario with new details. Depending on the Type of the Forecast Scenario, the Save button will be on the Overview page (Pre-trained model and imported) or the Detect Events page (Run-time model).
This compeletes the process of editing a Forecast Scenario.
Share Forecast Scenario
Prerequisites for sharing Forecast Scenarios:
Sprinklr WFM should be enabled for the environment.
You must have access to the Workforce Manager Persona App.
Existing Forecast Scenario.
Follow these steps to share a Forecast Scenario:
Go to the Workforce Manager Persona App on the Launchpad.
Select Forecast from the Left Pane to open the Forecast Scenario Record Manager.
Hover over the vertical ellipsis (⋮) icon corresponding to the Forecast Scenario you want to share. This will show a list of options.

Select Share from the list of options to open the Share With dialog box.
Fill in the required fields. Below are the descriptions of the fields on this dialog box:
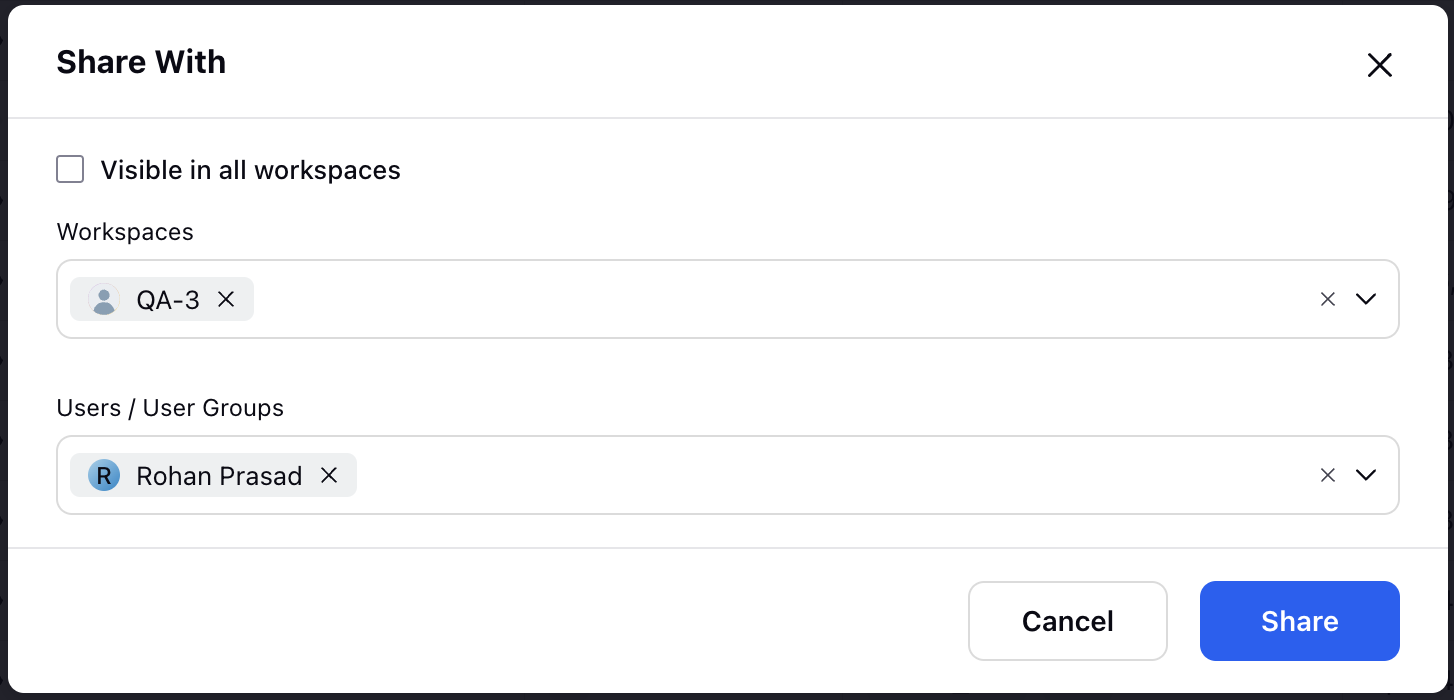
Visible in all workspaces: Select this checkbox to share the Forecast Scenario with all available Workspaces.
Workspaces: Select the Workspace(s) you want to share the Forecast Scenario with. This field is accessible only if the Visible in all workspaces field is not selected.
User/User Groups: Select the User(s)/User Group(s) you want to share the Forecast Scenario with. This field is accessible only if the Visible in all workspaces field is not selected.
Click the Share button located at the bottom right of the dialog box. This will share the Forecast with the selected Workspace(s) and User(s)/User Group(s).
This completes the process of sharing a Forecast Scenario.
Delete Forecast Scenario
Prerequisites for deleting Forecast Scenarios:
Sprinklr WFM should be enabled for the environment.
You must have access to the Workforce Manager Persona App.
Existing Forecast Scenario.
Follow these steps to delete a Forecast Scenario:
Go to the Workforce Manager Persona App on the Launchpad.
Select Forecast from the Left Pane to open the Forecast Scenario Record Manager.

Hover over the vertical ellipsis (⋮) icon corresponding to the Forecast Scenario you want to delete. This will show a list of options.
Select Delete from the list of options to open the Delete Forecast dialog box.

Select Submit to delete the Forecast Scenario. This action cannot be undone.
Note: This would delete all the associated Split Profiles and Child Forecast Scenarios.
This completes the process of deleting a Forecast Scenario.
Export Forecast Scenario Data
Exporting Forecast Scenario data allows you to save and analyze data outside the application. Once exported, the data can be used for further analysis, reporting, or sharing with stakeholders, providing flexibility and convenience in managing your Forecast Scenarios.
Follow these steps to export Forecast Scenario data from the tabular view:
Navigate to the Forecast Scenarios Record Manager.

Click the View Forecast (eye icon) button corresponding to the Forecast Scenario that you want to export. This will open a page with details of the Forecast Scenario.

Click the Switch to Table View button to view the Forecast Scenario data in tabular format.

Click the Export button at the top right of the page. This will open the Export Forecast dialog box.
Fill in the required fields on the Export Forecast dialog box. Fields marked with a red dot are mandatory. Below are the descriptions of the fields on this dialog box:
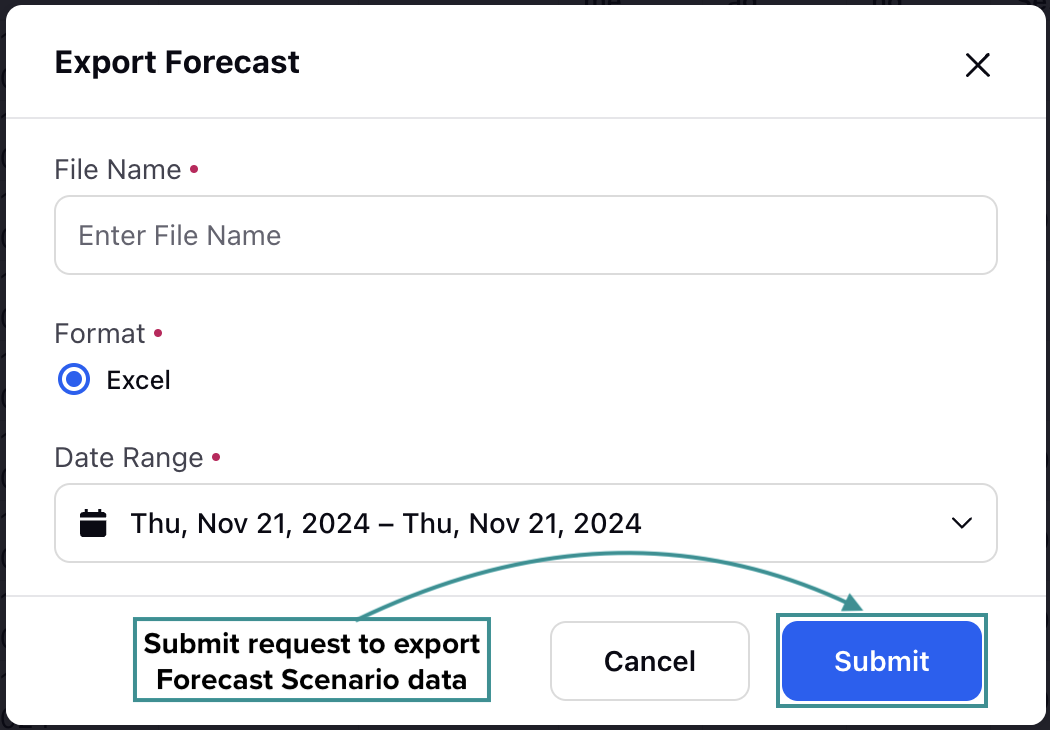
File Name: Enter a unique and descriptive name for the exported file. (Required)
Format: Excel is selected by default. (Required)
Date Range: Select the date range for exporting data. This range must fall within the Forecast Period. (Required)
Click the Submit button at the bottom right of the dialog box to submit the export request.

You will receive a system notification confirming your export request. A link to download a zip folder containing the Forecast Scenario data will be provided shortly after.
Inline Updates to Forecast Scenario Data
Inline updates to Forecast Scenario data allow you to update forecasted entries, like volume, Average Handling Time (AHT), or any other input parameter in real time. Making inline changes also updates the related parameters in real-time according to the changes made.
Follow these steps to make inline updates to Forecast Scenario data:
Navigate to Forecast Scenarios Record Manager.

Click the View Forecast (eye icon) button corresponding to the Forecast Scenario for which you want to modify the data. This will open a page with details of the Forecast Scenario.

Click the Switch to Table View button to view the Forecast Scenario data in tabular form.
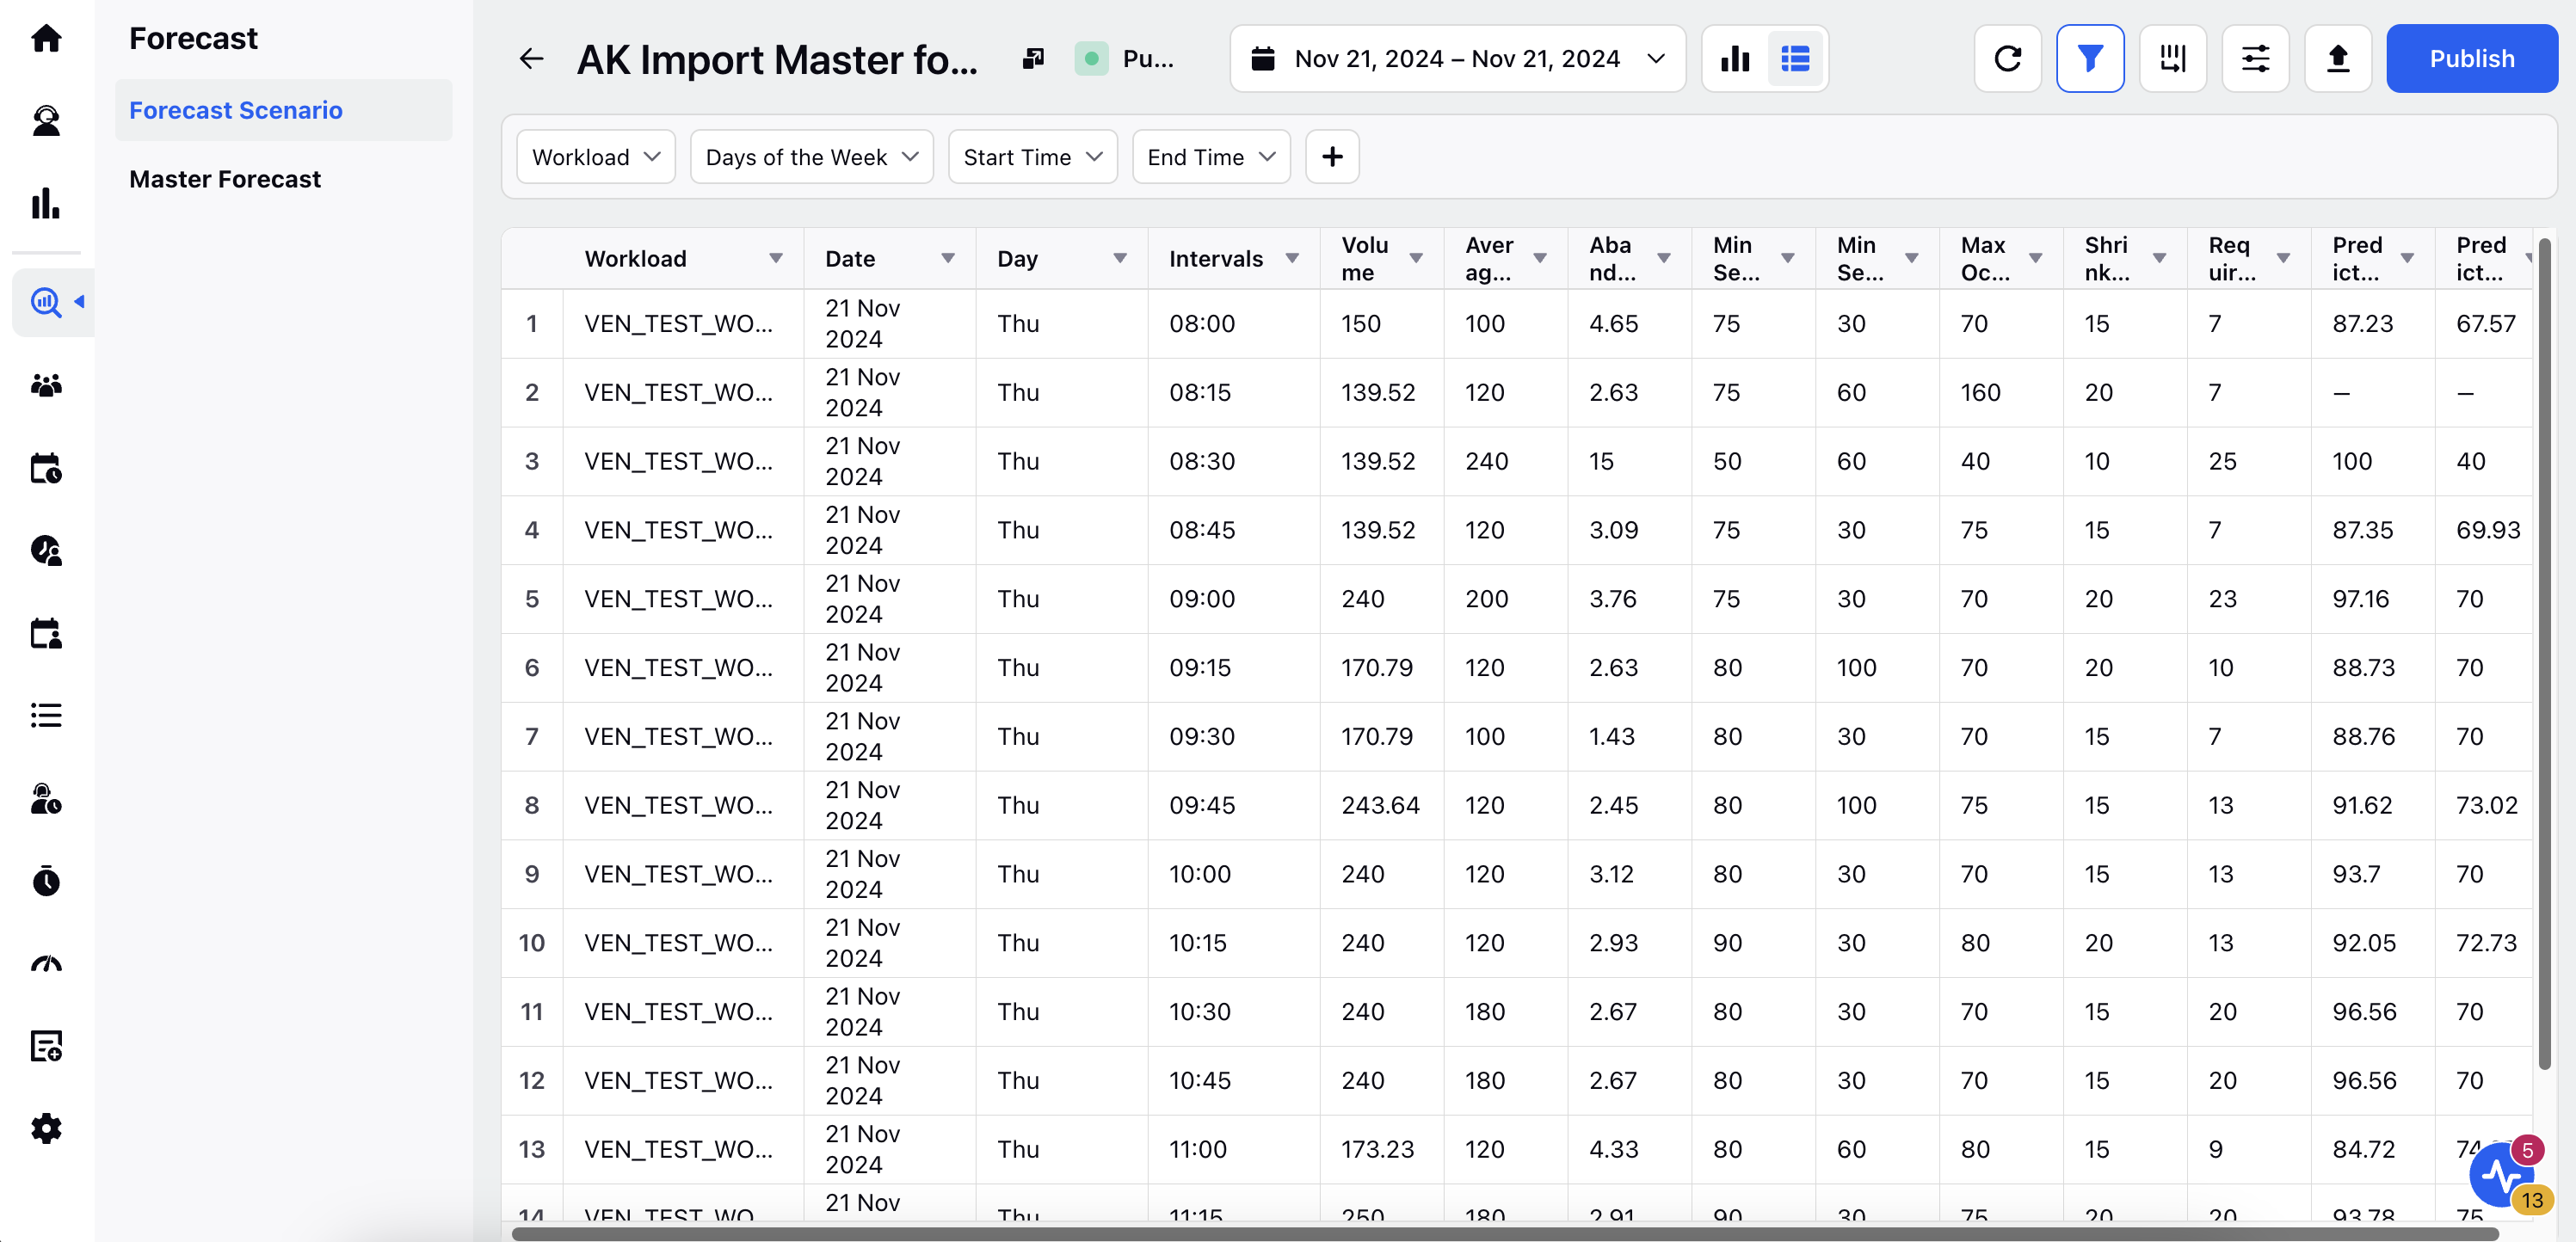
This page shows the Forecast Scenario data according to the Workload and the forecast's time stamp (Date, Day, Interval). Each row displays denotes the default granularity (15 or 30 minutes) configured for your Workspace. The columns provide details on the Forecast Scenario parameters, such as volume, Average Handle Time (AHT), predicted occupancy, and more. This means each cell contains the parameter (column) details for the specific time stamp (row).
Note: The Intervals column shows the time in 24-hour format.
Depending on the parameter and time stamp for which you want to update the data, double-click on the required cell corresponding to the time stamp. For example, if you want to update the volume for 10:15 AM on November 21, 2024, scroll down to the row for 10:15 on that date. The cell under the Volume column in this row is the one you need to update.
Note: The Volume column cannot be updated inline for Split Forecast Scenarios.
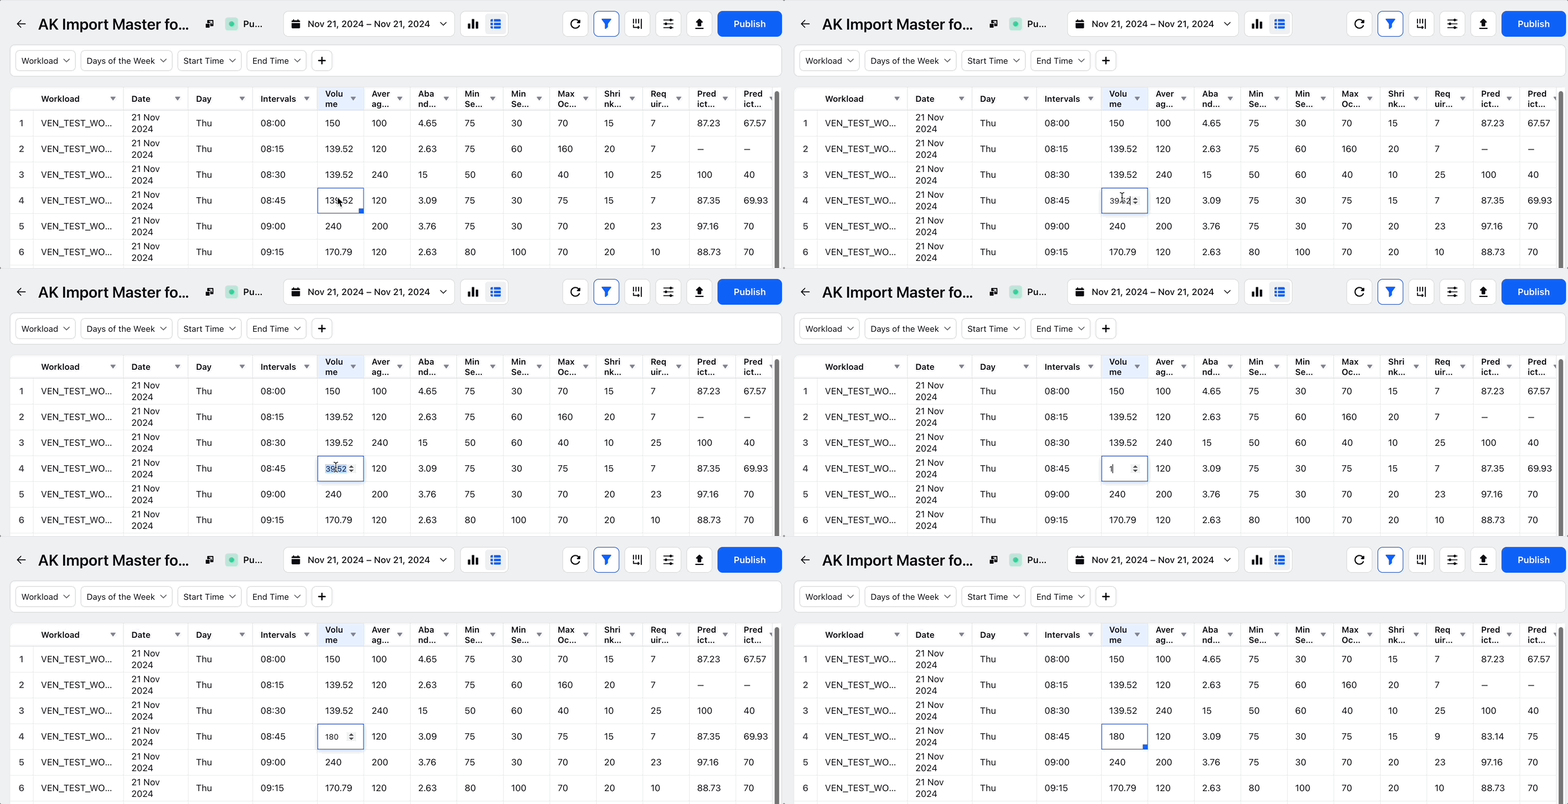
Double-click it to edit the data once you have identified the correct cell. Enter the updated information and press Enter on your keyboard to save the changes. This will also update the data in any other related cells.
The value of a cell can be copied and pasted to any other cell as long as it adheres to the column's constraints. For example, cells in the Minimum Service Goal column cannot have a value greater than 100.
Note: You can quickly copy a cell's data to other cells in the same column by clicking and dragging the bottom right corner of the cell up or down.

This completes the process of inline editing Forecast Scenario data.
Audit Trail for Forecast Scenario
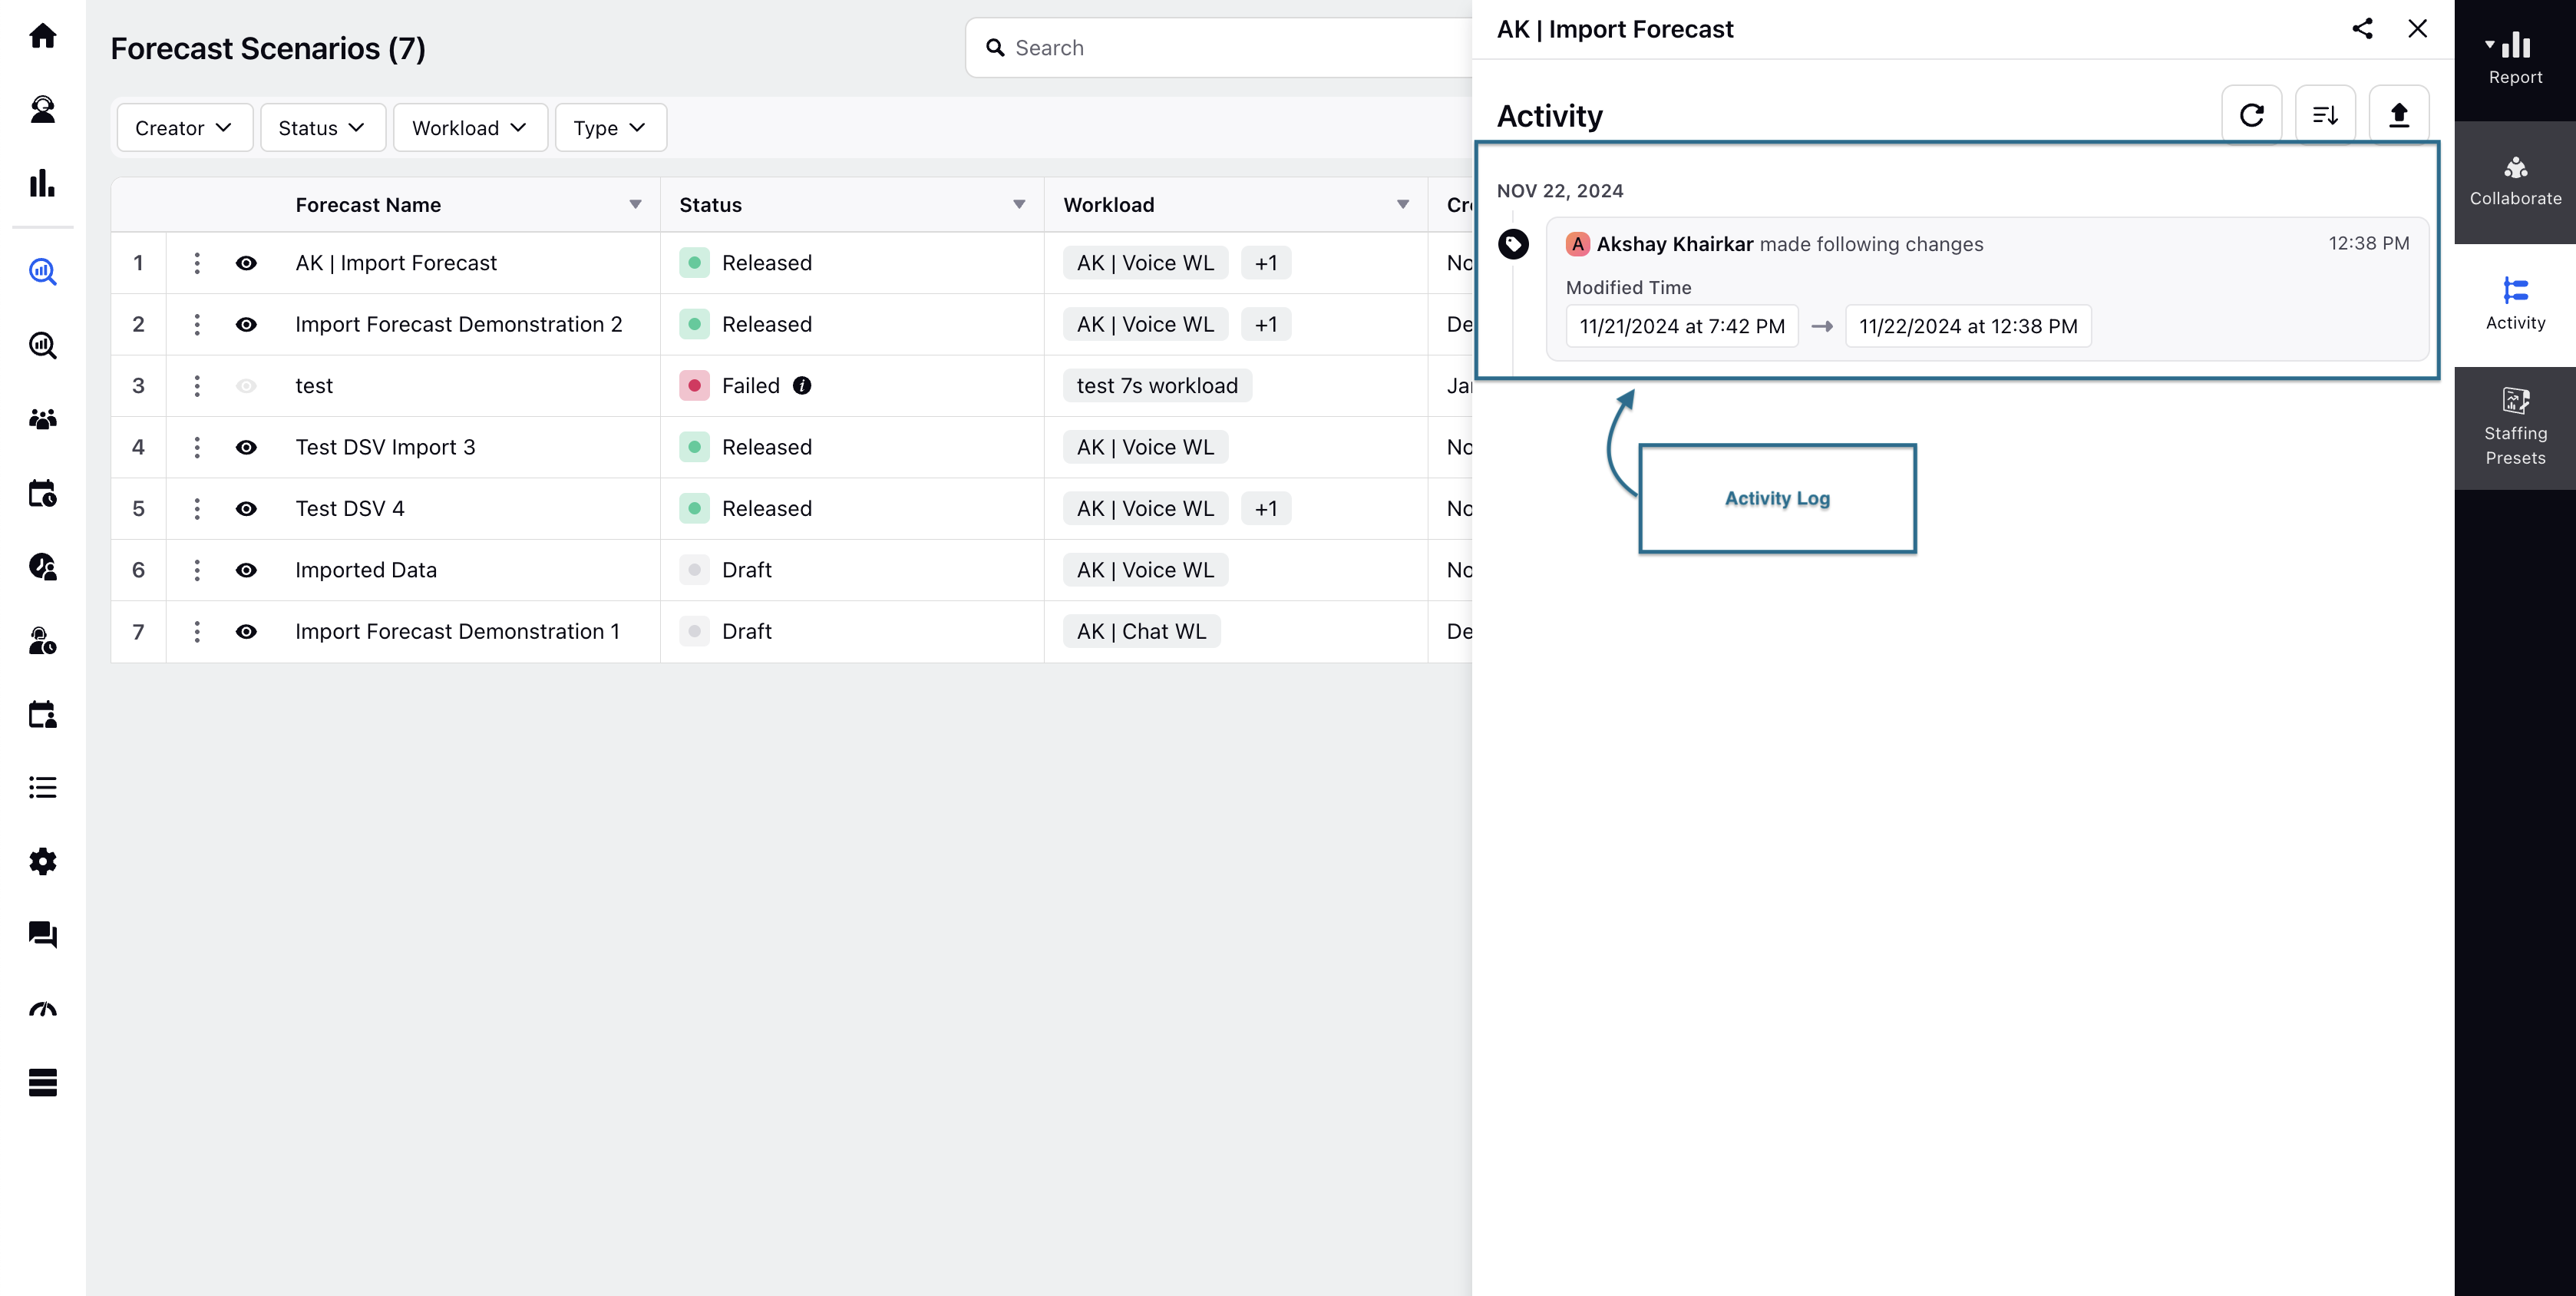
The Audit Trail feature allows you to track all changes within the Forecasting and Scenario Planning modules. It logs every activity, from minor updates to major changes, complete with date and time stamps along with details of the user who has made changes for full transparency and traceability.
Prerequisites for Audit Trail Support:
Sprinklr WFM should be enabled for the environment.
You must have access to the Workforce Manager Persona App.
Existing Forecast Scenario.
Follow these steps to access Audit Trail for Forecast Scenario:
Go to the Workforce Manager Persona App on the Launchpad.
Select Forecasting from the Left Pane to open the Forecast Scenario Record Manager.
Hover over the Vertical Ellipsis (⋮) icon corresponding to the Forecast Scenario for which you want to view the Audit Trail.
Select View Audit .

Audit Trail will open in the right pane.
