Benchmarking-Owned Content Performance with Industry Average on TikTok
Updated
TikTok benchmarking dashboard compares your owned accounts engagement metrics with the industry averages. To access TikTok benchmarking data in Sprinklr, TikTok business accounts must be connected and authenticated. Unlike other social channels supported in benchmarking, TikTok doesn't support addition of public URLs. The pre-requisite to compare the engagement metrics of your owned brand content with that of the industry average, business account authentication is a must. Please refer to the article for the TikTok business account authentication process.
Note: DP must be enabled to access TikTok Benchmarking.
Navigation Steps to access TikTok Benchmarking Dashboard
Let's have a look at the steps to navigate to the TikTok Benchmarking Dashboard.
Click + New Page > Sprinklr Insights > Benchmarking Dashboards (under Learn).
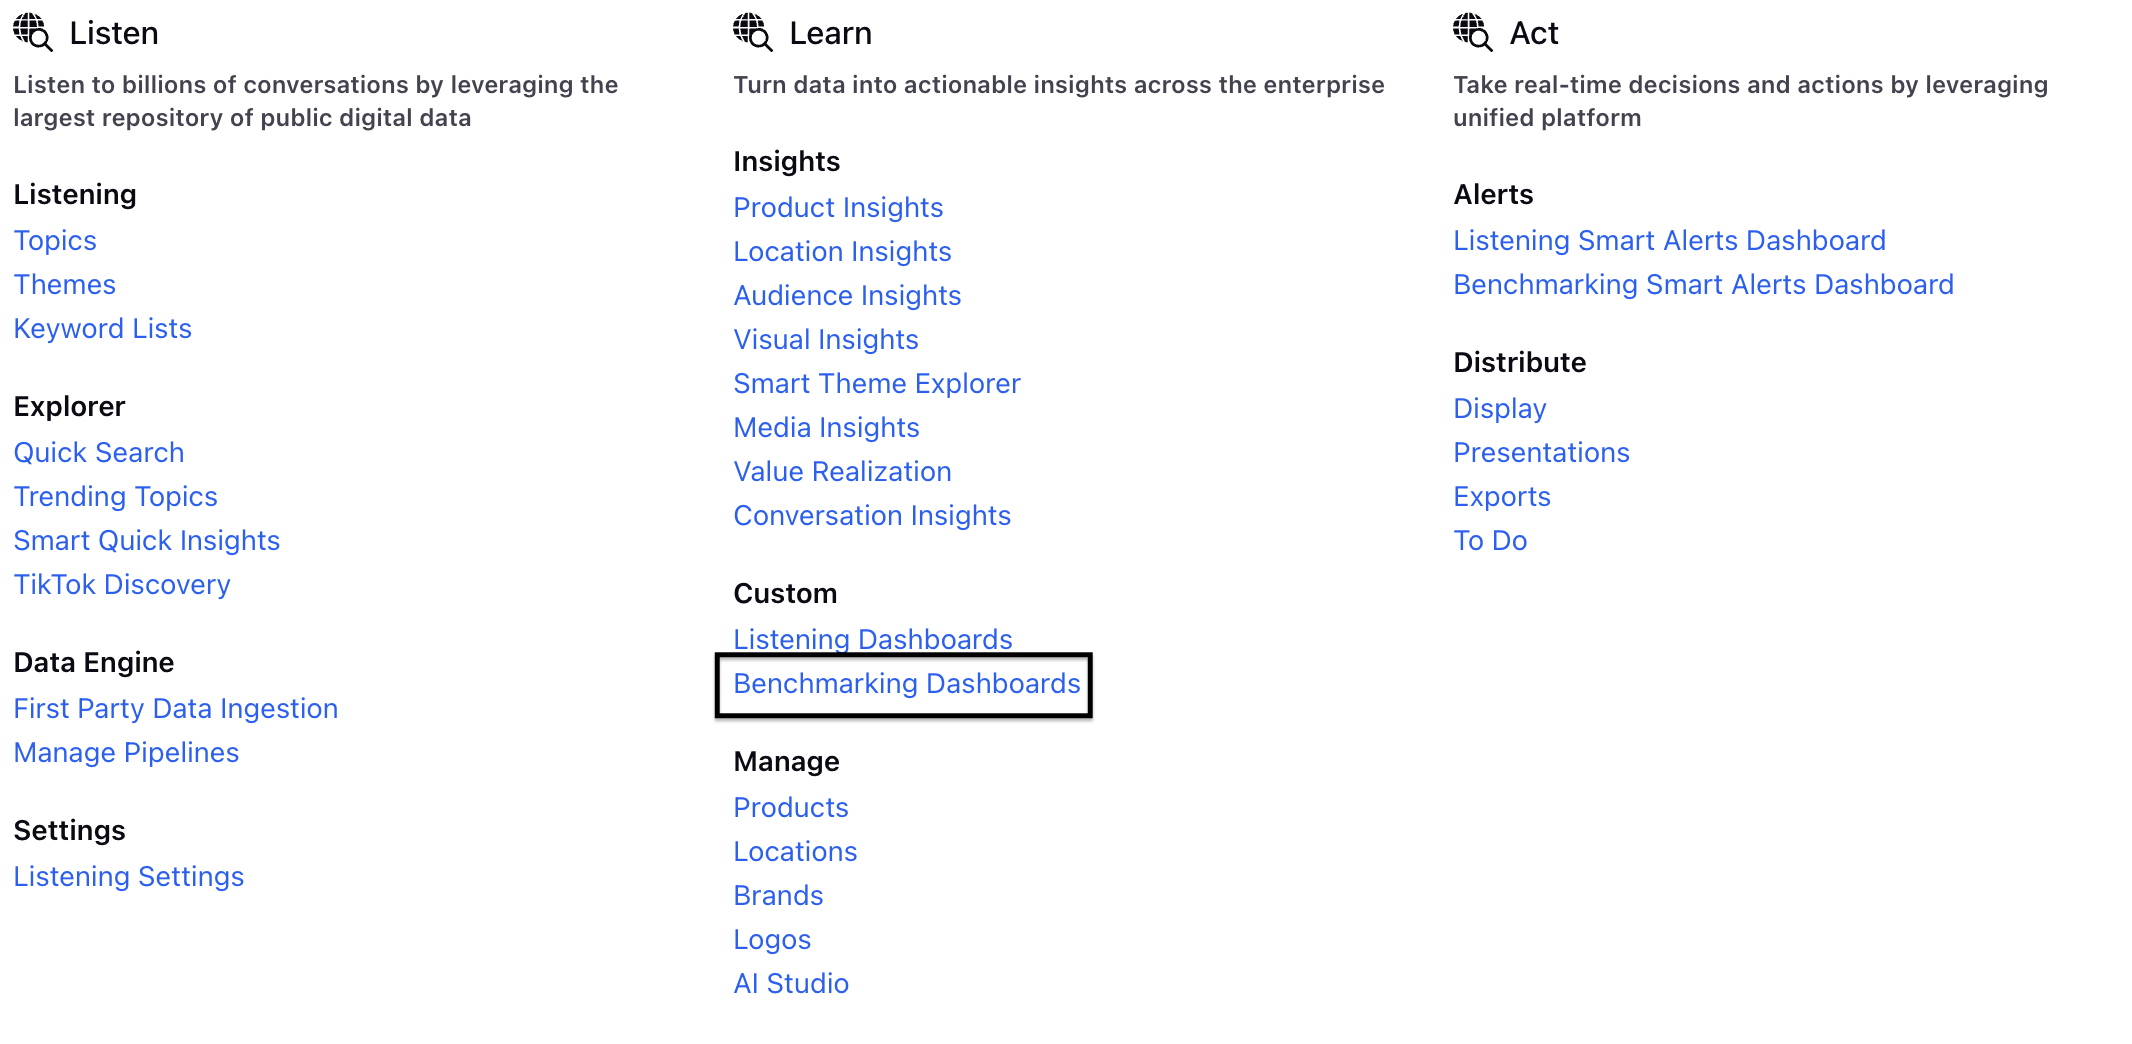
Click the drop down next to Benchmarking Dashboard on the top left.
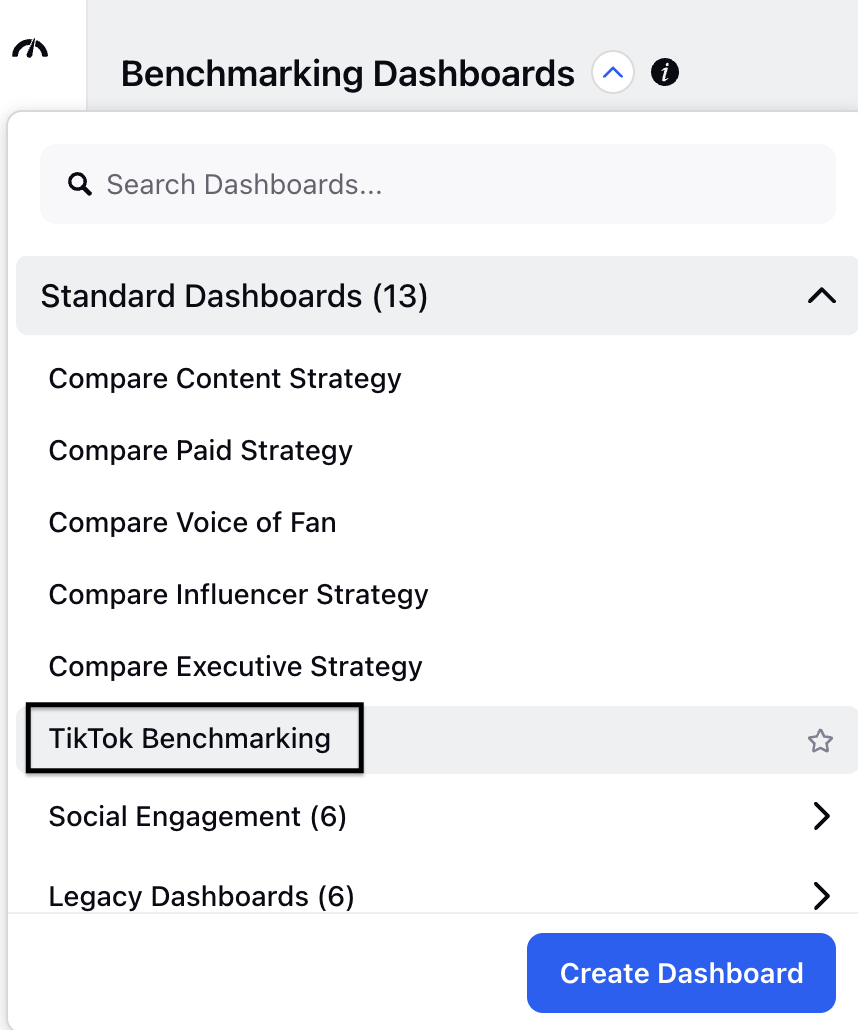
Select TikTok Benchmarking Dashboard within Standard Dashboards list.
Click + Add Filters in TikTok Benchmarking dashboard and select your TikTok authenticated account.
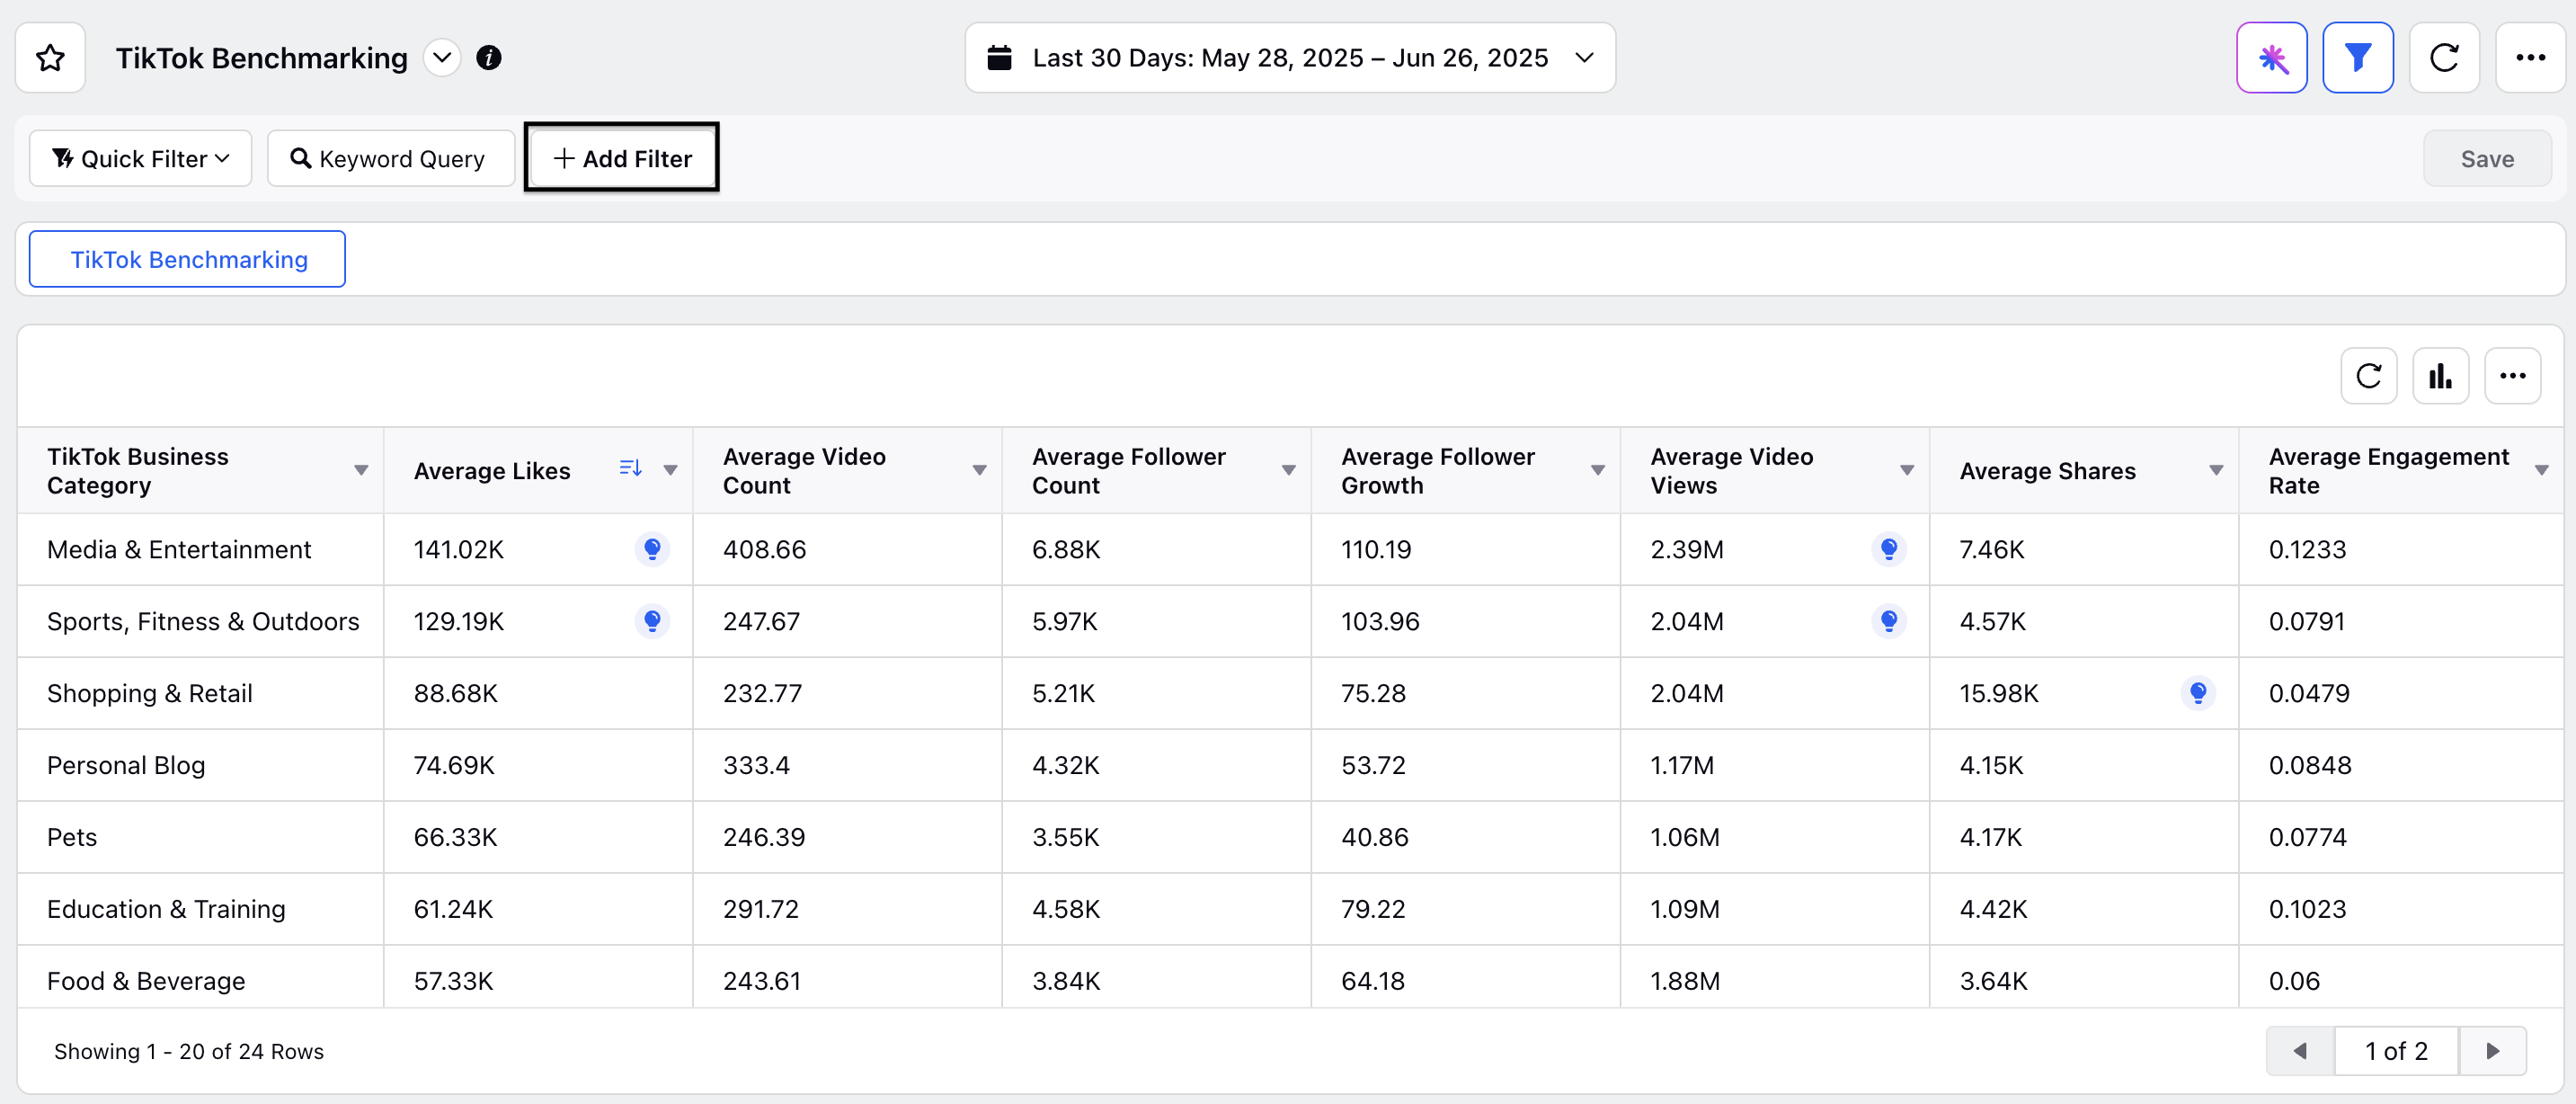
How it works
When you connect your TikTok Business account to Sprinklr Social, a business category is automatically assigned to your account.
Once connected, Sprinklr receives industry average data for that category.
Compares the brands performance metrics with the industry average.
Metrics and Dimensions
You’ll be able to see average performance metrics for different TikTok business categories (even those outside your own
Metric Name | Description |
Average Likes | Average likes per video in the category. |
Average Comments | Average comments per video. |
Average Shares | Average shares per video. |
Average Video Count | Average number of videos posted in 30 days. |
Average Follower Count | Average number of followers in the category. |
Average Follower Growth | Averagefollower increase during the timeframe. |
Average Video Views | Average video views across posts. |
Average Engagement Rate | Based on interactions per video. |
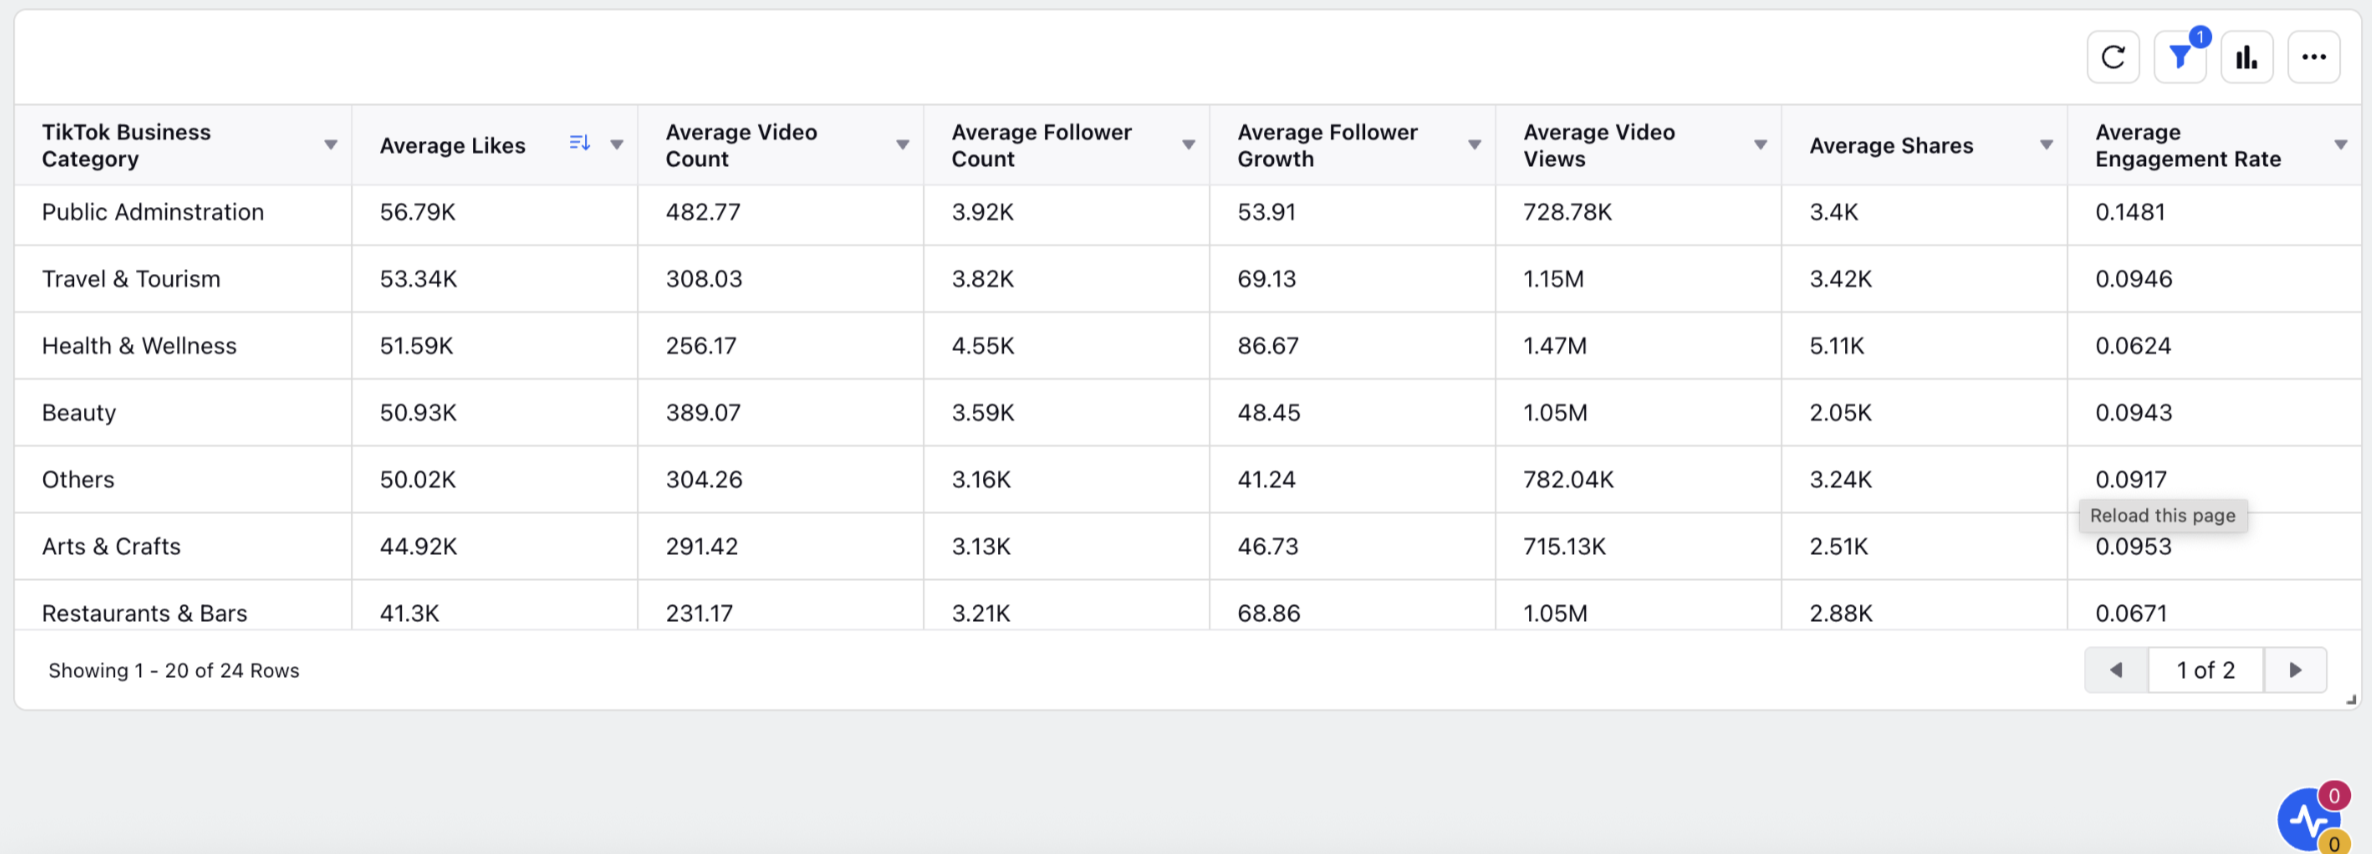
Comparision Capabilities
TikTok Engagements V/S Business Category Average Widget
The data in this widget is sourced from TikTok-owned accounts and represents aggregated metrics across all connected TikTok accounts. To view data for a specific account, you’ll need to apply an account-level filter. This aggregation is done at the industry level and is intended to be surfaced within the Benchmarking Dashboard.

Note: To access this widget, at least one TikTok account must be authenticated in Sprinklr. You must also apply an account filter to proceed for best results.
Once the account is added, you must also associate it with a brand and apply an account filter to the widget for the data to be reflected correctly.
Let’s look at the steps to add a brand:
Click the New Tab icon. Under Platform Modules, click All Settings within Listen.
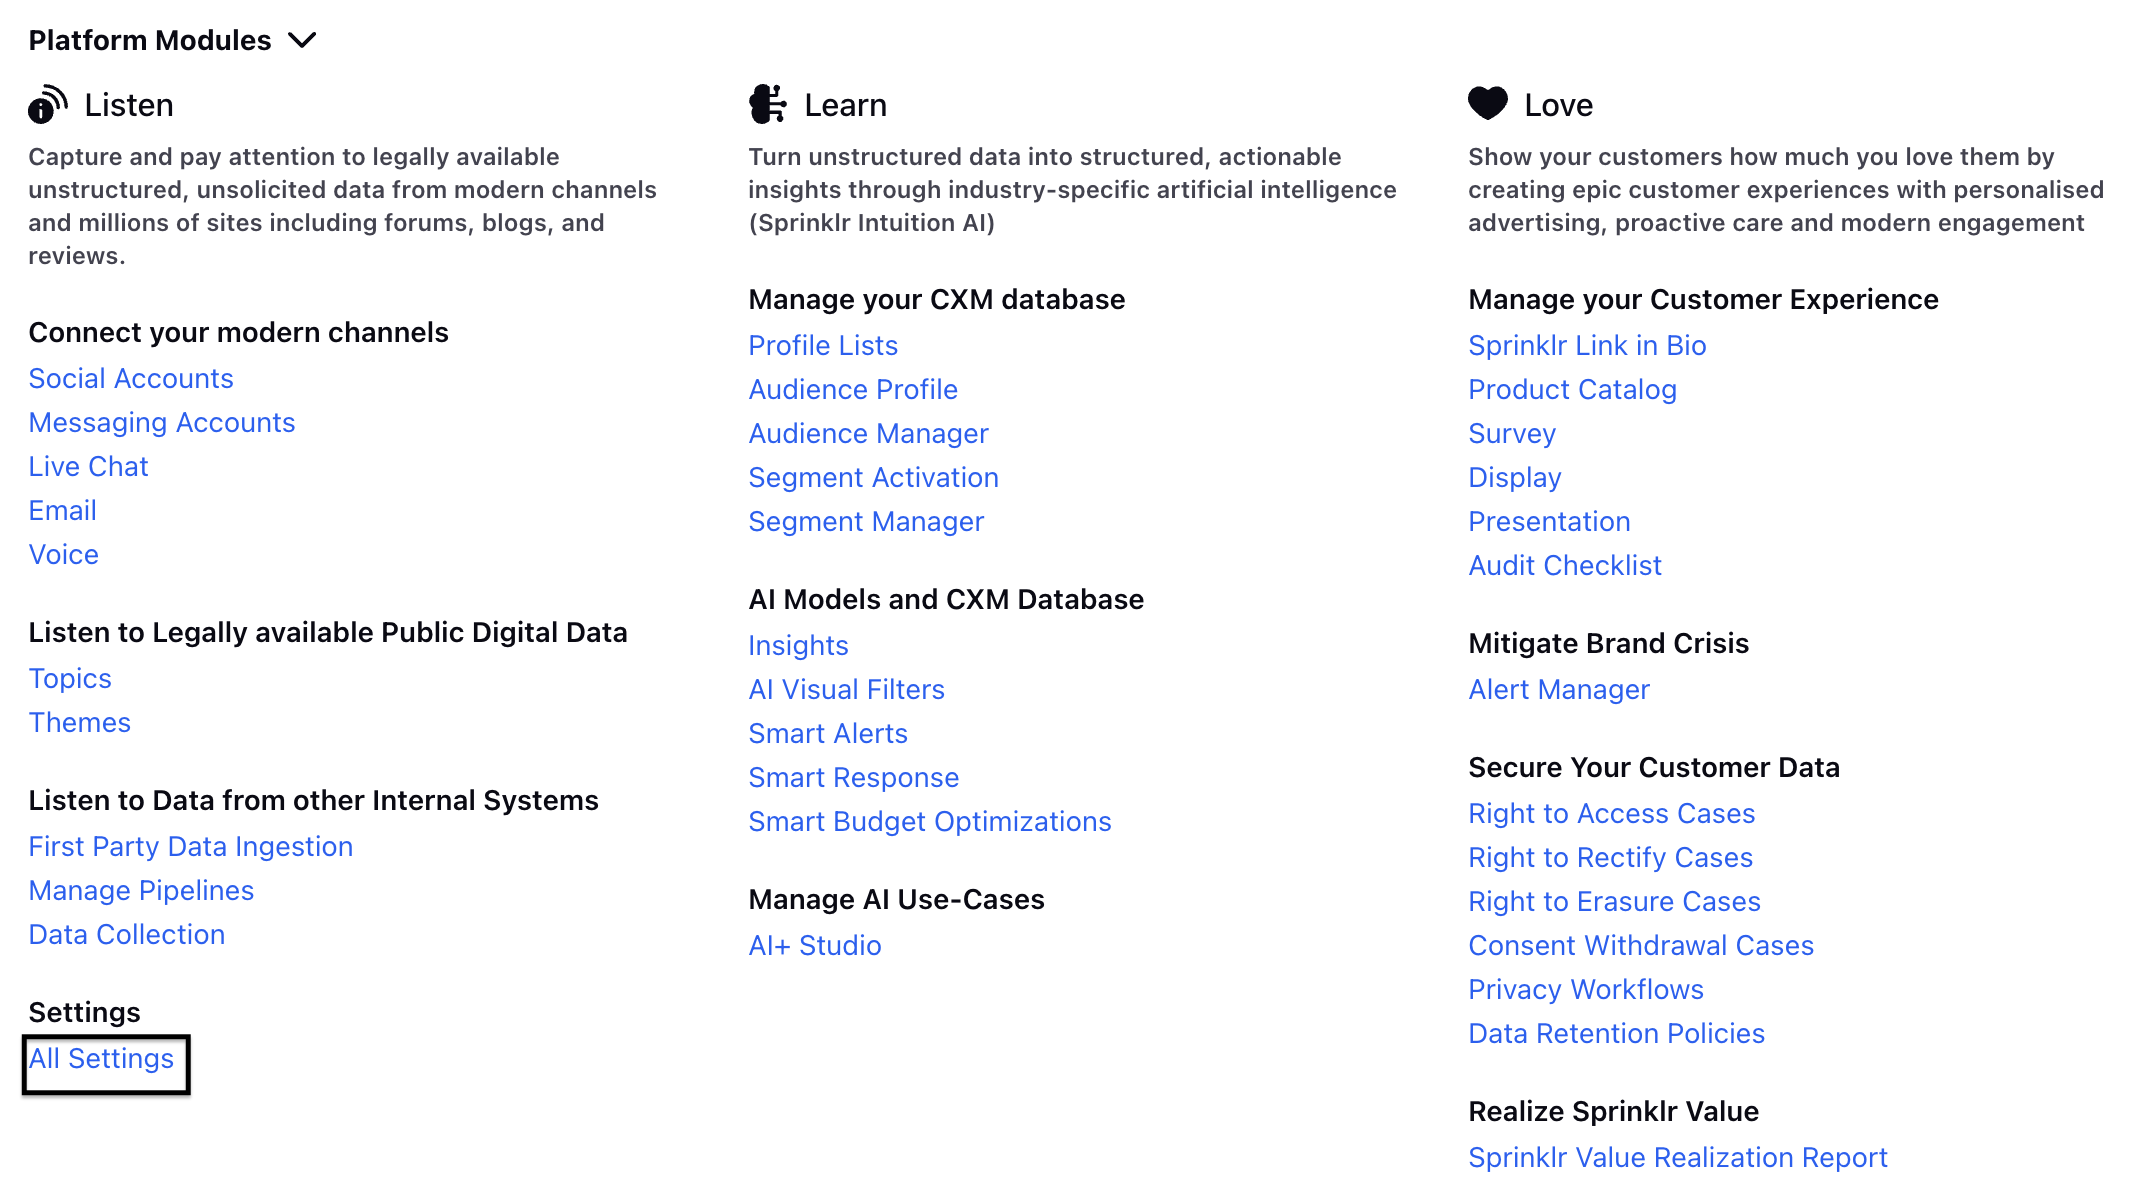
Alternatively, in the Search Bar look for All Settings.
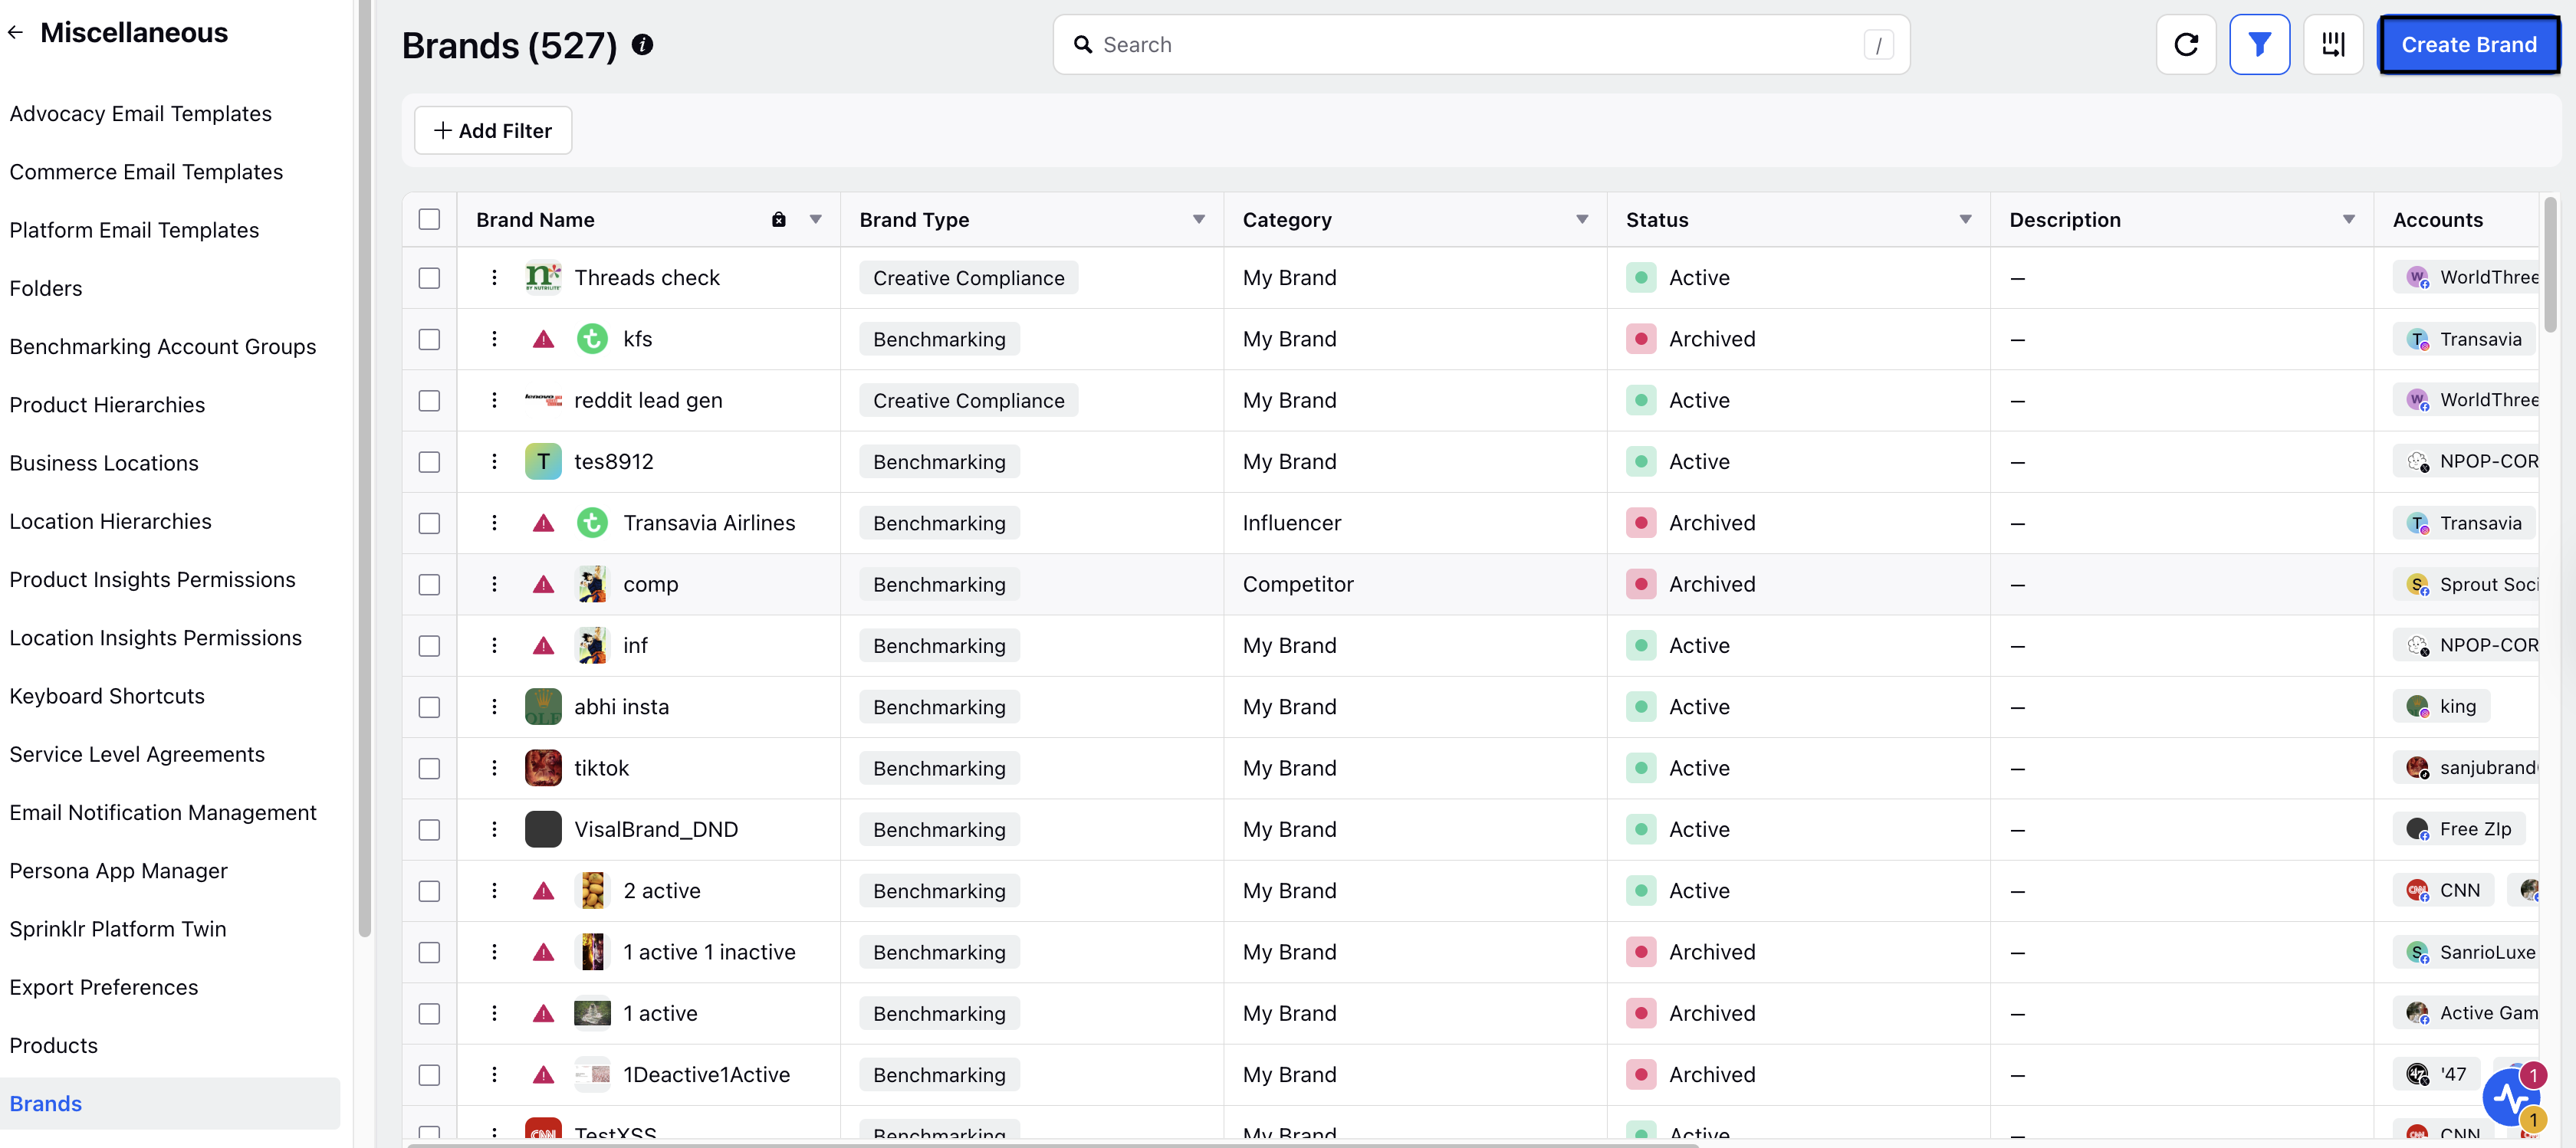
On the Platform Settings window, search and select Brands within Manage Customer.
Click Create Brand in the top right corner of the Brands window or access an already created brand.
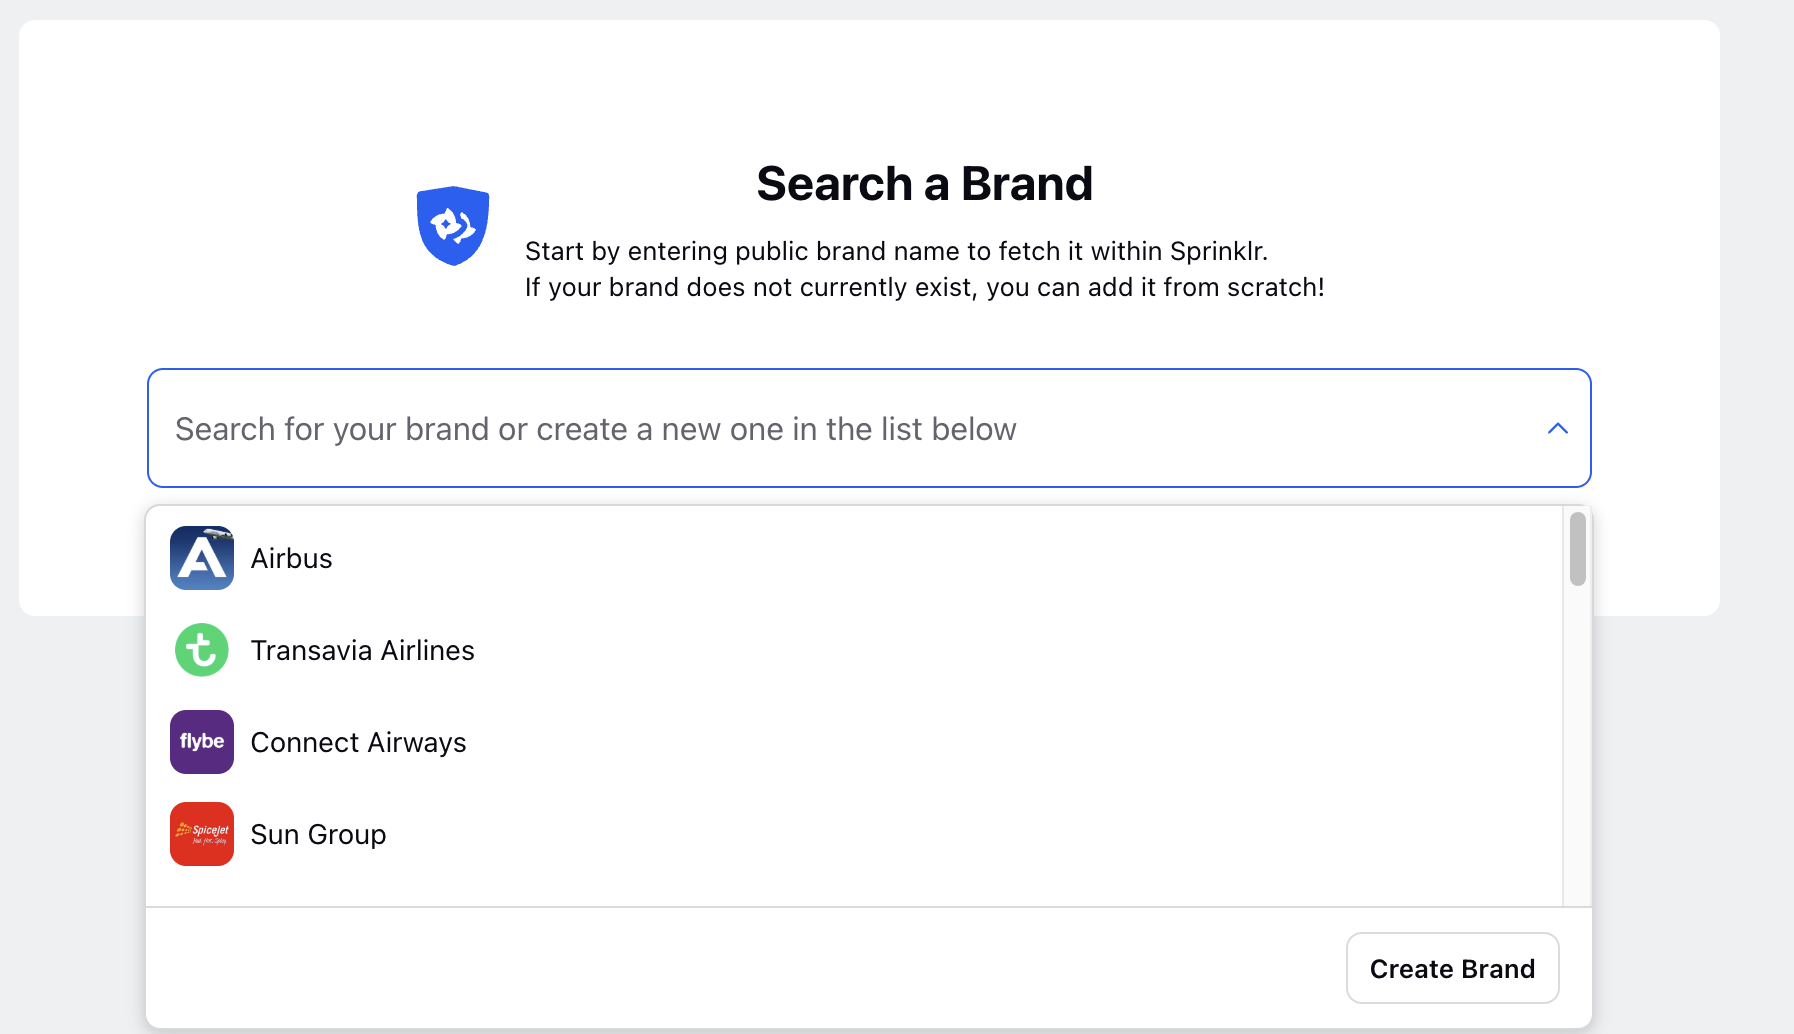
Select Brand Type and search TikTok brand.
In the Brand Details page fill in the details of the brand and click Next.
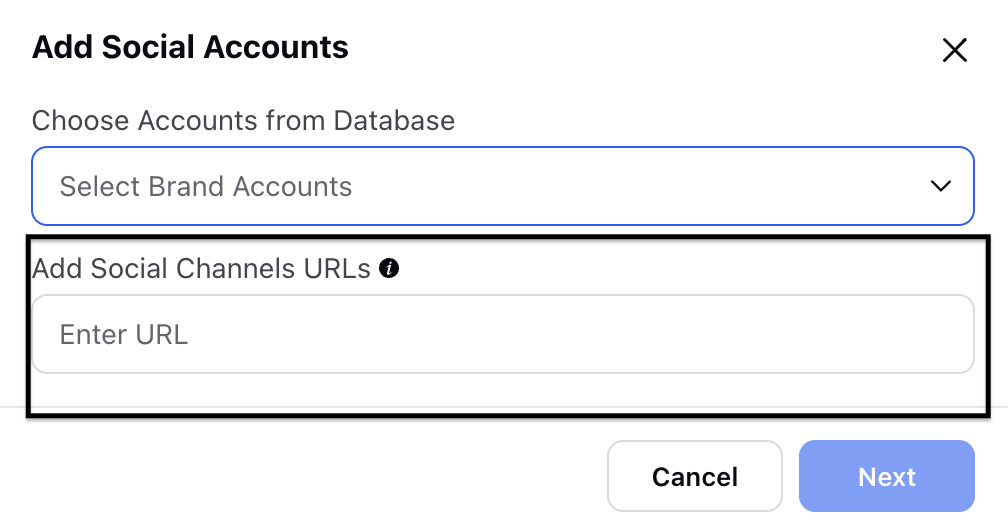
Go to Brand Account page and Click Add Account option(+ sign).
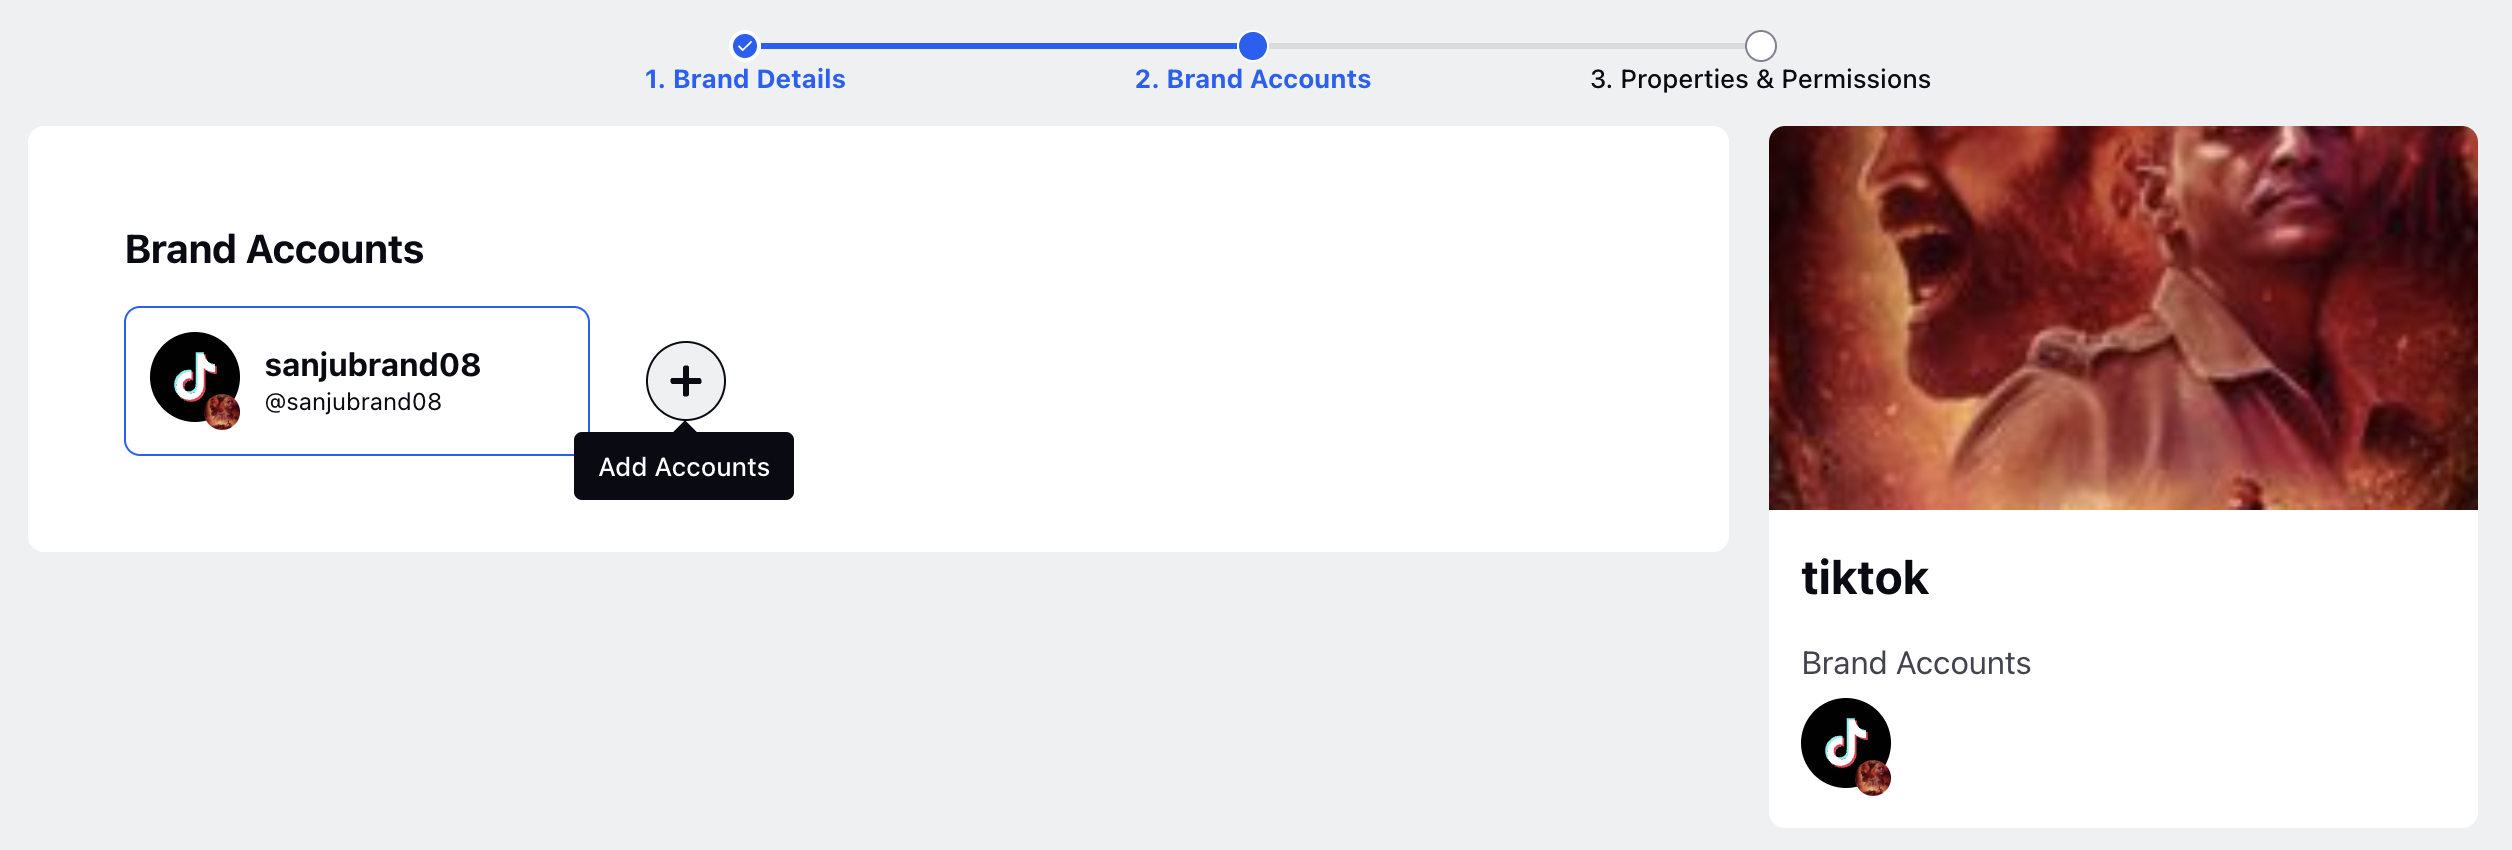
In the chose account from database option select the account by clicking + URL. If the account is alread added here and its authenticated, just add the URL in the enter URL section and click Next.
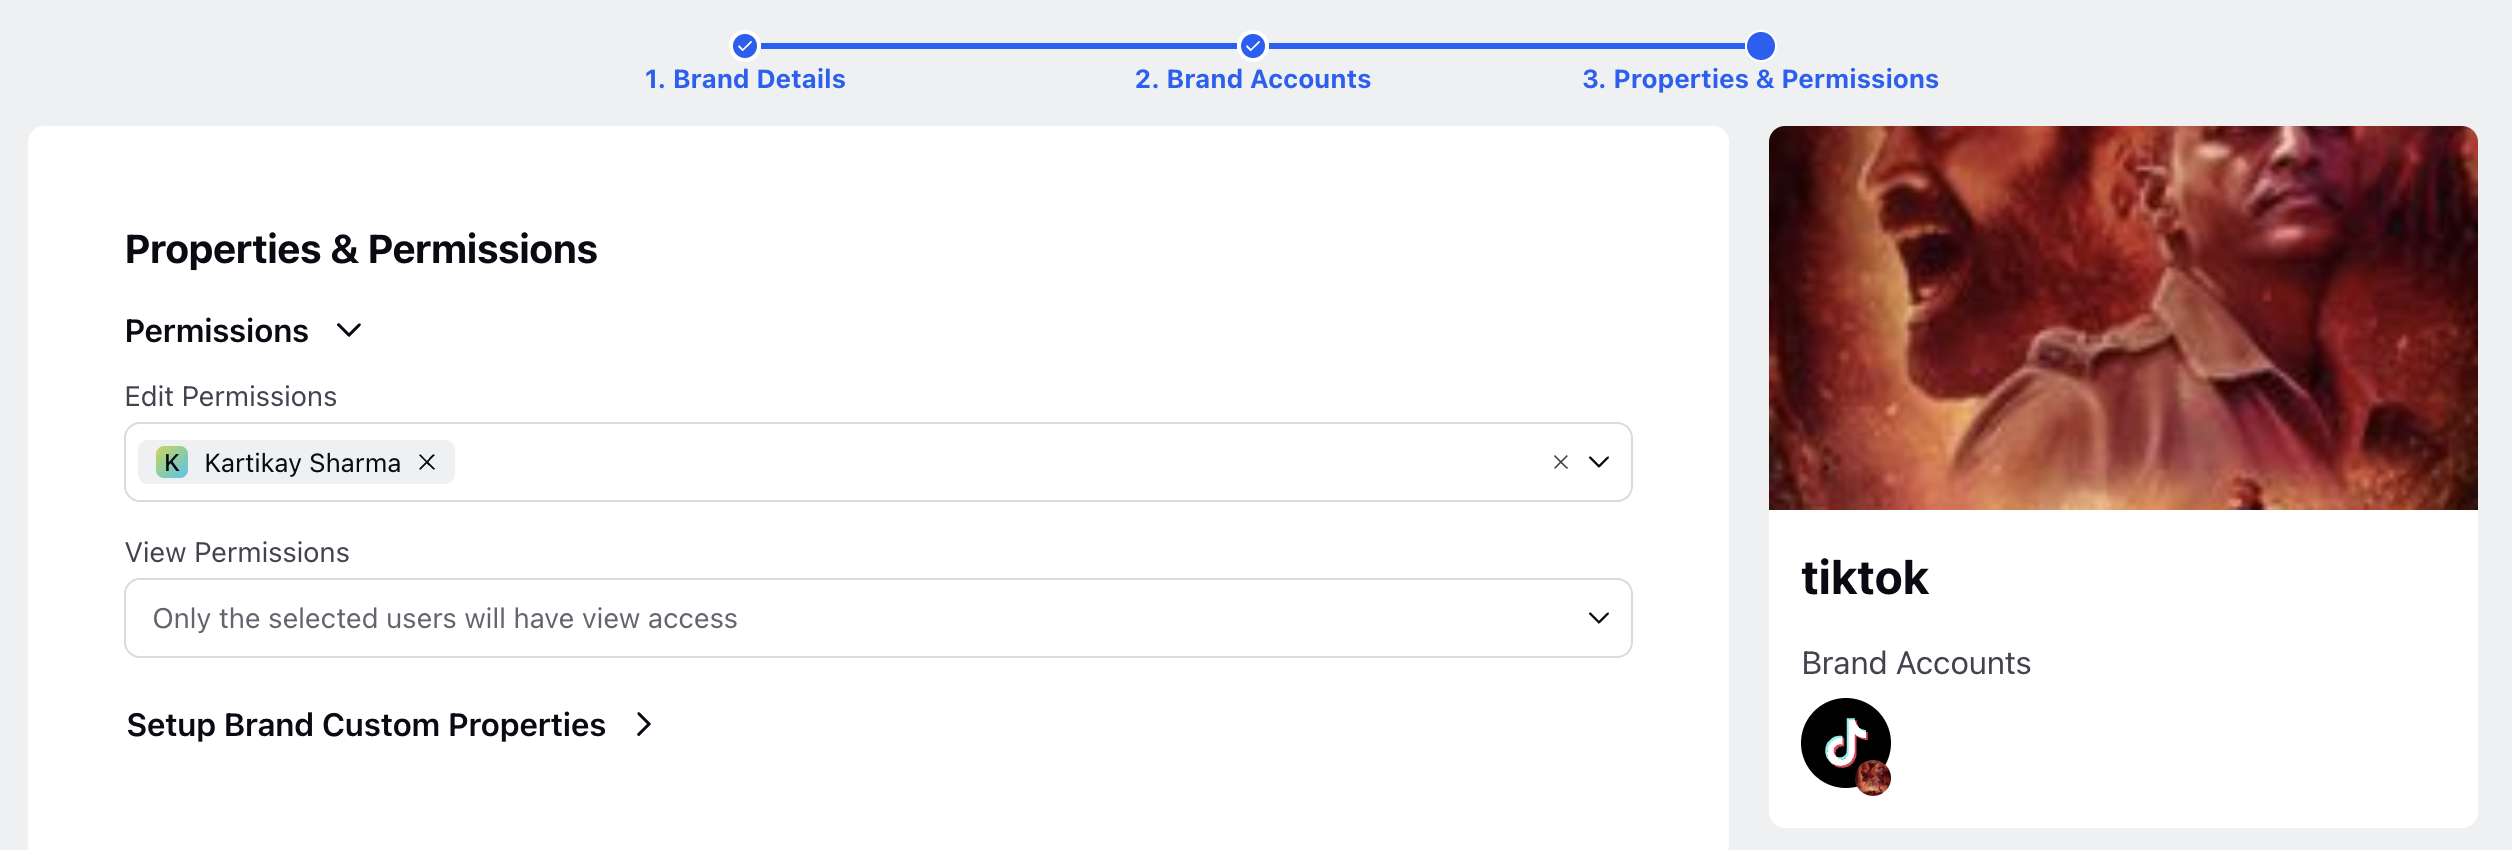
Go to the permissions section and provide Edit and View permissions to the users, user groups, and workspace, and select the relevant Custom Properties.
TikTok Business Category Average
This widget shows the average values across all the industries. This will be available to be consumed for everyone even if you have added the account or not added the account.
