18.5 Key Changes in User Experience
Updated
Usability is the key focus for Sprinklr this year, and we continue our efforts toward making Sprinklr simpler, better, and consistent. There are some exciting major changes in the 18.5 release, where users will experience a change in platform appearance and behavior.
Sprinklr Insights
Platform | Introducing Page Density Controls
Unlock the power of information with page density controls – tailor your viewing experience to your preference. By offering Compact, Comfortable, and Spacious modes, you will be able to tailor your viewing experience, thereby enhancing productivity and satisfaction. You will be able to switch between 3 different modes viz. Spacious, Comfortable, and Compact.
Sprinklr AI+ | OpenAI Integration within Sprinklr
Sprinklr is unifying the best of both worlds – with the aim of delivering the best customer experience. Sprinklr’s in-house AI, built over the past decade, is focused specifically on unsolicited, unstructured CX data. It is intentionally built for CX use cases, across 100+ languages.
We are bringing our focused AI capabilities together with the broad potential of generative AI. We have an official engagement with OpenAI, and will continue to partner with the best Generative AI providers in the world.
Quickly generate complex Boolean queries by simply describing the objective and further make it exhaustive using smart suggestions and translation capabilities.
Together, we make Sprinklr AI+, an "AI everywhere" offering to provide value with AI across the Sprinklr experience, including –
Sprinklr AI+: Query and Keyword Creations
Create AI-generated queries powered by smart suggestions, keyword variations, and translation capabilities, thereby reducing time to configure boolean queries by 90%.
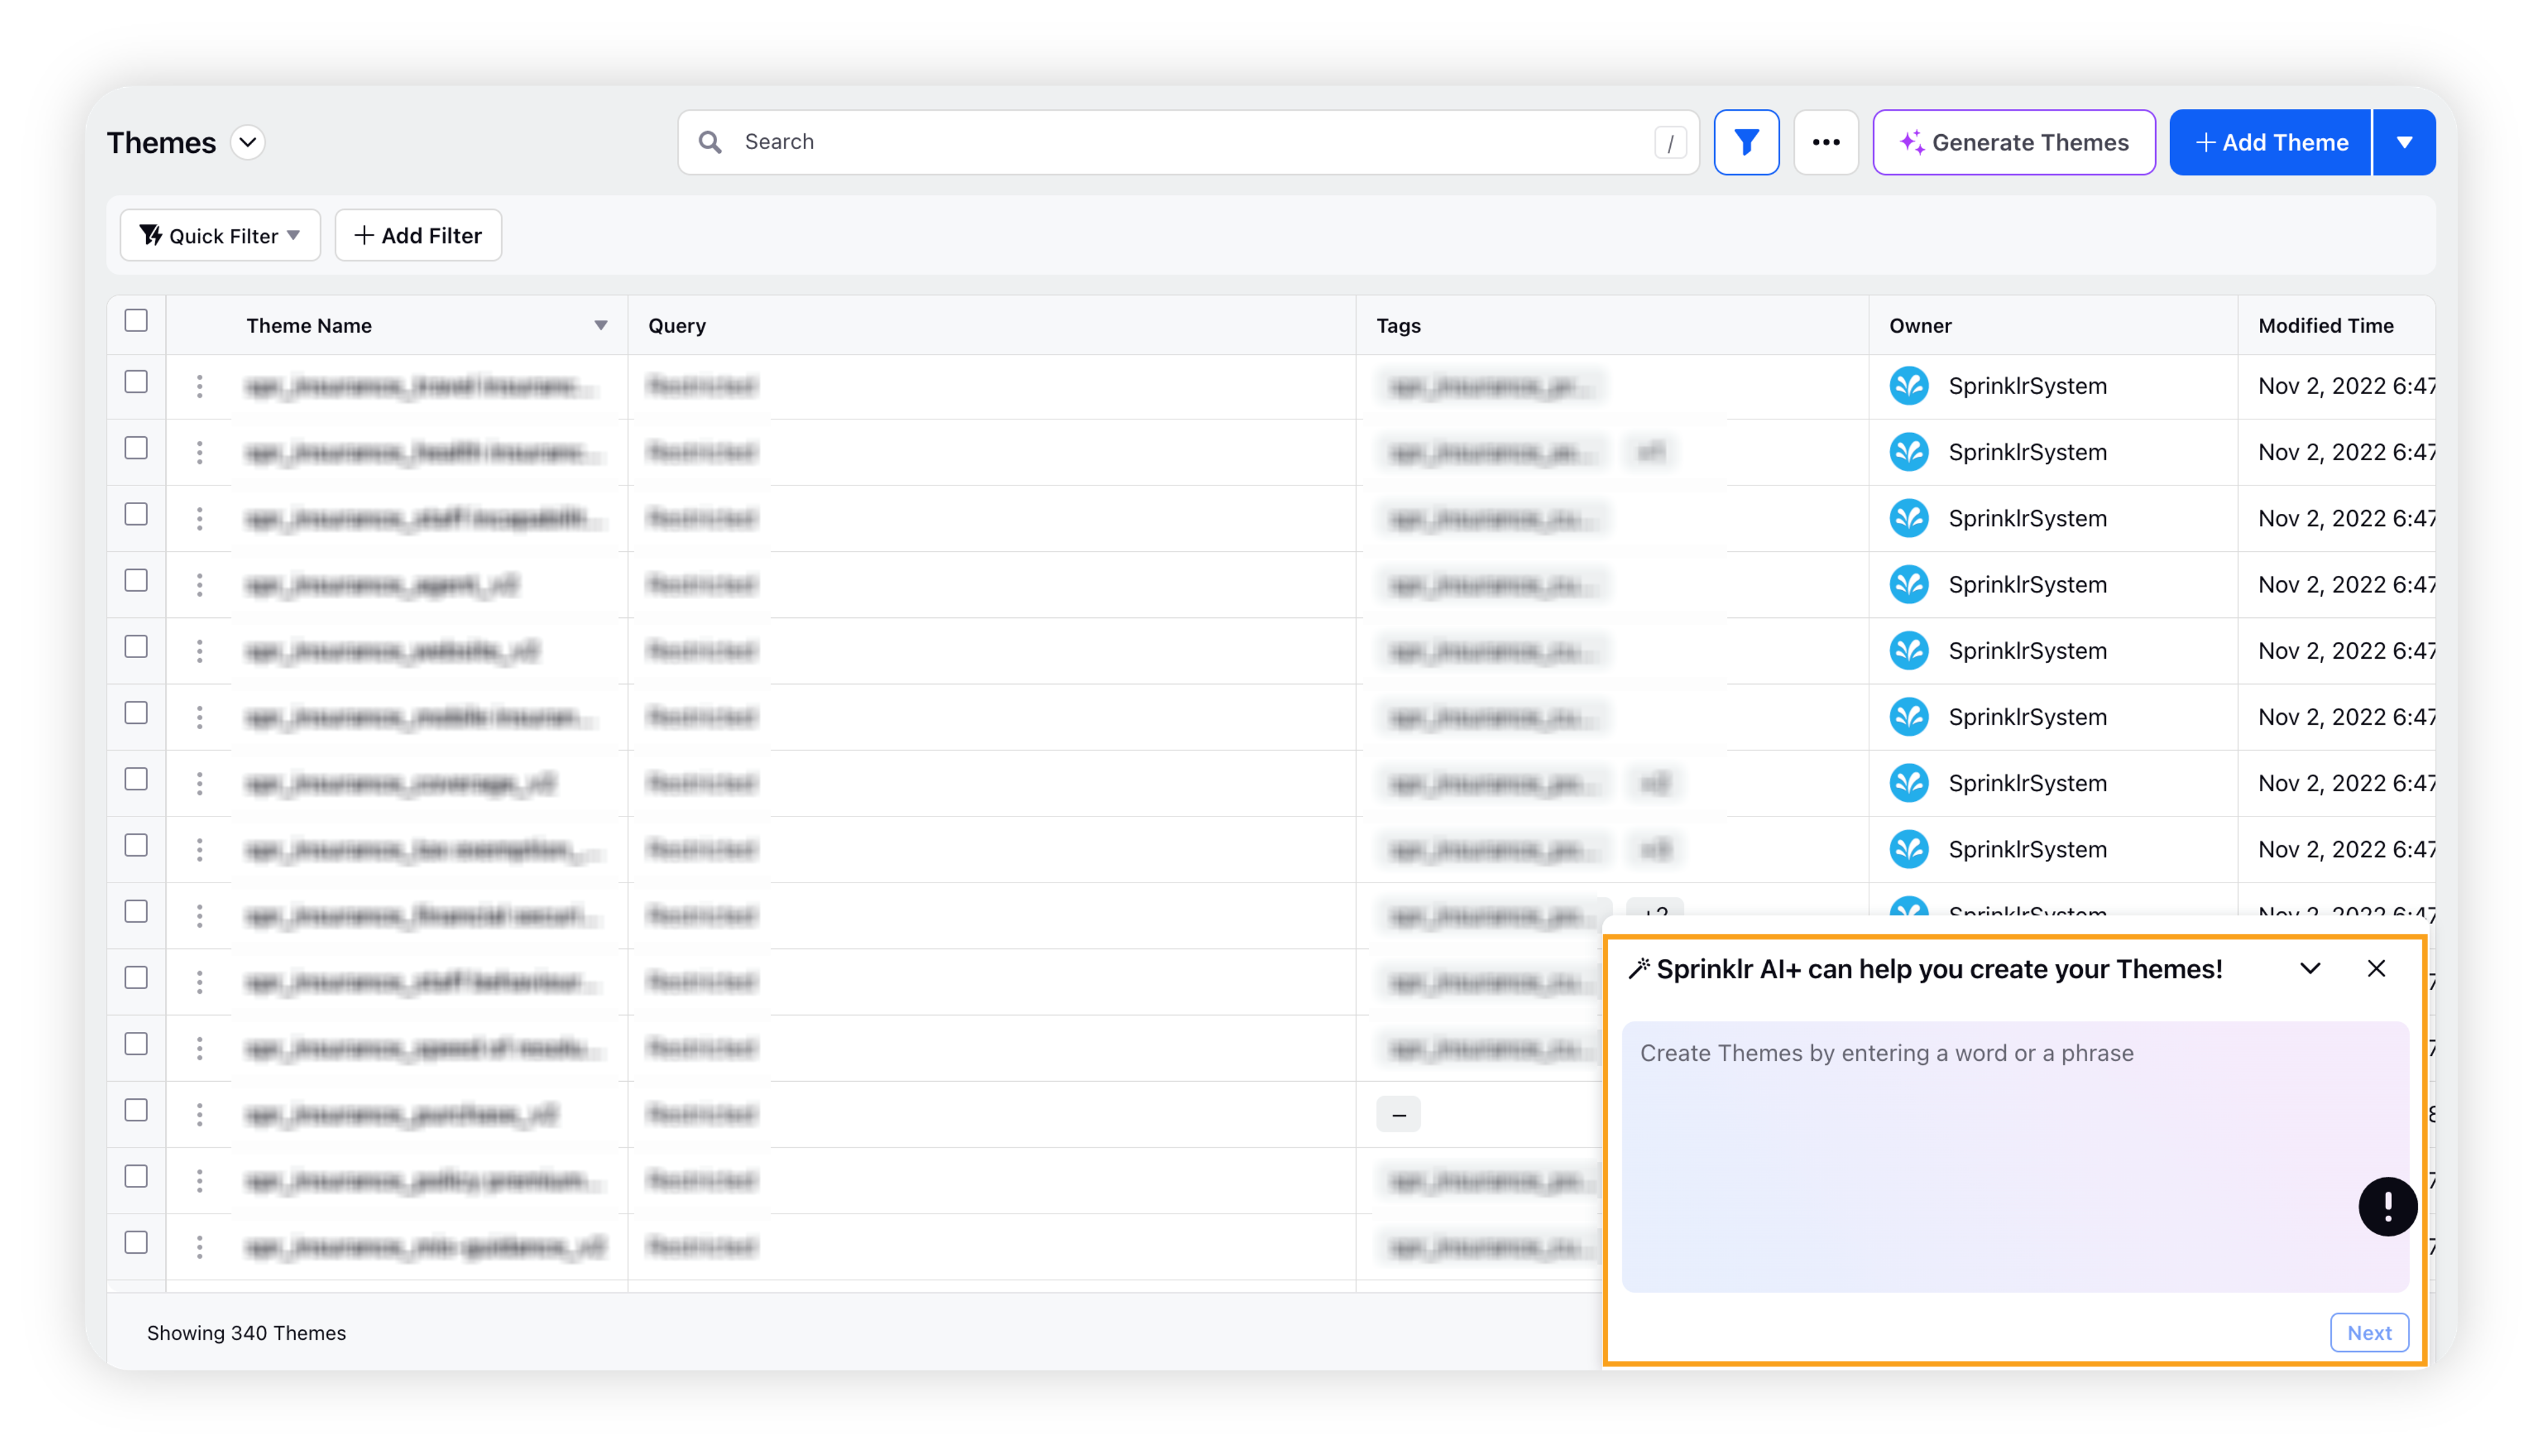
Sprinklr AI+: Theme Framework Creation
Automatically generate Themes using Sprinklr AI+ and customize them as per your business needs.
Sprinklr AI+: Message Summariser
Get on-demand summaries of long-form news articles, blogs or messages, to help you quickly understand the gist of any article or post.


All of this, with data privacy and Responsible AI at the heart of Sprinklr's Unified-CXM platform.
Listening | Introducing User-level Filtering
Introducing improved sharing permission for the dashboard allowing users to share the dashboard with Edit & View access, as per the requirement. The flexibility of sharing permission will allow the end user to perform different levels of actions. Users with view access can now apply filters to their dashboards, tailoring the displayed information to their specific needs without altering the underlying configuration.
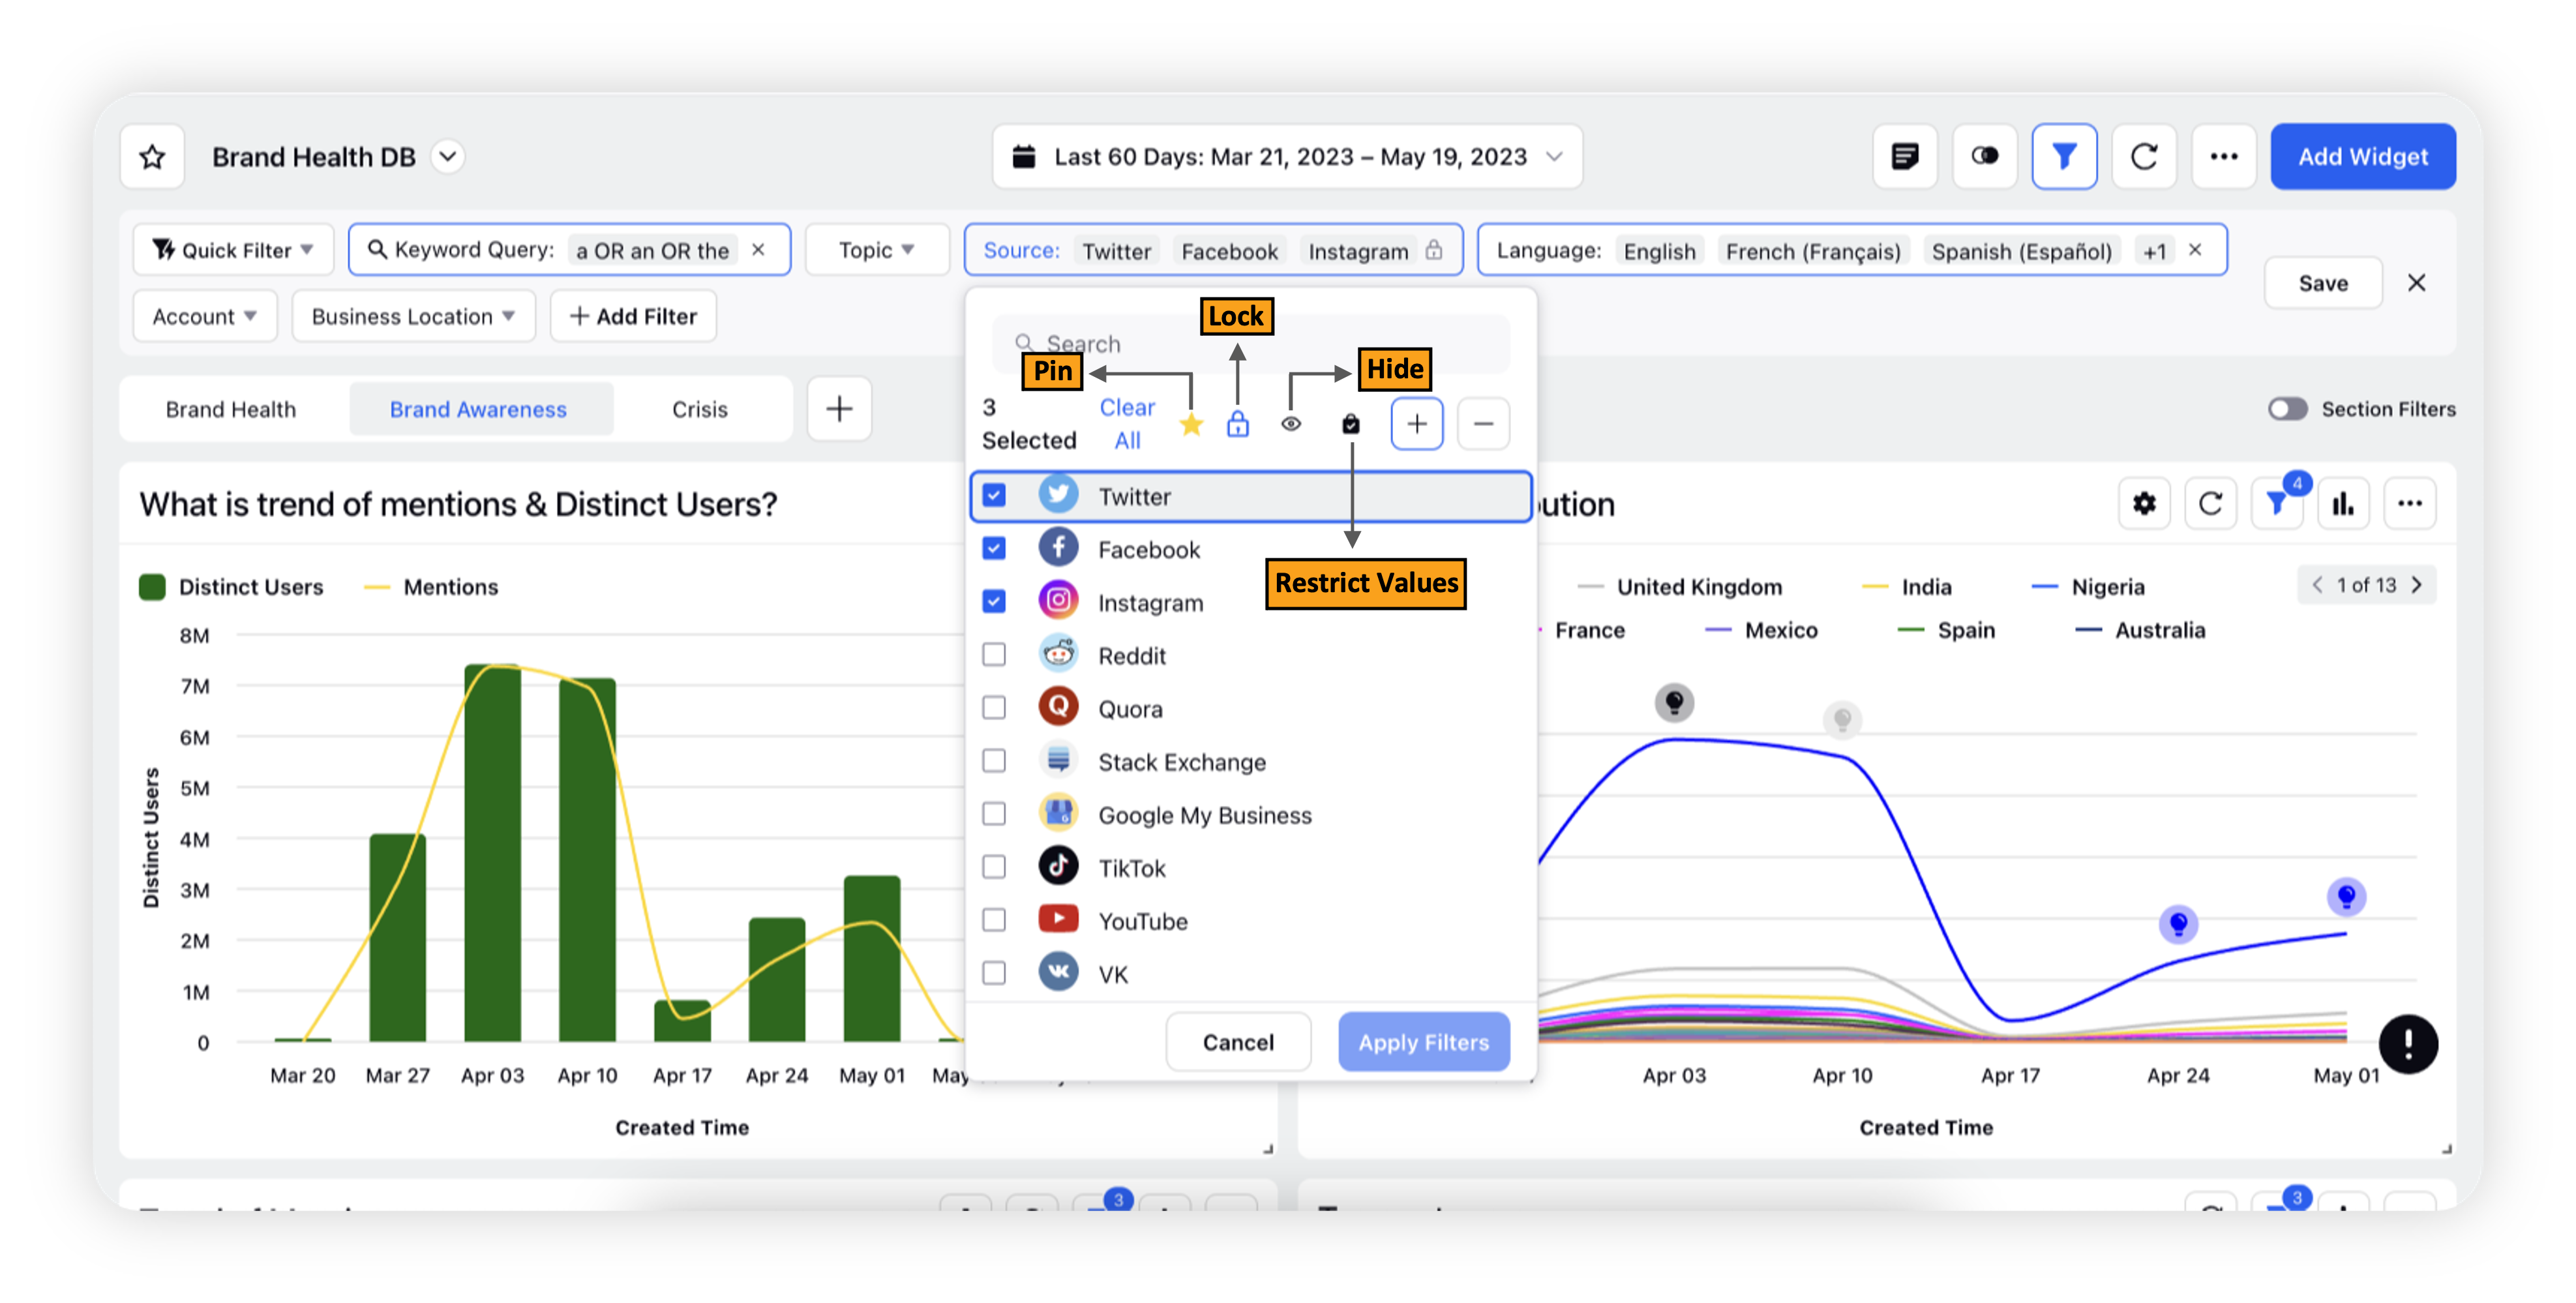
Below are the key benefits of user-level filtering –
Enhanced Personalization: Users can fine-tune their dashboards to focus on the data that matters most to them, tailoring the information displayed to their specific objectives or areas of interest.
Concurrent Insights: Multiple users can use a single dashboard for viewing, analyzing & filtering – without altering the dashboard for other users.
Improved Collaboration: View-only users can now actively participate in discussions and decision-making processes by applying filters to contribute valuable insights and viewpoints, without requiring modifications to the dashboard for everyone.
Time Efficiency: With the ability to apply filters directly within their user context, users can quickly extract the relevant information they need, saving time by eliminating the back-and-forth communication typically required to request changes from the dashboard owner.
Data Exploration: User-level filtering encourages users to delve deeper into their data by allowing them to experiment with different filter combinations and instantly see the impact on their dashboard, fostering a more interactive and engaging experience.
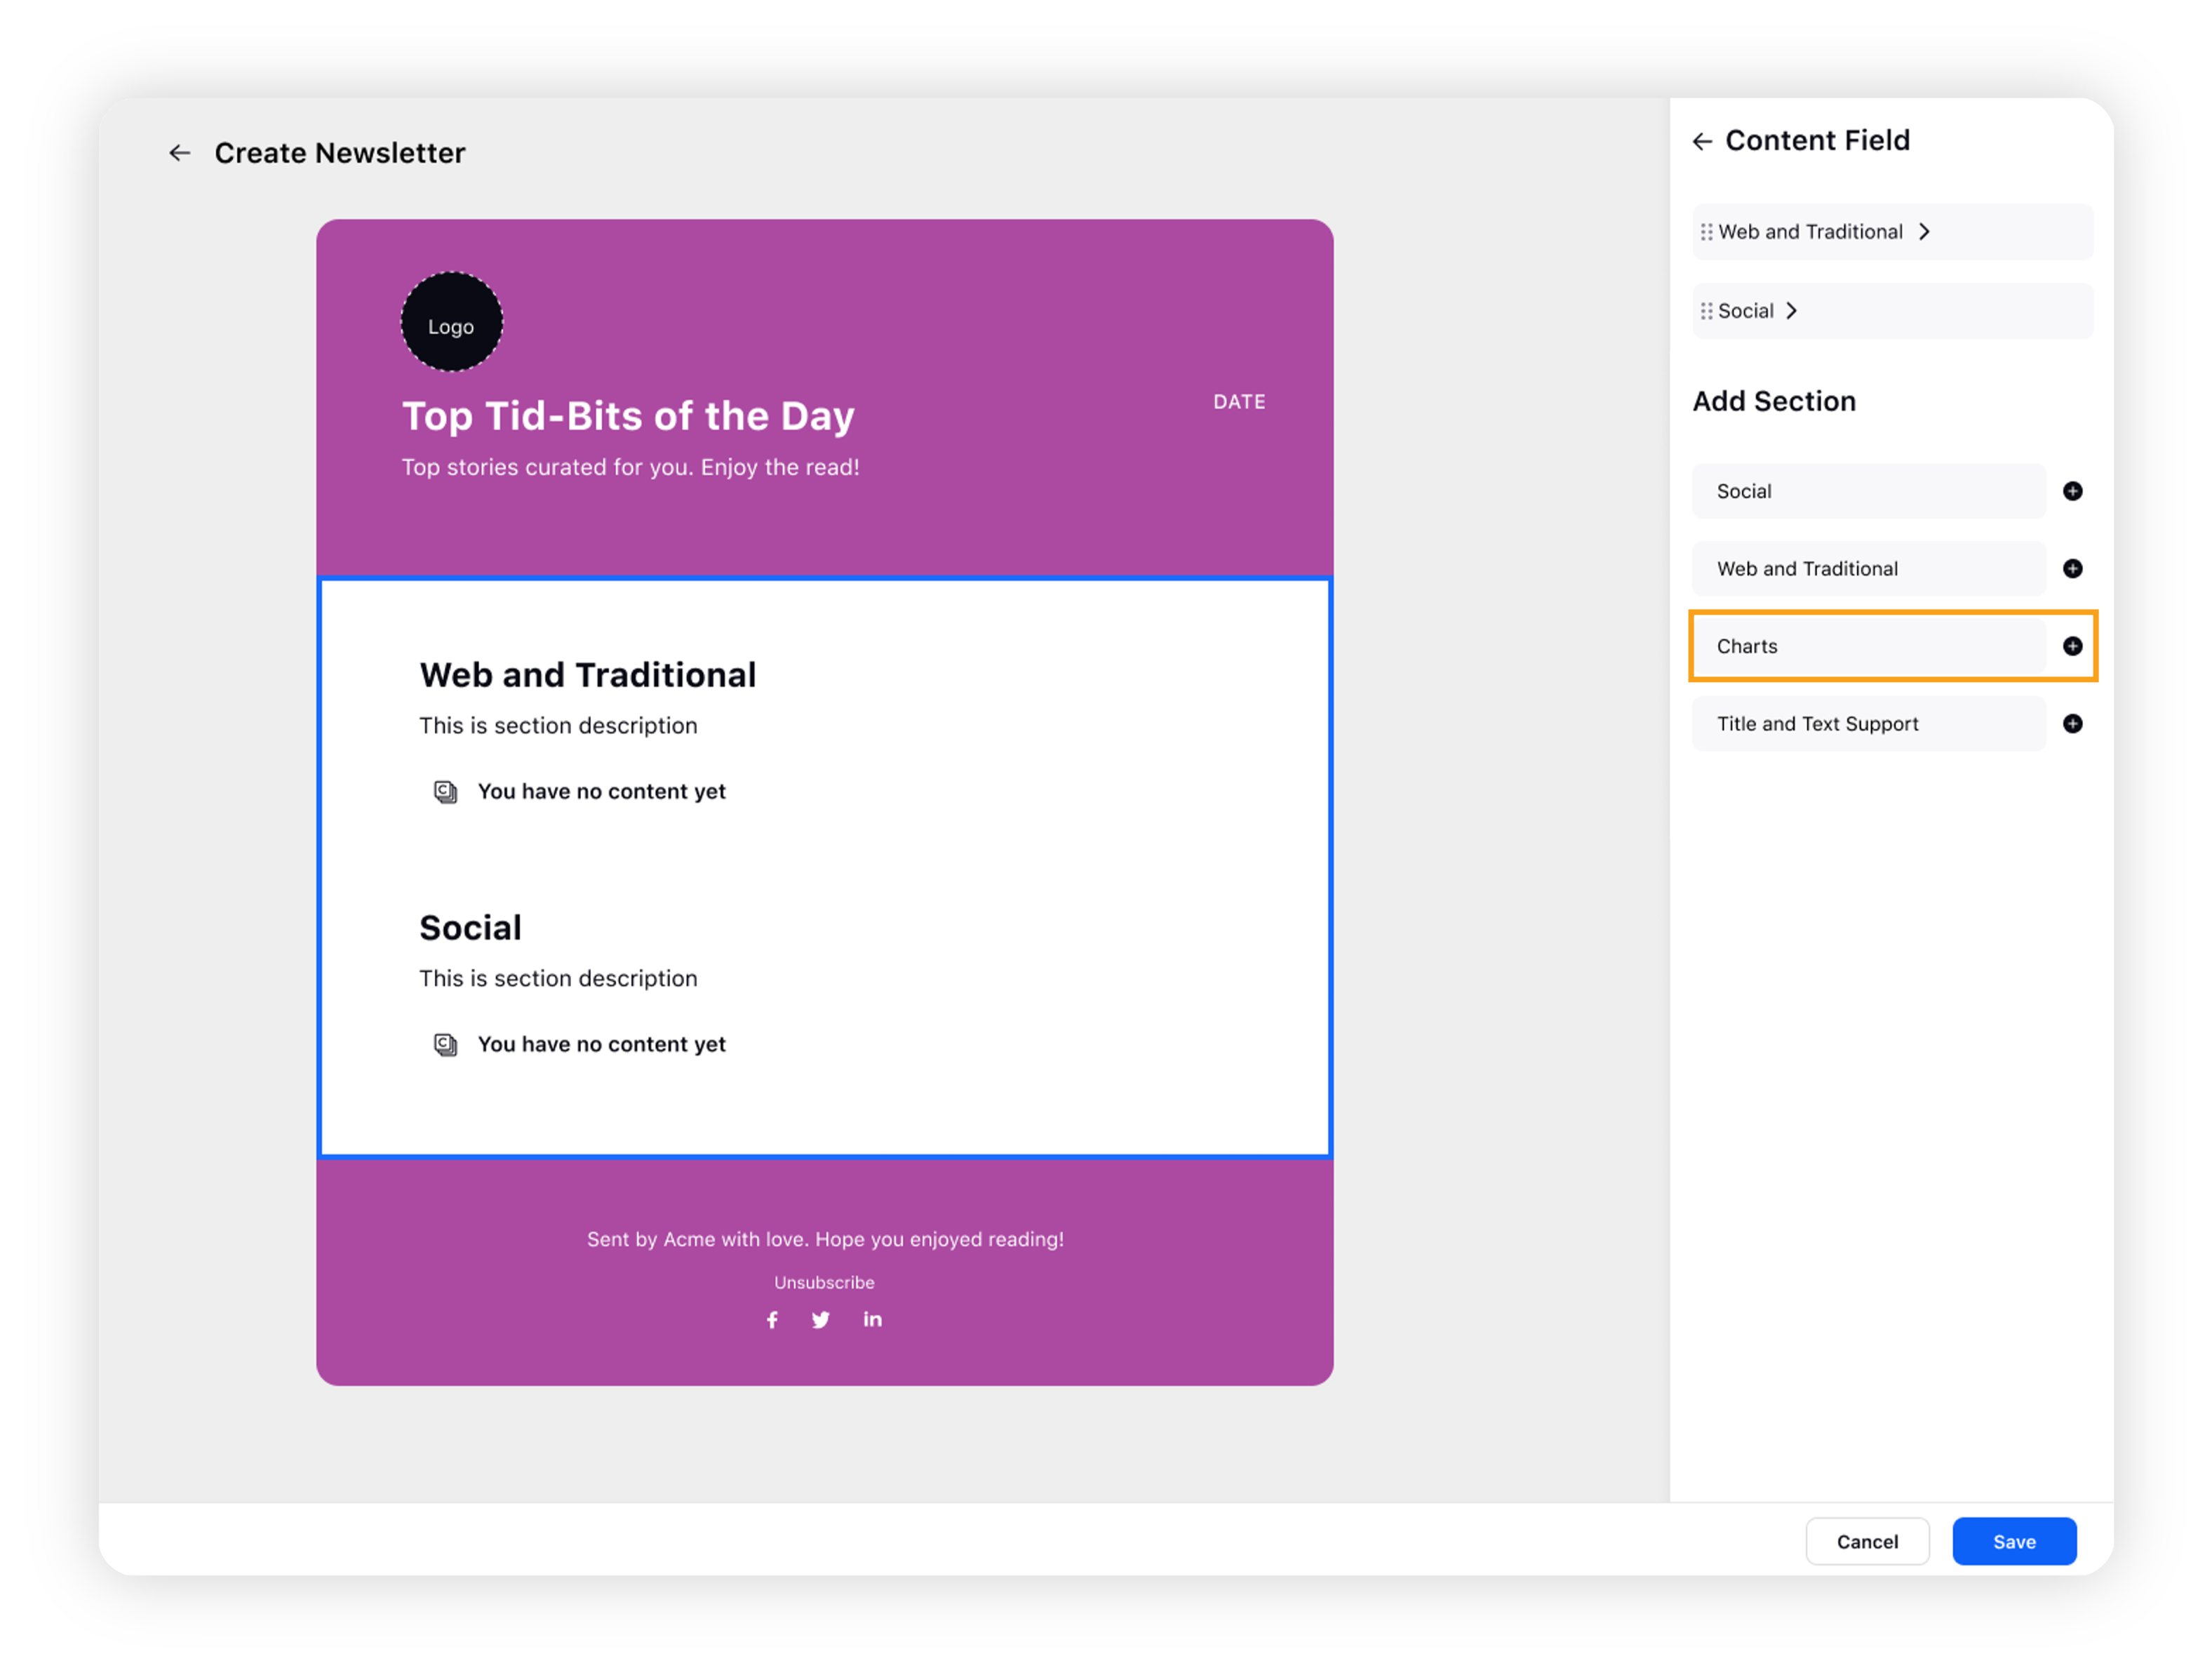
Media Insights | Added Chart Support for Newsletters
You can now include data visualizations in both automated and manual Newsletters, delivering comprehensive and visually appealing reports to stakeholders. While creating a Newsletter, you can access a dedicated section within the content library containing various charts. By simply dragging and dropping the desired charts into the Newsletter, you will be prompted with the widget builder wherein you can configure the visualization.
![]() Enablement note: To enable this feature in your environment, please work with your success manager.
Enablement note: To enable this feature in your environment, please work with your success manager.