Sprinklr Insights: 18.5 Capabilities and Enhancements
Updated
Sprinklr's latest release offers exciting new capabilities designed to empower your business to create meaningful customer experiences at every touchpoint. Read about Sprinklr's latest platform enhancements below!
Navigation Tips |
Read through the release notes below or click on a Product title to jump to a particular Product page of the Release Notes. For quick navigation to a specific feature within the Product, click on the feature name on the right. To dive deep into certain capabilities, hover over the linked articles to open the article in a separate tab. Some release notes will be informational one-liners, and the action cursor will not appear. Enjoy! |
Sprinklr Service | ||||
Sprinklr AI+
Sprinklr AI+ | OpenAI Integration within Sprinklr
Sprinklr is unifying the best of both worlds – with the aim of delivering the best customer experience. Sprinklr’s in-house AI, built over the past decade, is focused specifically on unsolicited, unstructured CX data. It is intentionally built for CX use cases, across 100+ languages.
We are bringing our focused AI capabilities together with the broad potential of generative AI. We have an official engagement with OpenAI, and will continue to partner with the best Generative AI providers in the world.
Quickly generate complex Boolean queries by simply describing the objective and further make it exhaustive using smart suggestions and translation capabilities.
Together, we make Sprinklr AI+, an "AI everywhere" offering to provide value with AI across the Sprinklr experience, including –
Sprinklr AI+: Query and Keyword Creations
Create AI-generated queries powered by smart suggestions, keyword variations, and translation capabilities, thereby reducing time to configure boolean queries by 90%.
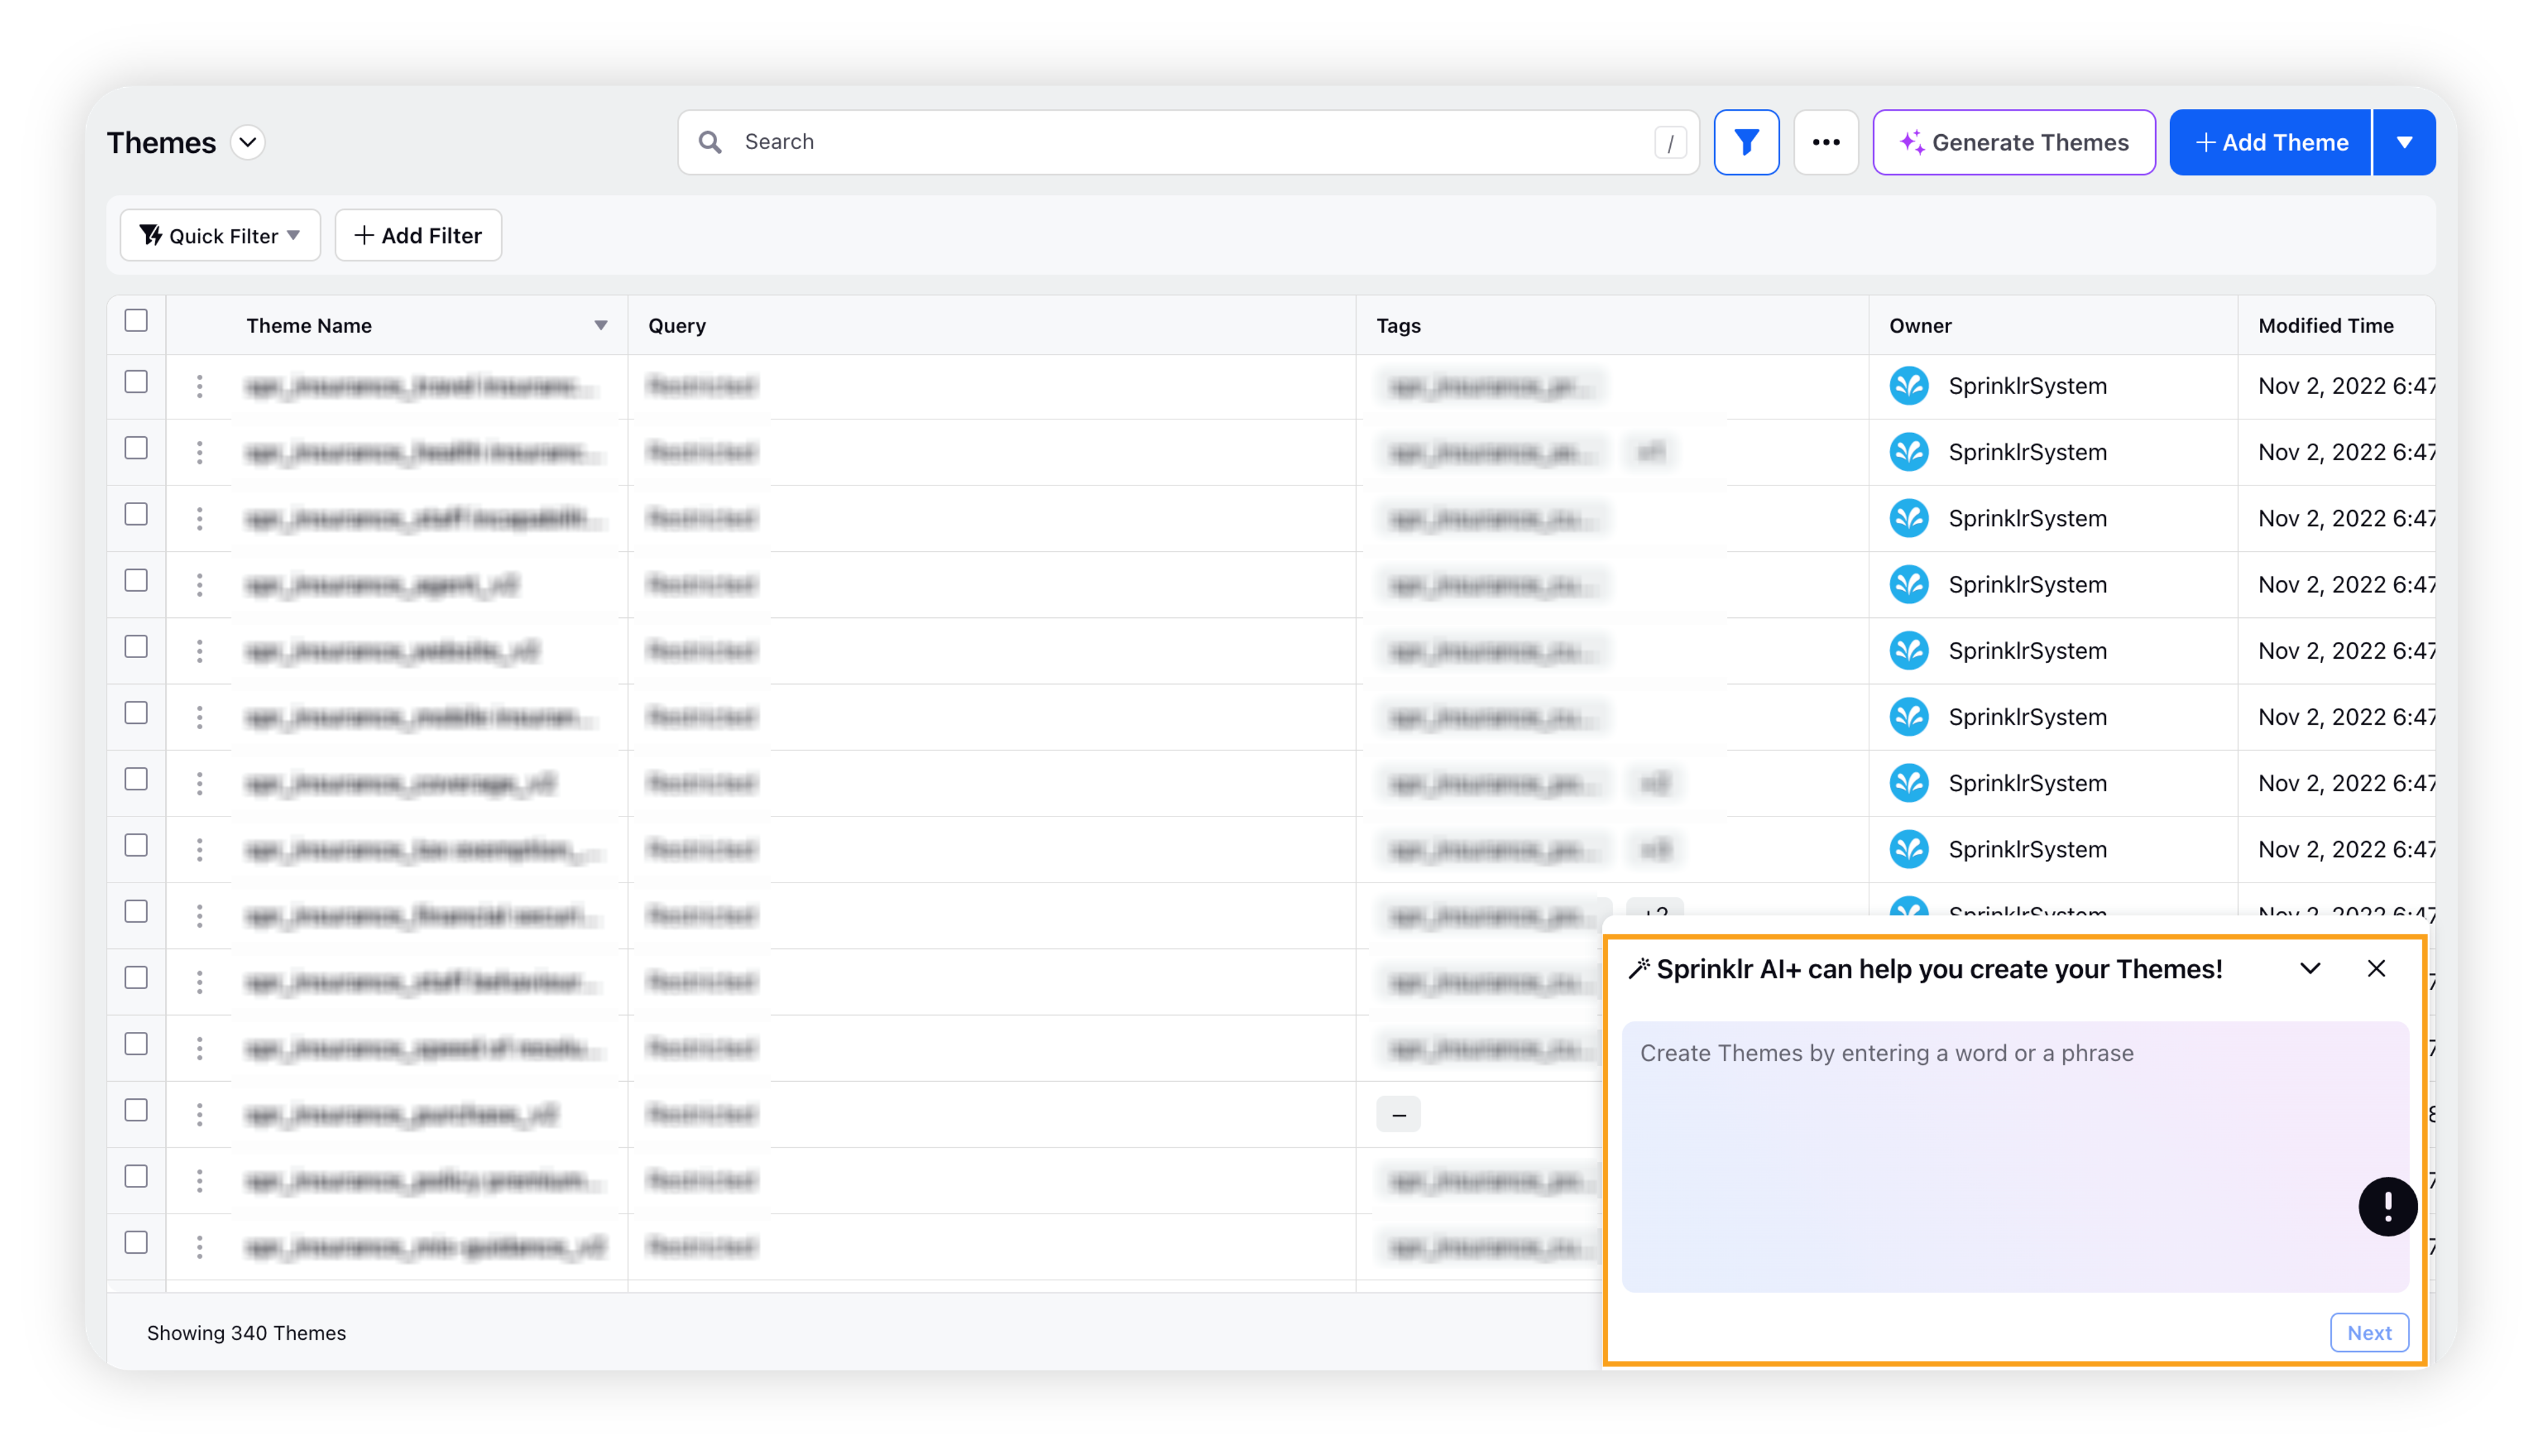
Sprinklr AI+: Theme Framework Creation
Automatically generate Themes using Sprinklr AI+ and customize them as per your business needs.
Sprinklr AI+: Message Summariser
Get on-demand summaries of long-form news articles, blogs or messages, to help you quickly understand the gist of any article or post.


All of this, with data privacy and Responsible AI at the heart of Sprinklr's Unified-CXM platform.
![]() Note: The features are in Beta and use Generative AI capabilities. To learn more about getting these capabilities enabled in your environment, reach out to Sprinklr support at tickets@sprinklr.com.
Note: The features are in Beta and use Generative AI capabilities. To learn more about getting these capabilities enabled in your environment, reach out to Sprinklr support at tickets@sprinklr.com.
Visual Insights
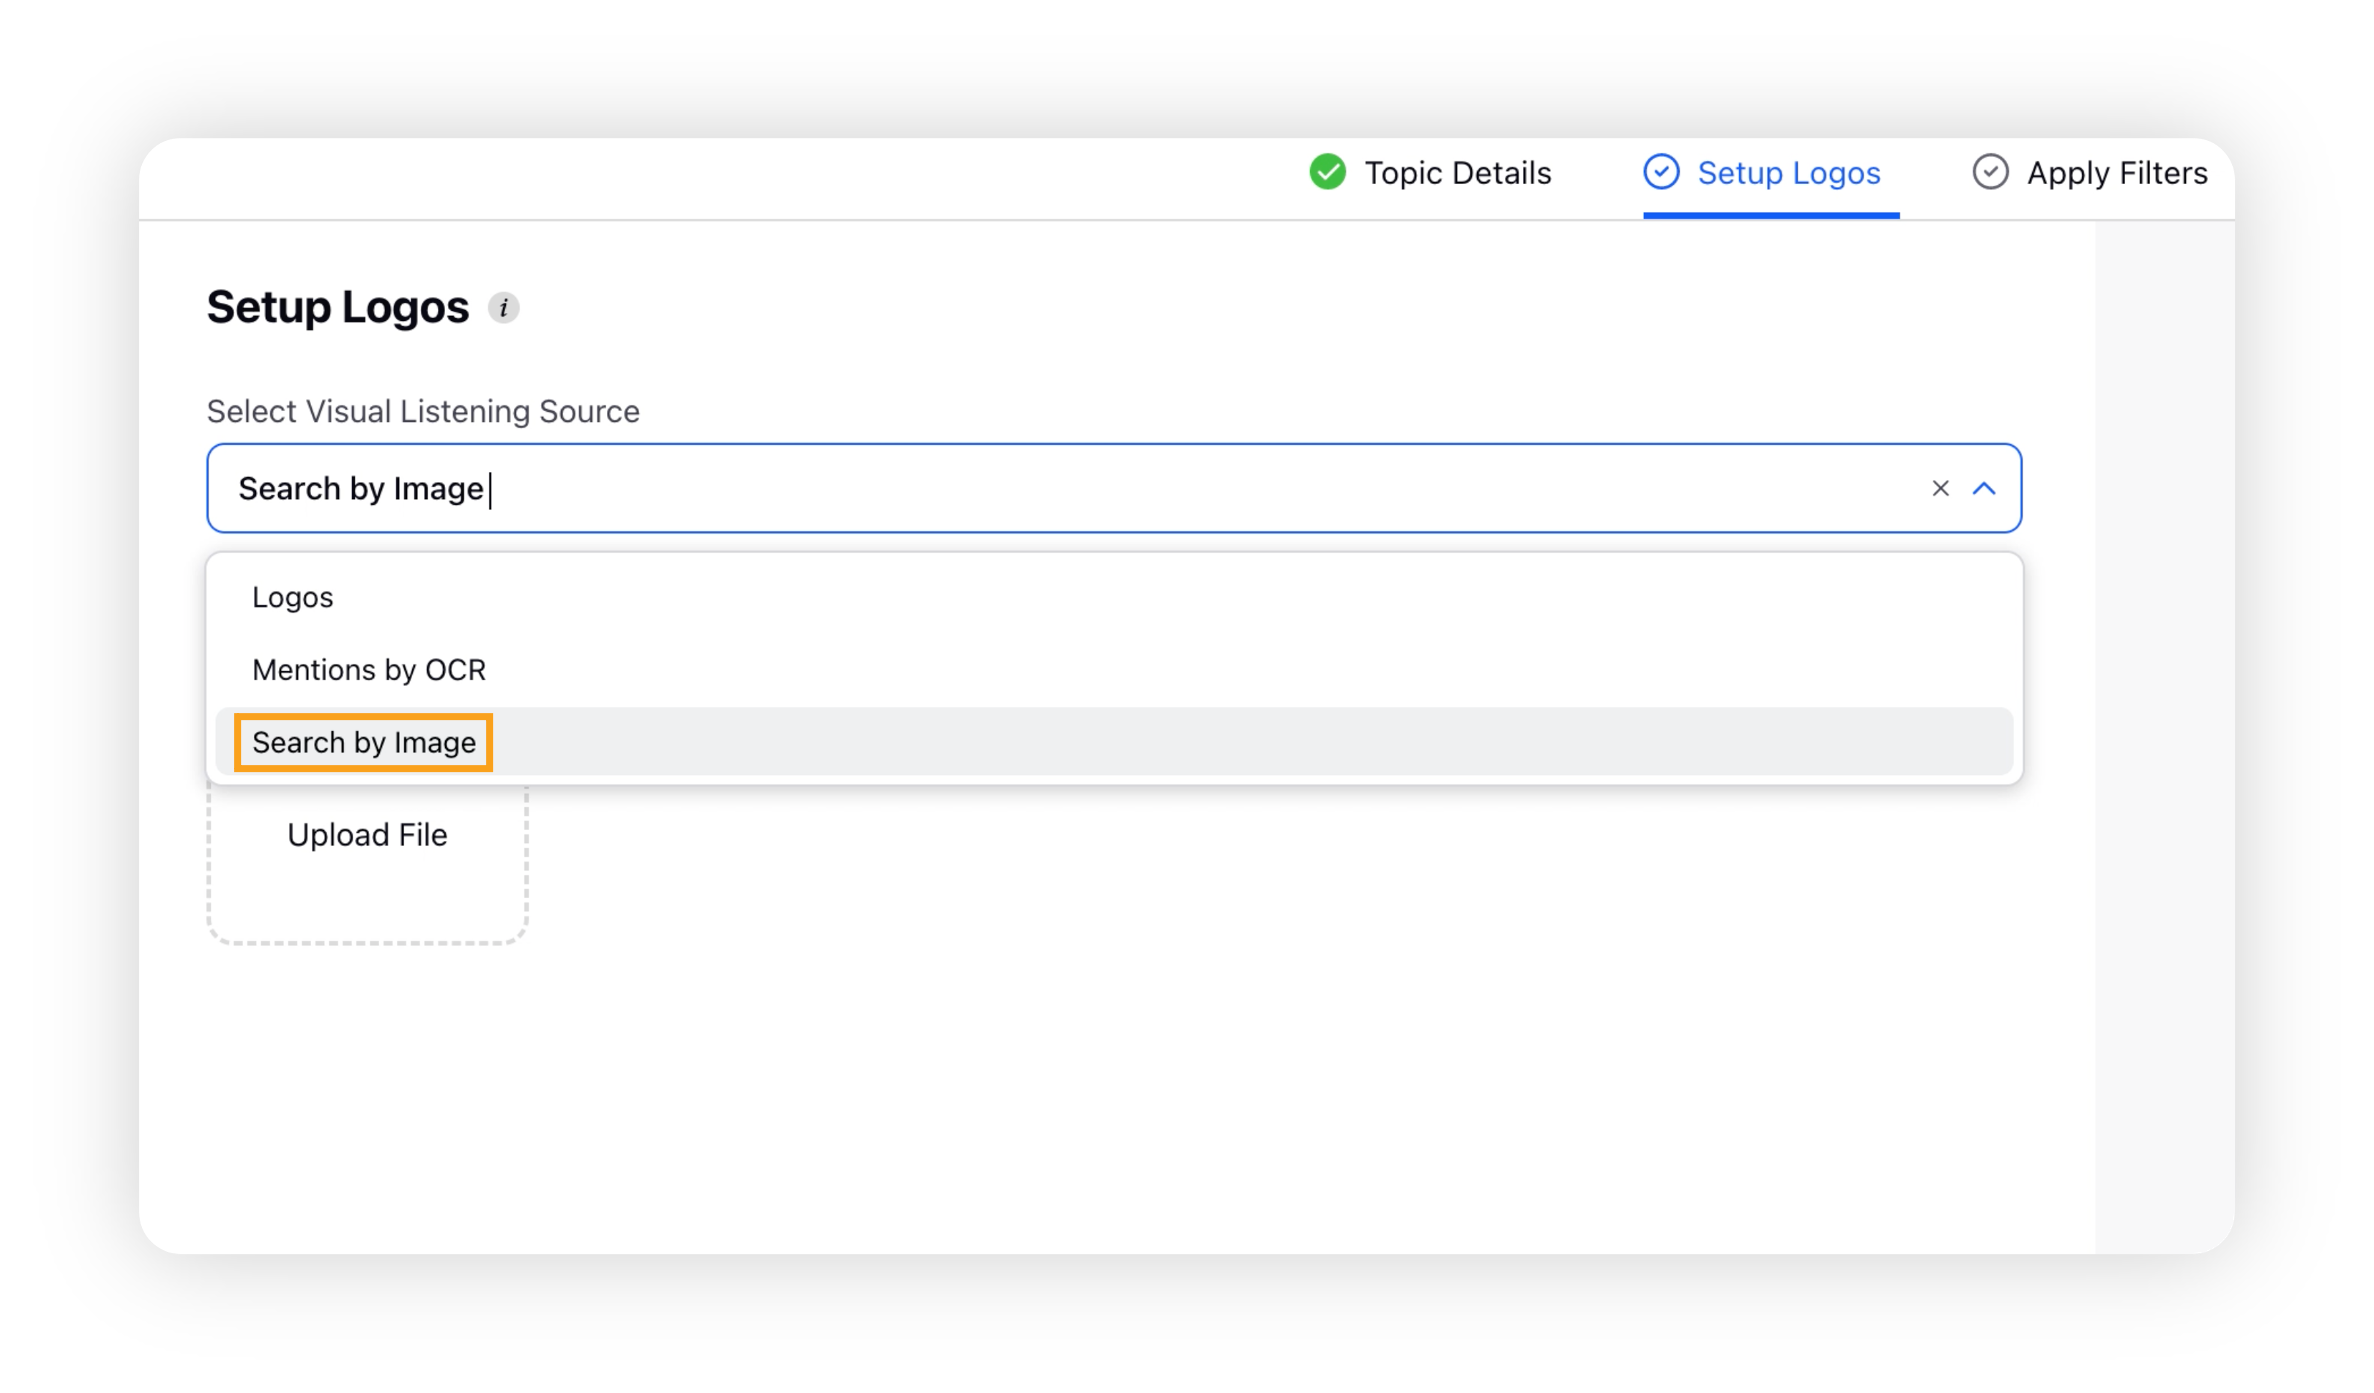
Visual Insights | Introducing "Search by Image" Functionality
Gain actionable insights by analyzing images to identify similar posts and measure their engagements. With the help of the Search by Image functionality, you can –
Search, monitor, and measure the virality of brand-related images across social and web channels.
Identify non-approved images proactively to prevent brand reputation risks.
Social Listening
Listening | Introducing User-level Filtering
Introducing improved sharing permission for the dashboard allowing users to share the dashboard with Edit & View access, as per the requirement. The flexibility of sharing permission will allow the end user to perform different levels of actions. Users with view access can now apply filters to their dashboards, tailoring the displayed information to their specific needs without altering the underlying configuration.
Below are the key benefits of user-level filtering –
Improved sharing permission allowing you to share a dashboard with view or edit access providing end user with smooth filtering & customization
Multiple users can a single dashboard to get insights by viewing, analyzing, and filtering in user context without altering the dashboard for other users
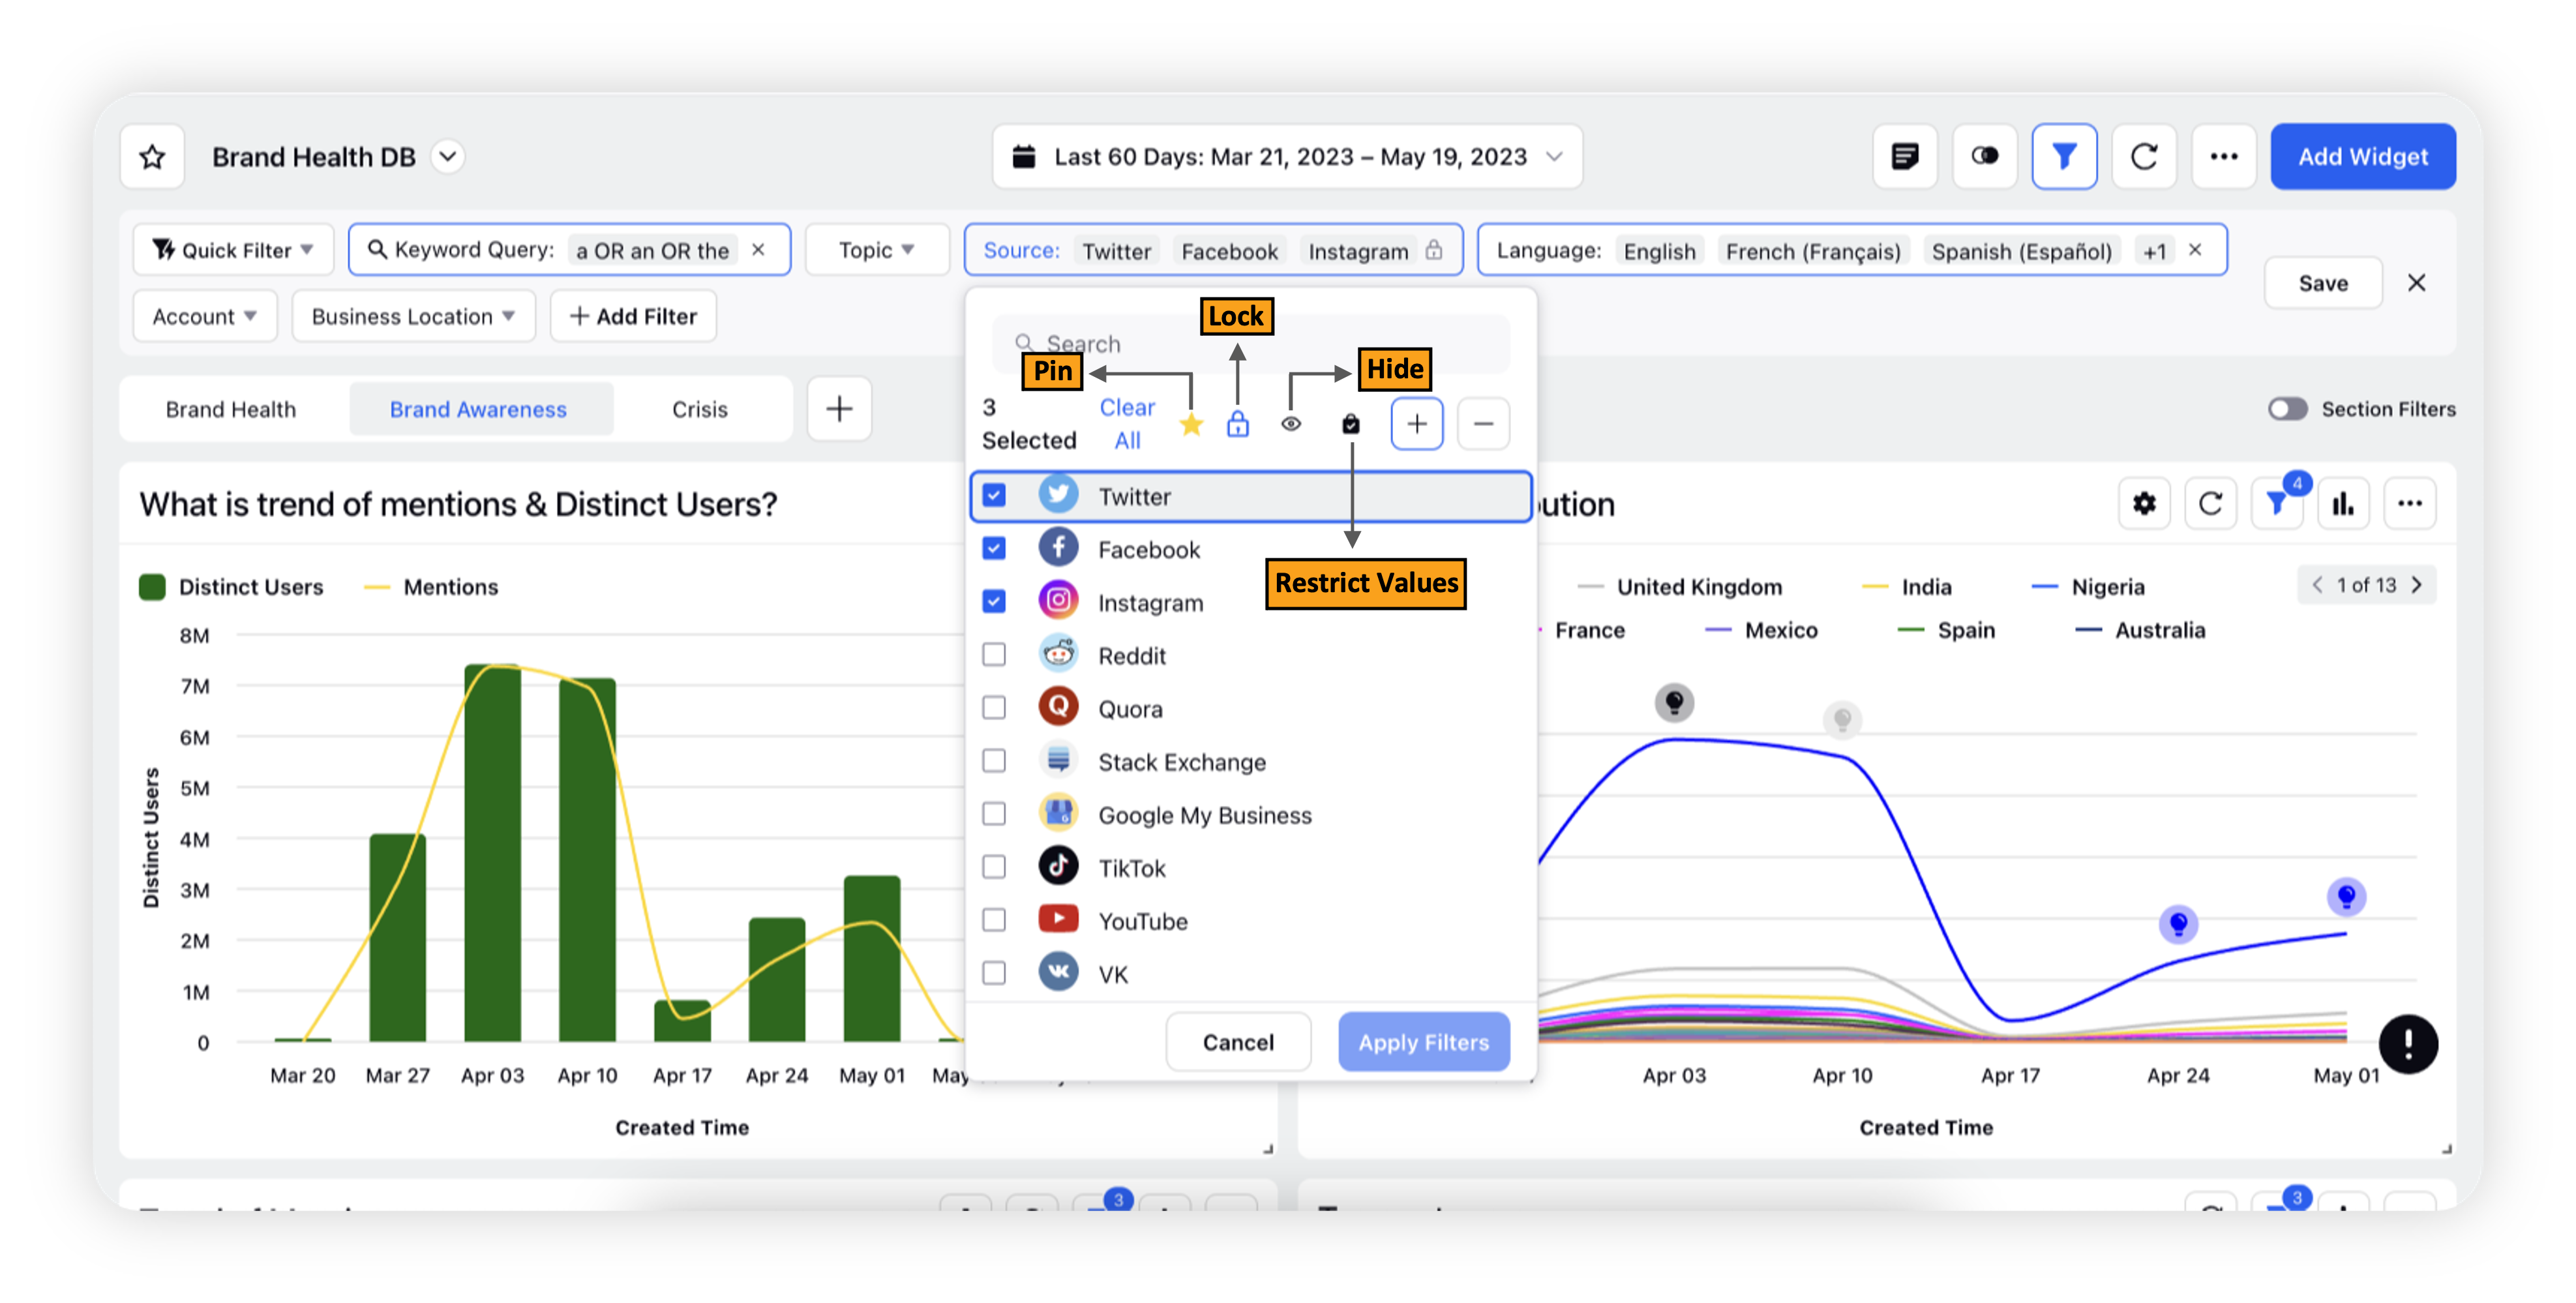
Use metric-based filters for robust & in-depth reporting and leverage filter controls (Pin, Lock, Hide, Restric Values) to maintain data context & governance needs
![]() Enablement note: To get this capability enabled in your environment, please work with your success manager.
Enablement note: To get this capability enabled in your environment, please work with your success manager.
![]() Internal note: The following DPs need to be enabled along with migration of the dashboards –
Internal note: The following DPs need to be enabled along with migration of the dashboards –
DPs to be turned ON
ENABLE_NEW_ASSET_GOVERNANCE
ANALYTICS_EDIT_MODE_V2
UNIFIED_DASHBOARD_VIEW_EDIT_FILTERS_ENABLED
DP to be turned OFF
USER_DASHBOARD_SECTION_WIDGET_FILTERS_ENABLED
Migration of the existing dashboards to be done
Listening | Strengthen Your Brand Monitoring with our Podchaser Integration
Expand Listening capabilities with 4.5M+ new podcasts and 170M+ episodes. Search within podcast titles, descriptions, and transcripts (of top 5k podcasts) to effectively track and analyze brand mentions. Get additional podcast insights including podcast hosts' information, reach, and demographics data.
Listening | Ability to Highlight Listening Keywords in Engagement Dashboards
For Listening, Product Insights, and Location Insights columns in an Engagement dashboard, we have introduced the highlight option that will highlight the Topic keywords, Theme keywords, and Keyword List keywords. Get more use of Topics, Themes, and Keyword Lists by seeing where the keywords show up in your Listening messages or identify the phrases and locations users are mentioning.
Listening | Introducing Bulk Tagging for Topics, Themes & Dashboards
Now, you can easily apply tags to multiple Topics, Themes, or dashboards simultaneously. Simply select the desired Topics in the record manager, and a convenient snackbar will appear at the bottom of the screen, offering an option to add tags. By clicking on the option, you can enter the tags you wish to assign to those 50 Topics.

This time-saving functionality is perfect for efficiently applying the same tags to multiple Topics/Themes/Dashboards, eliminating the need to add tags individually to each one. Simplify your workflow and enhance organization with our latest update!
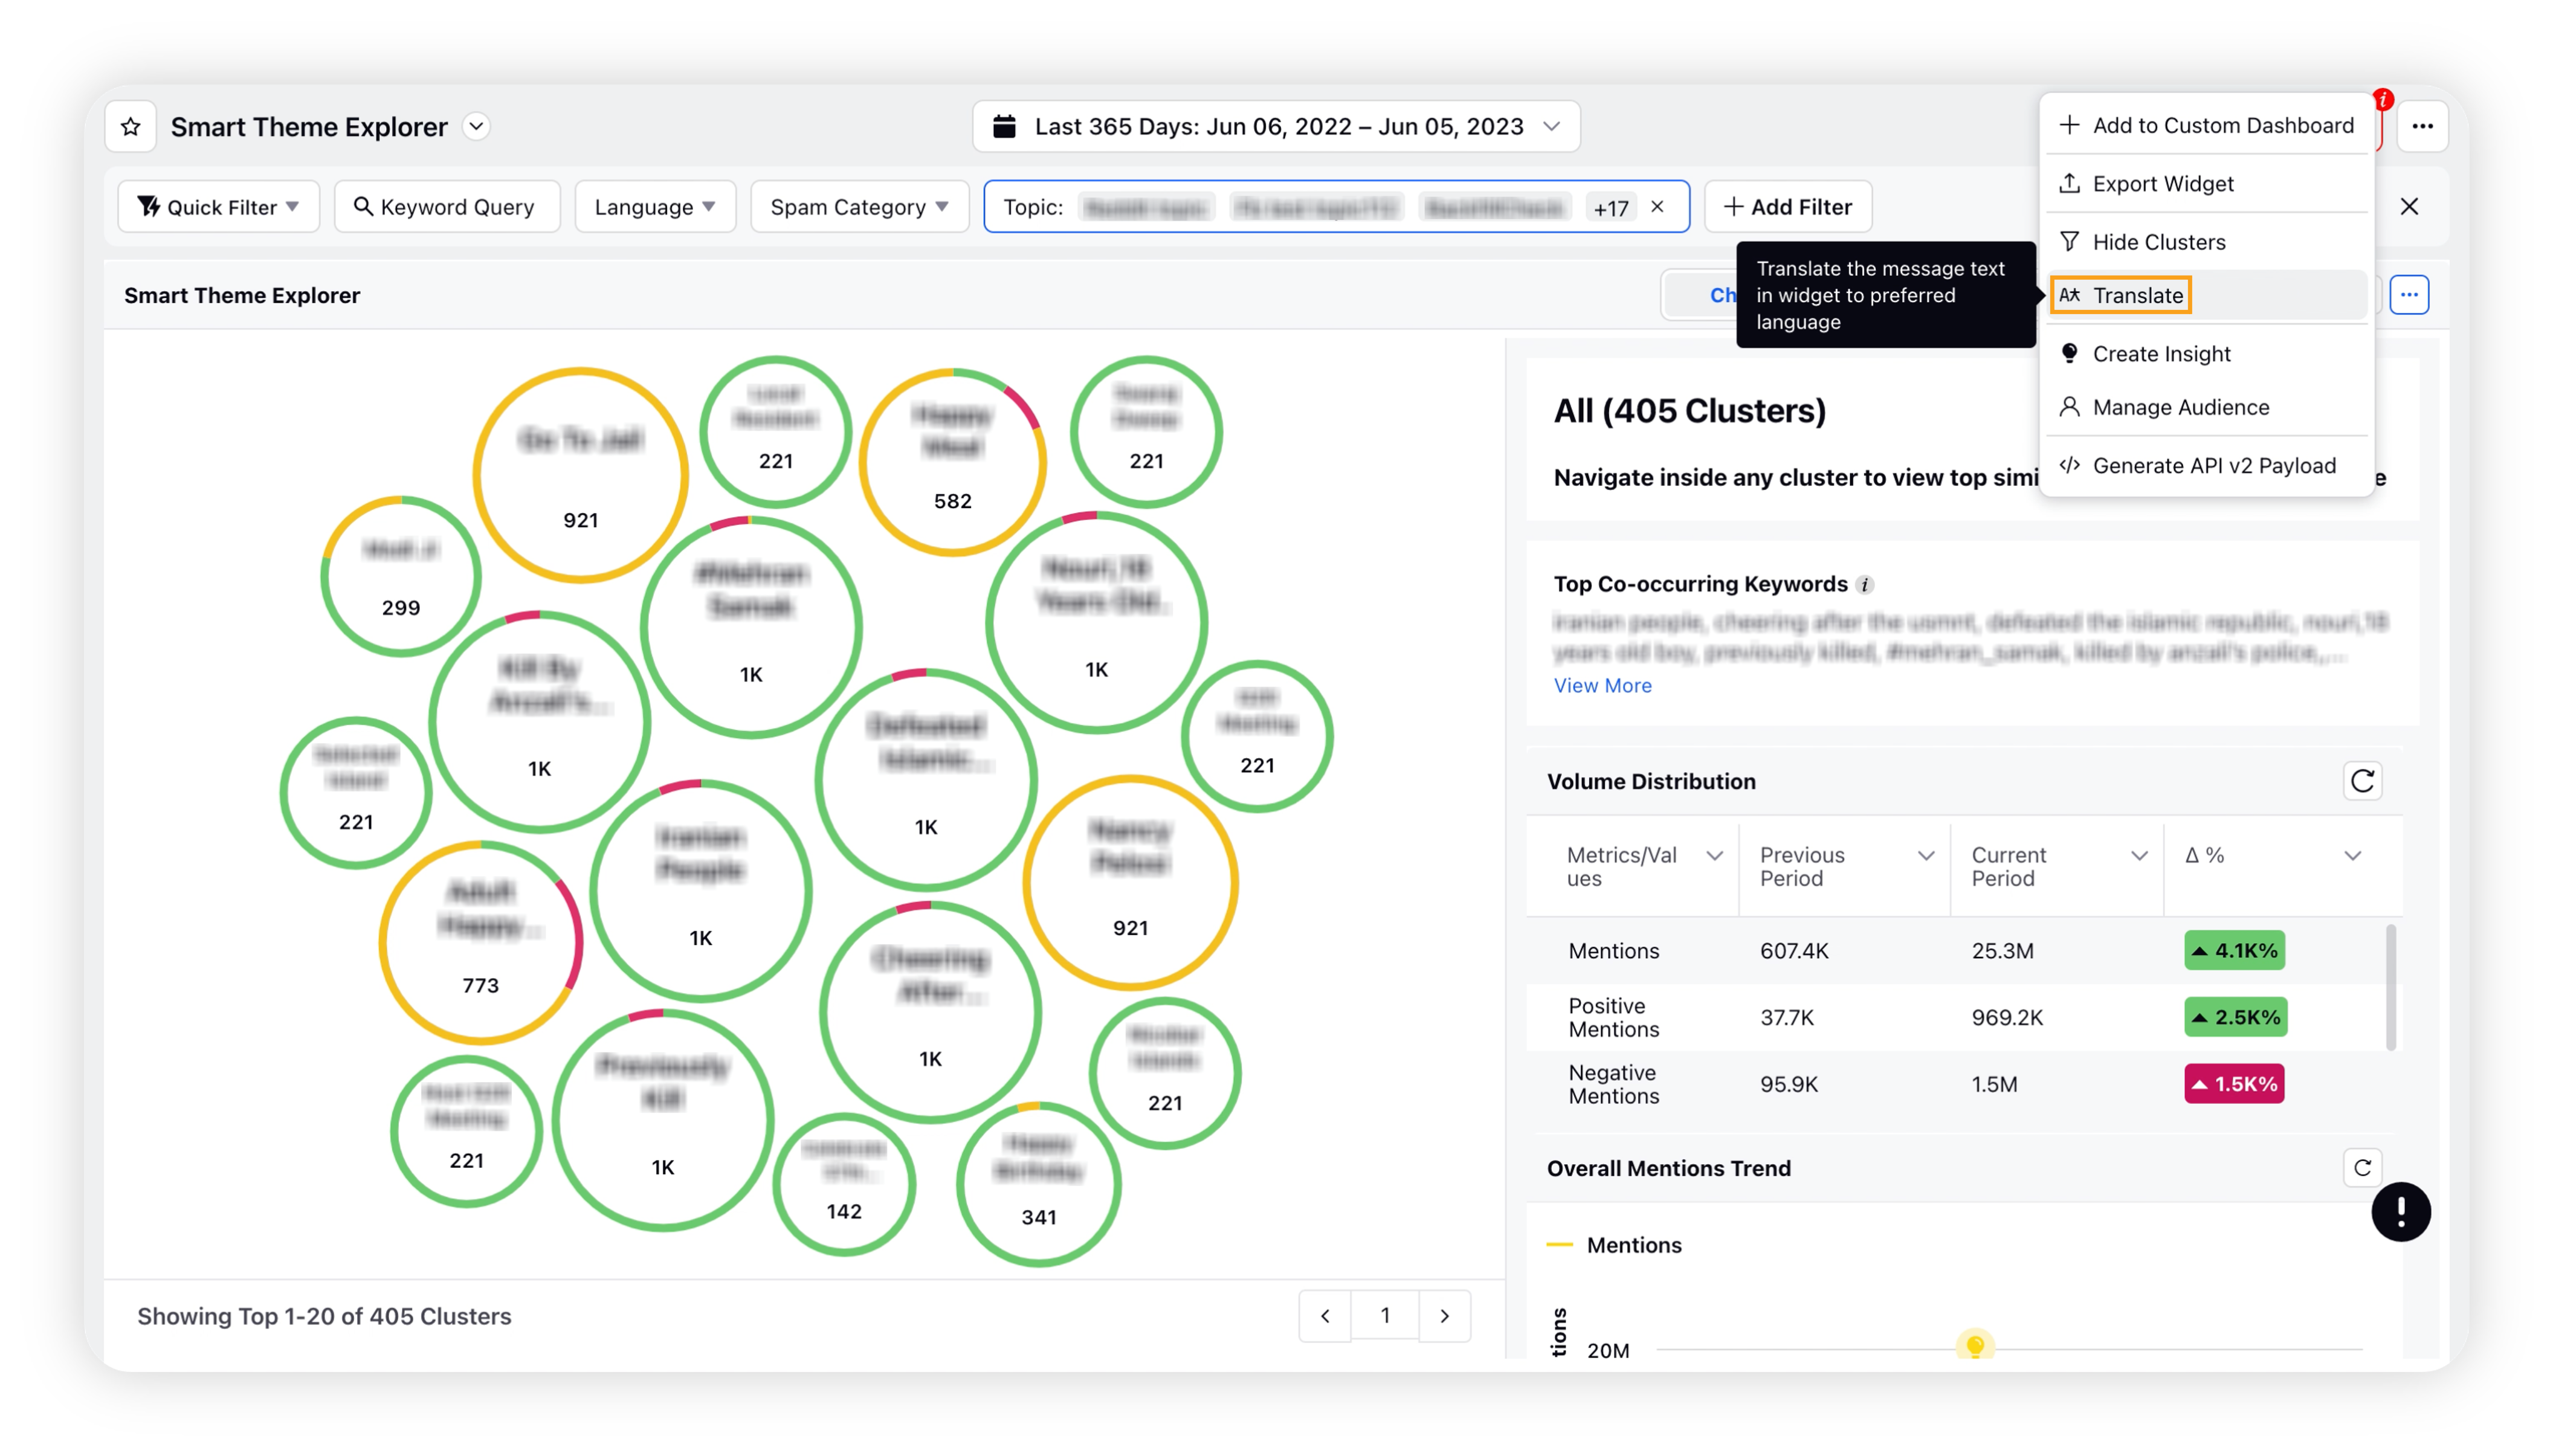
Listening | Added Translation Support for Smart Theme Explorer and Smart Cluster Widget
We have added translation support for the Smart Theme Explorer standard dashboard and widget. The translation option will be available within the 3-dot options icon. Using this feature, you can easily translate the below entities in the desired language –
Cluster & sub-cluster labels
Top-Similar Keywords
Top Co-Occurring Keywords
Conversation Stream (in the right pane)
![]() Note:
Note:
If you apply translation at the dashboard-level on a custom dashboard containing a Smart Theme Explorer widget, this will translate the Smart Theme Explorer widget.
If you export the translated Smart Theme Explorer widget, the export file (PDF, PNG & Excel) will have the translated cluster names.
Listening | Ability to Use Metric-based Dimensions at Dashboard, Widget, and Section-level Filter
We have introduced 7 new metric-based dimensions that you can use as a filter at the dashboard-level, widget-level, and section-level –
User Follower
Experience Score
Likes Count
Twitter Retweets
Earned Engagement
Twitter Favorites
Comments Count
For example, you plot an Earned Engagements metric on a widget along with other metrics/dimensions. The earned engagement data shows up in the widget. Now you want to filter the widget by Earned Engagement > 500. What you can do here is you can select the Earned Engagement (Dimension) in the Add Filter section, Greater than as condition, and 500 as a value.
Listening | Ability to View Description of Metric/Dimension Upon Hovering Over it
Introducing a new feature in our dashboard – hovering over any metric or dimension plotted on a widget will now provide you with a detailed description of the metric/dimension. You will also see a list of supported sources for that particular metric/dimension. Stay informed and gain deeper insights with our enhanced reporting experience!
Listening | Added Dashboard Description Popup
On Listening dashboards, we have added the dashboard description button clicking which you can provide a customizable description with rich-text support. You can also view the dashboard's description by clicking the same button. The objective of introducing this feature is to provide users a clear and concise overview of the information presented in the dashboard. A dashboard description serves as a guide or introduction to the dashboard, helping users understand the purpose, content, and key insights available.
Platform
Platform | Introducing Page Density Controls
Unlock the power of information with page density controls – tailor your viewing experience to your preference. By offering Compact, Comfortable, and Spacious modes, you will be able to tailor your viewing experience, thereby enhancing productivity and satisfaction. Choose a suitable page density to govern the level of information visible on a single screen.
Media Insights
Media Insights | Added Chart Support for Newsletters
You can now include data visualizations in both automated and manual Newsletters, delivering comprehensive and visually appealing reports to stakeholders. While creating a Newsletter, you can access a dedicated section within the content library containing various charts. By simply dragging and dropping the desired charts into the Newsletter, you will be prompted with the widget builder wherein you can configure the visualization.

Media Insights | Added 'Group By' Option within Inline Editable Table Widget
We have added pivoting within the Inline Editable Table widget to organize and manage your content effectively. You can easily group similar articles and update the "PR tags" and "custom fields" by leveraging stories as a grouping dimension.
![]() Enablement note: To enable this feature in your environment, please work with your success manager.
Enablement note: To enable this feature in your environment, please work with your success manager.
![]() Internal note: Use this DP to enable this feature – LST_MULTI_AXES_PIVOT_INLINE_EDITABLE_TABLE_ENABLED
Internal note: Use this DP to enable this feature – LST_MULTI_AXES_PIVOT_INLINE_EDITABLE_TABLE_ENABLED
Product Insights
Product Insights | Ability to Highlight Attribute Categorization in Insights Phrase
In the Conversation Stream widget, now it is easy to understand which insight phrase relates to what attribute category. We have added two functionalities here that will –
Display the relevant phrase in bold formatting: The insight phrases pertaining to a particular attribute category (L1, L2 & L3) will be displayed in bold in the Conversation Stream. This will be subject to the applied attribute-level filters and/or the attribute name being drilled-down upon.

Display the attribute hierarchy of phrase: The attribute taxonomy will be visible upon hovering over the insight phrase in the Conversation Stream.
