What is a customer effort score (CES)?
Customer effort score (CES) is a customer satisfaction metric that indicates the amount of effort customers usually expend while interacting with your business. The customer effort score quantifies the effort a customer puts in to get their question answered, an issue fixed or buy/return a product.
Measuring and keeping track of your customer effort score on a regular basis helps reduce churn as it brings to light previously overlooked customer pain point(s).
How does customer effort score work?
A customer effort score survey is generally deployed at the end of a customer interaction, such as a support call or a purchase.
Deployed after key touchpoints, like a support ticket's resolution or product transaction, it prompts customers to rate, how effortless it was to resolve their issue or engage with the brand. The scale typically runs from one to 10.
Immediate deployment ensures accuracy, capturing fresh experiences and perceptions. Coupled with open-ended questions, CES provides minute feedback, pinpointing improvement areas.
Commonly, a high CES correlates with increased customer retention.
For instance, after using an e-commerce site's return process, a customer might rate "5" if they found it cumbersome to navigate and "9" if it was straightforward. Analyzing such scores helps your business to detect friction points, optimize the customer journey and boost retention.
When to use customer effort score
If you witness your customers leaving their journey before or right after completing their intended action, e.g., purchase of your product, a CES survey can help you figure out the root cause of the drop.
A customer effort score survey is best deployed after any of these three touchpoints:
After a purchase is made: This helps fix any anomalies during the checkout process that either result in an unusually high number of unsuccessful transactions or cart abandonments.
After a customer support interaction: This sheds light on your support team’s efficiency, especially in terms of average handle time for resolving tickets — allowing you to revisit best practices and address shortcomings, if any.
After the delivery of a product or service: Online shopping is the new normal and deliveries are a fundamental part of the overall customer experience. Asking a customer to answer a few CES survey questions soon after their product is delivered will help improve your last-mile delivery.
CES vs. NPS vs. CSAT: When to use which survey
Among all customer experience metrics, three stand out for their ubiquity and diagnostic power: CES, NPS and CSAT. Each metric offers a unique lens through which to understand customer sentiment, happiness and loyalty. Let's dissect their individual applications, nuances and differentiating factors to know when to use each.
Parameter | CES (Customer Effort Score) | NPS (Net Promoter Score) | CSAT (Customer Satisfaction) |
Primary Focus | Ease of interaction or task completion | Overall customer loyalty to a brand | Immediate satisfaction from an interaction or service |
Question Style | "How easy was it to...?" | "How likely are you to recommend...?" | "Are you satisfied with...?" |
Scale | Typically 1-10 (Difficult to Easy). | -100 to +100 (Detractors to Promoters). | 1-5 (Unsatisfied to Very Satisfied). |
Timing | Immediately after a specific interaction | Periodically to gauge overall loyalty | After specific touchpoints or interactions |
Best Used For | Process improvements, usability feedback, root cause analysis | Long-term strategic planning, growth potential | Service quality, individual touchpoint assessment |
Interpretation | Lower scores indicate higher effort, which is negative | Higher scores indicate greater loyalty | Higher scores indicate better satisfaction |
Actionable Insights | Identifies friction points in a process | Assesses brand health and areas for strategic improvements | Pinpoints strengths and weaknesses in specific interactions |
Temporal Relevance | Short-term; focuses on immediate processes | Long-term; reflects overall brand sentiment. | Short-term; immediate feedback on interactions |
Industry Application | Highly relevant for digital products, software and complex services | Broad application across industries | Typically used in service industries, retail and support |
Understand that while each metric has its unique strengths and applications, they can be used in tandem for a comprehensive view of your in-store and digital customer experience.
Why measure customer effort score?
Large enterprises operate on a scale where minor friction can magnify into major setbacks. They can use CES to refine these micro-interactions, building seamless experiences across vast customer bases.
Effort insight: CES swiftly gauges the workload customers face when engaging with enterprises.
Behavior forecaster: CES can flag customer dissatisfaction and indicate potential churn. That’s why measuring customer effort score can help with reducing customer churn.
Problem spotter: CES zeroes in on exact trouble zones, enabling priority-driven fixes to elevate the customer journey.
Improvement compass: Feedback from CES charts the course for precise upgrades, cutting down customer frustration sources.
Employee engagement: Deploying CES actively involves the workforce, nurturing a collective drive to uplift the customer experience.
Competitive edge: Crafting a hassle-free experience, amplified by CES, sets businesses a cut above
Tips for creating a CES survey
Keeping your customer effort score survey brief, simple and timely is just the beginning. If you want to improve your survey response rate and extract meaningful insights, these expert tips can help you get there.
1. Moment of relevance: Deploy customer effort score survey immediately post-interaction. The immediacy captures raw, unfiltered feedback about the customer's latest experience, be it after a purchase or a chat with support.
2. The deep dive question: After gauging the effort level, follow up with an open-ended 'Why?' question. Doing so reveals the underlying reasons for their rating, offering richer insights than numeric scores alone.
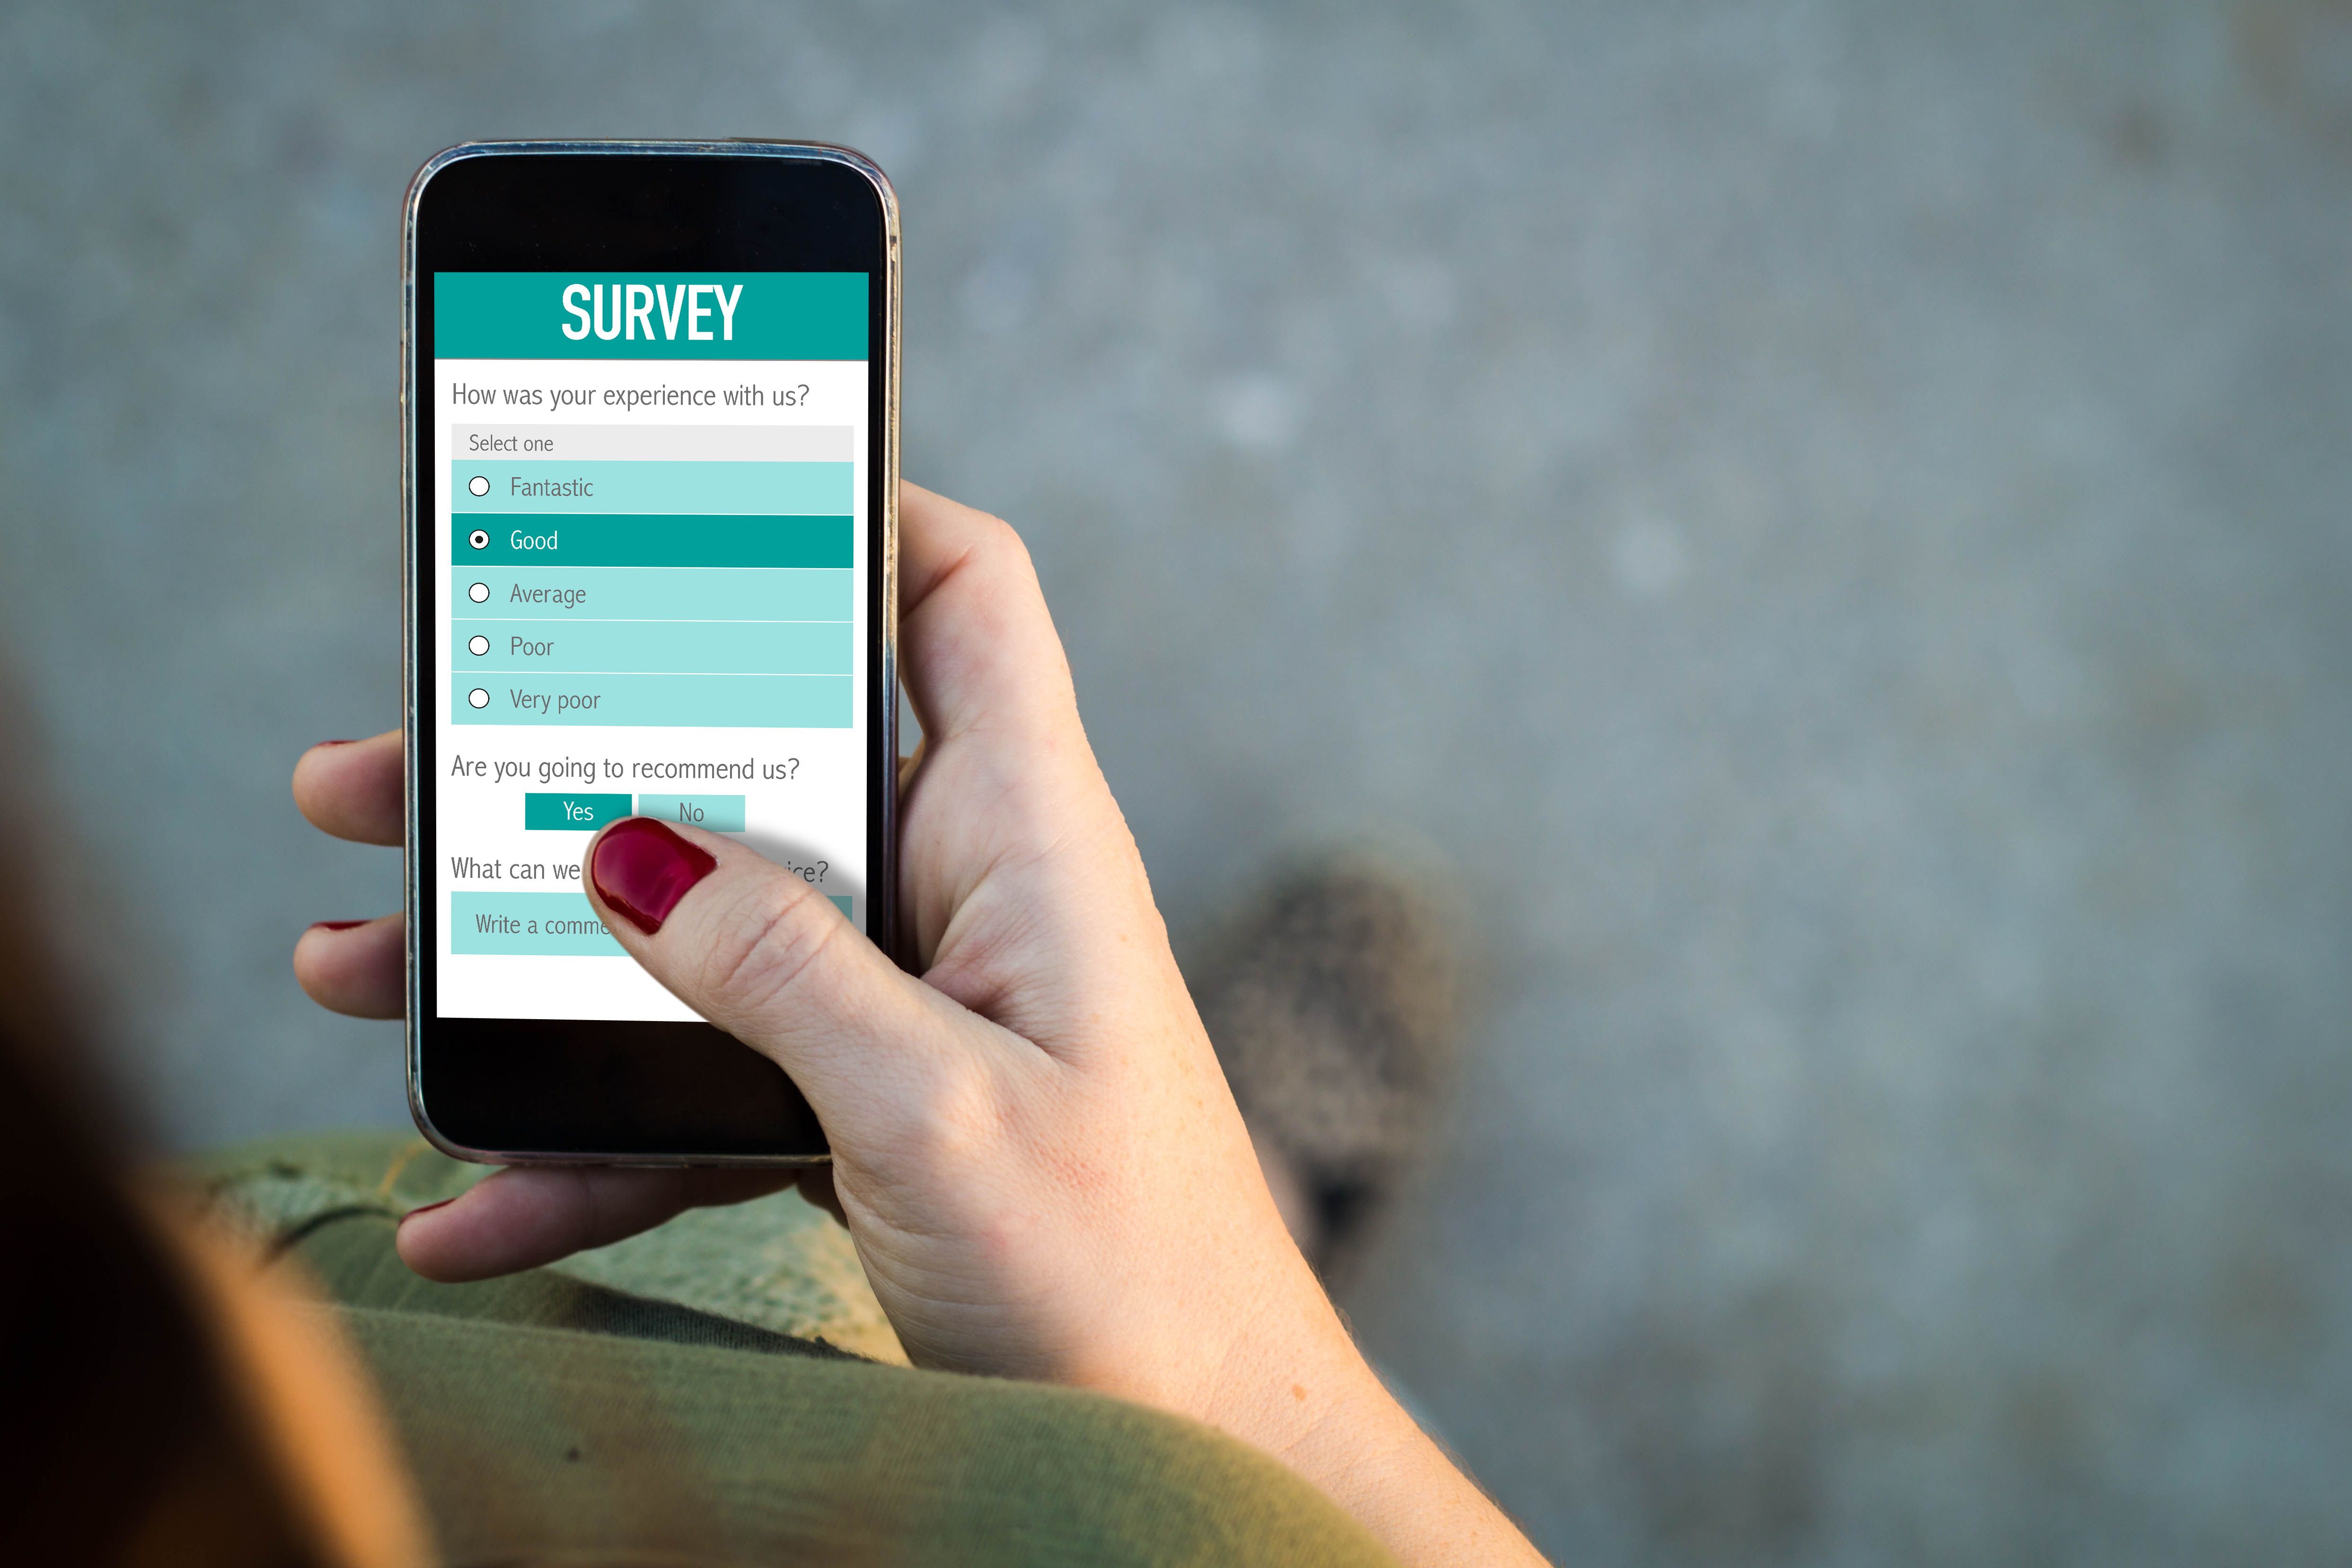
3. Mobile-first approach: With the majority of interactions shifting to mobile, your CES survey design should prioritize the medium. Streamline design elements and structure response options with positives at the top, descending to negatives.

4. Automation is necessary: Use customer service automation that integrates with your CES survey to trigger post-interaction workflows. By doing so, you ensure timely survey dispatch, eliminating the manual process and ensuring consistency.
5. Clarity over clutter: Focus on brevity. A concise, single-question survey, devoid of leading cues, ensures genuine responses without overwhelming the respondent.
6. Contextualized questions: Tailor your customer effort score survey based on the interaction type. For instance, post-sales queries might differ from post-support ones. Specificity enhances the relevance of feedback.
7. Feedback pulse: Rather than inundating customers with surveys after every interaction, maintain a pulse. Gauge the optimal frequency based on patterns in customer engagement to prevent survey fatigue.
Bonus tips:
While a seamless survey process for customers stands paramount, it’s key to manage the back-end handling of feedback.
Frontline feedback loop: Equip customer-facing teams with real-time feedback, allowing immediate interventions that can turn potential churn into loyalty.
Data democratization: Make survey findings accessible to relevant teams. This cross-functional visibility encourages collective brainstorming and solutioning, rather than siloed fixes.
Data visualization: Present your CES results graphically. Visualization tools can highlight patterns and trends, making it easier for stakeholders to understand and act upon the data.
Pro-tip: Use a unified analytics and reporting solution to amplify the effect of your CES surveys. It can help you swiftly identify issues customers report — whether it's delivery delays alerting the Operations team or complex product usability raising red flags in Product Development and Customer Success.
The visual translation of survey data makes these insights effortlessly interpretable, acting as a beacon for each department. It aids businesses in unifying insights, bringing every team on the same page — triggering a team-wide action to reduce customer effort at each touchpoint.
Types of CES surveys
A CES survey can be framed in the following ways:
1. 1-10 scale
The 1-10 Scale is the most straightforward CES survey method of all. The customer is asked a question such as “How easy was it to solve your problem?” which is accompanied by a 1-10 rating scale. A rating above 7 would mean the customer found the solution to their problem with ease. Conversely, if the question is framed in this manner, “How much effort did it take to solve your problem?”. A score between 1 and 3 would be considered ideal.

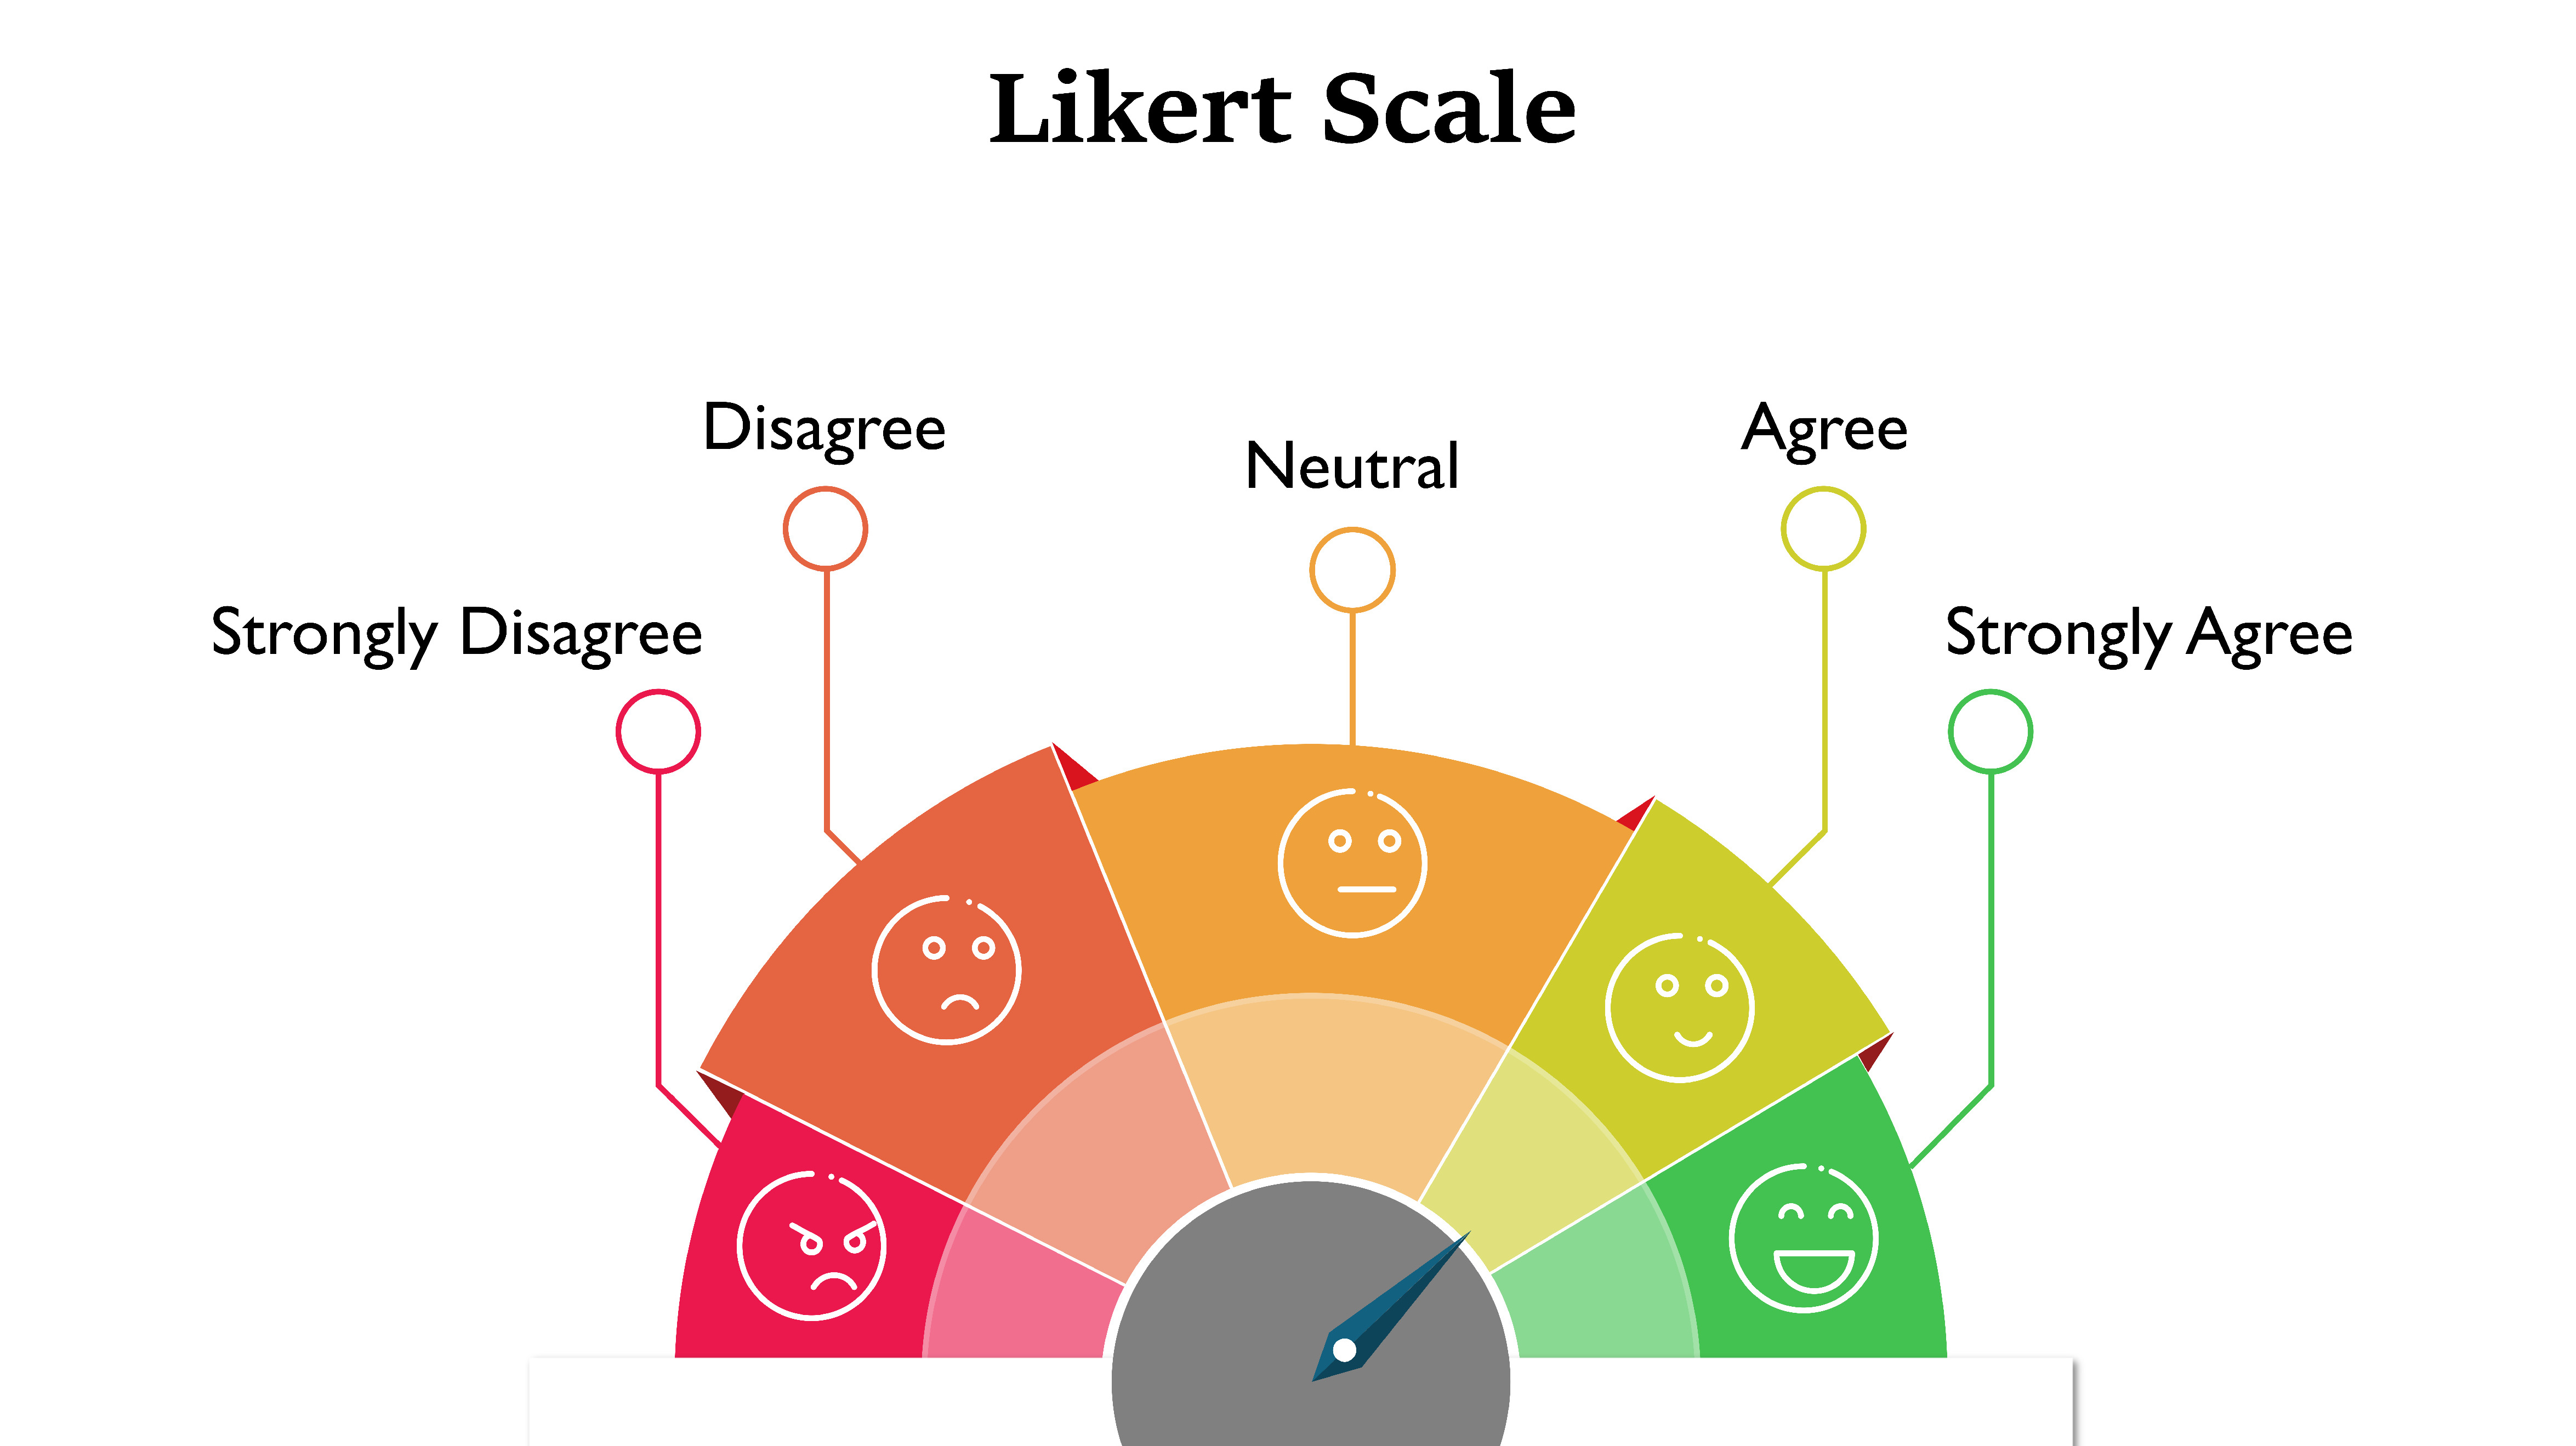
2. Likert scale
The Likert scale can either be a 5- or a 7-point rating scale. A statement such as, “The company made it easy for me to solve my problem” is presented to the customer. This is followed by a multiple-choice question, “Do you agree?” The customer can select an option from a list that ranges from Strongly Disagree to Strongly Agree. A 5-point scale, as the name suggests, presents five options to the customer and a 7-point scale, seven.

3. Emoticon/emoji scale
A CES survey that employs an emoji scale method may ask the customer, “How easy was the checkout process?”, presented then with three emojis – happy face, neutral face and sad face. The happy face emoji represents minimum effort while the sad face represents maximum effort. Since this method can be very intuitive from a customer’s point of view, the emoji scale CES survey method is widely employed by businesses across industries.
Types of CES survey questions
Now, let’s go over some examples of questions you can ask your customers to gauge their exerted effort. Each question is distilled into the best-suited mode of customer survey, purpose and desired outcome.
Question: On a scale of 1 to 10, how swiftly were you able to address your concern?
Type: 1 to 10 Scale
Purpose: To evaluate the resolution timeframe from the customer's perception.
Expected outcome: A high score would point to efficient turnaround times, while low scores may point to lengthy or convoluted solutions.
Question: How effortless was your problem-solving journey?
Type: Emoticon
Purpose: To distill the customer's experience into a simple emotive response.
Expected outcome: A positive symbol would indicate minimal hiccups, while a negative one suggests an experience fraught with challenges.
Question: Rate the degree of effort you personally invested in navigating this issue.
Type: Likert Scale
Purpose: To quantify the user's active involvement and exertion
Expected outcome: Lower ratings imply a more intuitive interaction, whereas higher ratings suggest improvement zones.
Question: Reflecting on your interaction, how equipped did you find [name of service rep] to assist you?
Type: 1 to 10 Scale
Purpose: To ascertain the perceived capability of the service representative.
Expected outcome: Elevated scores suggest well-informed reps, while dips could hint at training gaps or resource inadequacies.
Question: When you [action taken, like signing up for a trial], did you find the process intuitive?
Type: 1 to 10 Scale
Purpose: To spotlight feedback on designated customer actions.
Expected outcome: Insights on how micro-interactions fare in the grand scheme of CX, marking clear avenues for refinement.

How to calculate customer effort score
Here are the three methods for customer effort score calculation.
1. 1 to 10-point scale
Calculation method:
Customer Effort Score = Total sum of scores/Number of responses
Example: If 100 people responded with scores that total 800, your CES would be:
CES = 800/100 = 8 out of 10
2. Emoticon scale
Calculation Method:
Subtract negative from positive response percentages, ignoring neutral ones.
Positive % = Number of Positive Responses/Total Responses * 100
Negative % = Number of Negative Responses/Total Responses * 100
Customer Effort Score = Positive % - Negative %
Example: Out of 400 respondents: 250 positive (🙂), 150 negative (😞).
Positive percentage = 250/400×100 = 62.5%
Negative percentage = 150/400×100 = 37.5%
CES score = 62.5% - 37.5% = 25%
3. 5-point Likert scale
Calculation method:
Calculate the percentage of respondents who gave positive responses, out of the total.
Positive Responses % = Number of Responses with 4 or 5 Ratings/Total Responses * 100
Example: Out of 100 respondents, 80 gave a score of 4 or 5.
Positive responses = 80/100×100 = 80%
Your CES score would be 80% on the 5-point Likert scale.
Remember, whichever method or scale you choose, the essence remains the same: A higher CES indicates less effort from customers, typically leading to better CX.
Comparing your CES against prior scores or industry benchmarks can offer insights into your CX strategy's effectiveness.
How to benchmark your CES score?
Benchmarking is the process of comparing your CES score against a standard. To create a solid benchmarking foundation, you need to deploy one of the three methods detailed below, tailored to give you actionable insights:
1. Competitor landscape benchmarking
Method: Analyze your CES score against that of your direct competitors.
Rationale: Identify the industry standard through competitive benchmarking. Every industry varies in terms of customer expectations. What's standard in banking might be radically different in retail.
Action plan:
Identify key competitors: List down your primary competitors. Seek out their CES scores, either from industry reports or customer feedback platforms.
Industry-specific insights: Understand nuances specific to your industry. In some sectors, a minor shift can cause customers to migrate.
Take strategic decisions: If your score trails behind a competitor, diagnose where the friction in customer experience lies and address it immediately.
2. Global standards benchmarking
Method: Contrast your score with global CES averages.
Rationale: This provides a broader perspective but requires an understanding of cultural and regional nuances.
Action plan:
Research global averages: Procure CES benchmarks for your industry on a global scale.
Adjust for regional differences: Acknowledge that scores might be influenced by regional tendencies.
Strategize with context: Tailor customer experience improvements considering these global insights, but always weigh them against your primary market's characteristics.
3. Self-comparison benchmarking
Method: Evaluate your current CES score against past metrics.
Rationale: Your past performance sets a tangible metric to beat.
Action plan:
Maintain a CES history: Ensure you have data logs of past CES scores, at least on a quarterly basis.
Evaluate growth trends: Observe how your score has changed over time. A consistent rise signifies you're doing something right, while dips indicate areas of concern.
Iterate rapidly: If you spot negative trends, respond with urgency. Re-survey customers, if necessary, to find the pain points and act on them.
3 Ways to improve customer effort score for your business
To bring in a better positive CES score, your business needs to take a preemptive approach.
Behavioral path analysis: Examine user flow to discern navigation patterns. Identify frequent drop-off points or areas of undue repetition — restructure them for smoother customer experiences.
Real-time feedback integration: Implement a feedback mechanism that allows immediate action on feedback, not post-facto.
Proactive escalation management: Monitor live chats for sentiment shifts, tone variations and intent indicators. Use these insights to foresee and address potential issues before they escalate.
Boosting your CES score isn't about gut feelings — it's about strategic maneuvers.
Dive deep into user pathways and fine-tune those routes. Use the subtleties of live chats to predict and prevent issues. And here's the cherry: deploy customer surveys that read the room (or website) and pop up just when your users want to share.
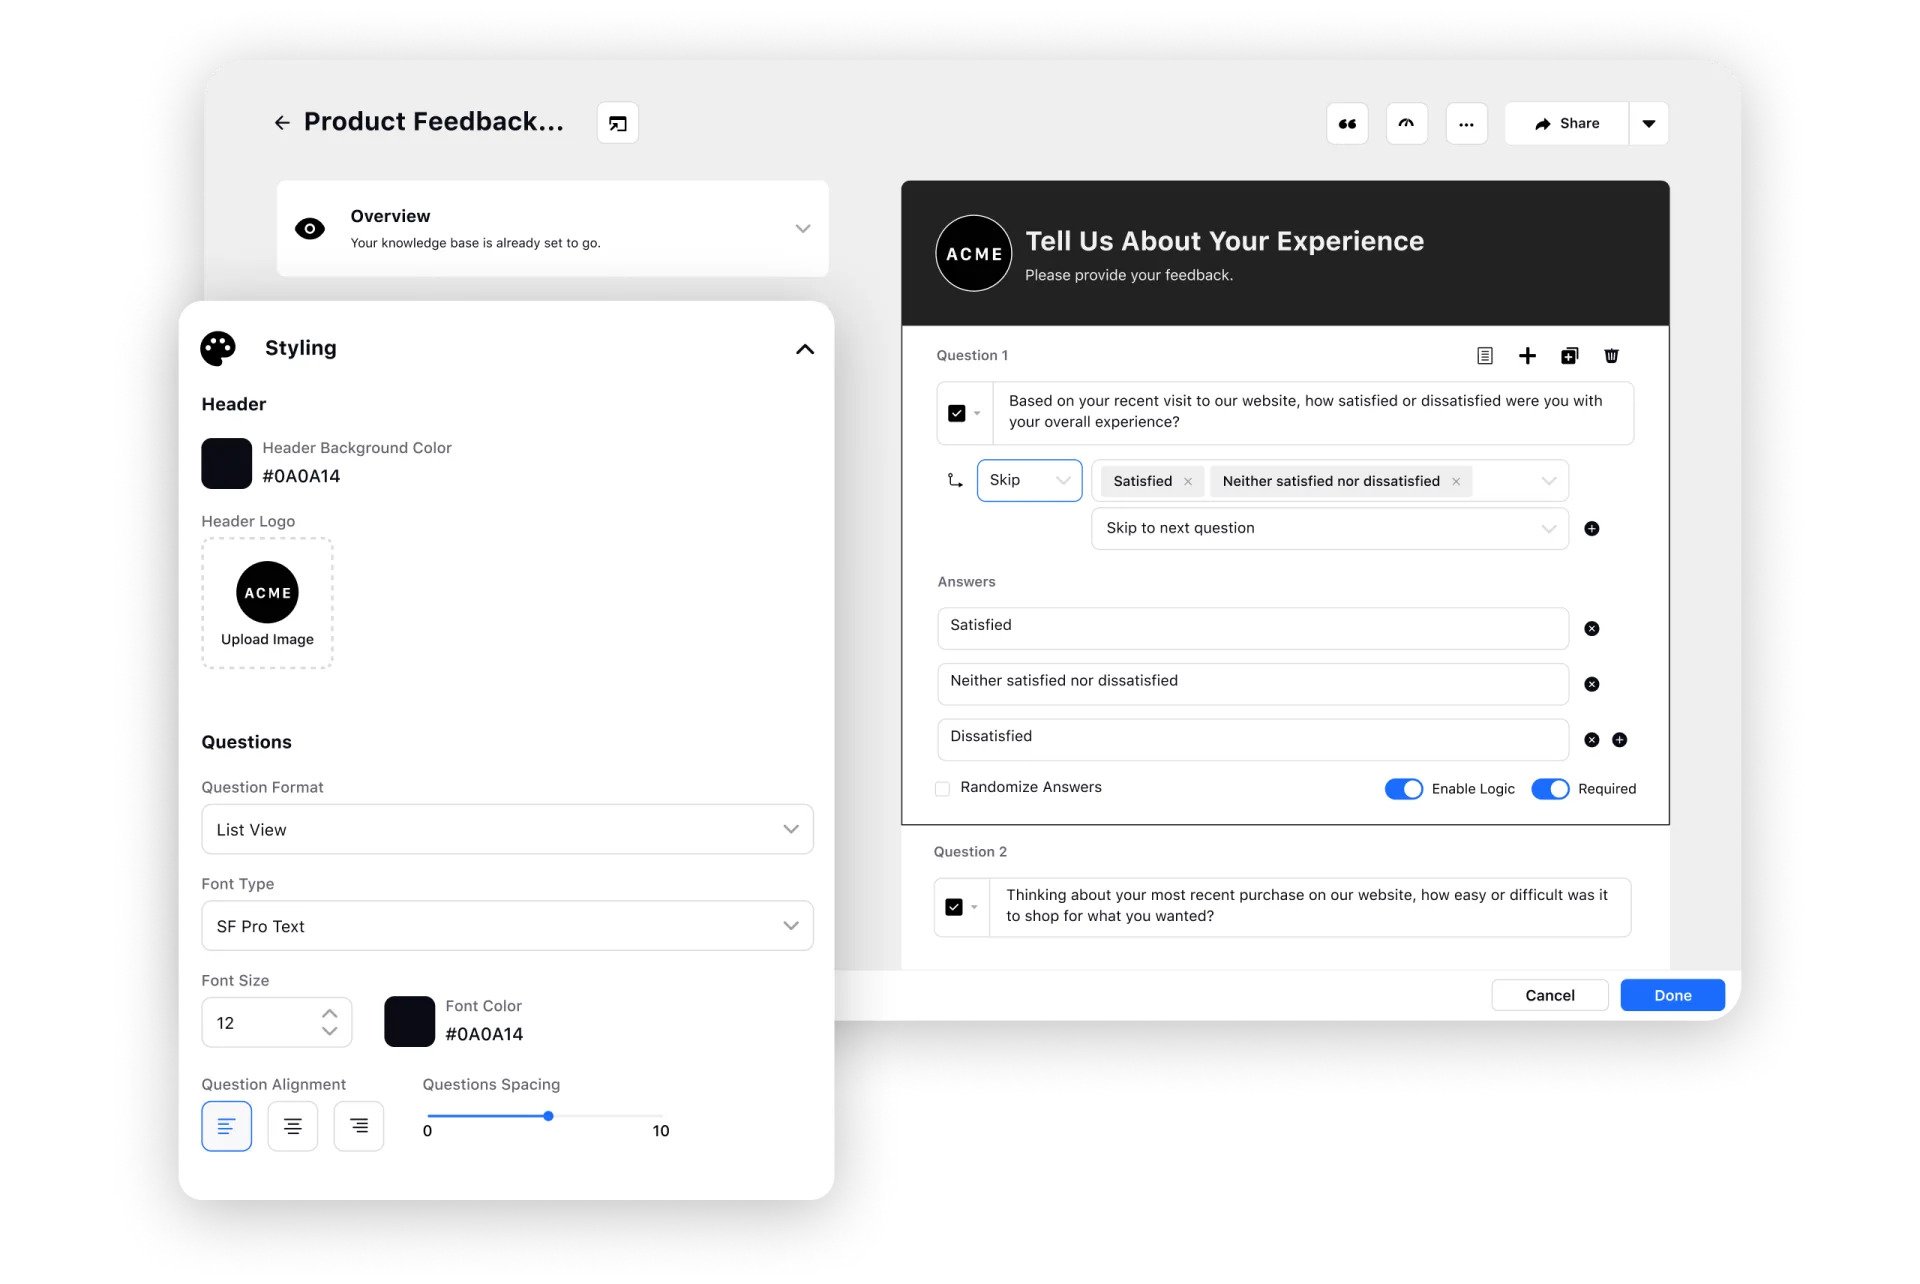
Now, imagine doing all this and more with Sprinklr power. Craft a single survey and watch it adapt across channels, always wearing your brand's signature look.
Whether on desktop or mobile, the experience remains flawless. And when text feels mundane? Your surveys convert into dynamic bot conversations.
Request a demo - to explore Sprinklr capabilities!
Frequently Asked Questions
Examples include questions like: "How easy was our website to navigate?", "Was resolving your complaint straightforward?", or "Rate the simplicity of setting up our product." These gauge the effort customers exert in interactions.
Thank you for contacting us.
A Sprinklr representative will be in touch with you shortly.
Contact us today, and we'll create a customized proposal that addresses your unique business needs.
Request a Demo
Welcome Back,
No need to fill out any forms — you're all set.


