


The global leader in enterprise social media management
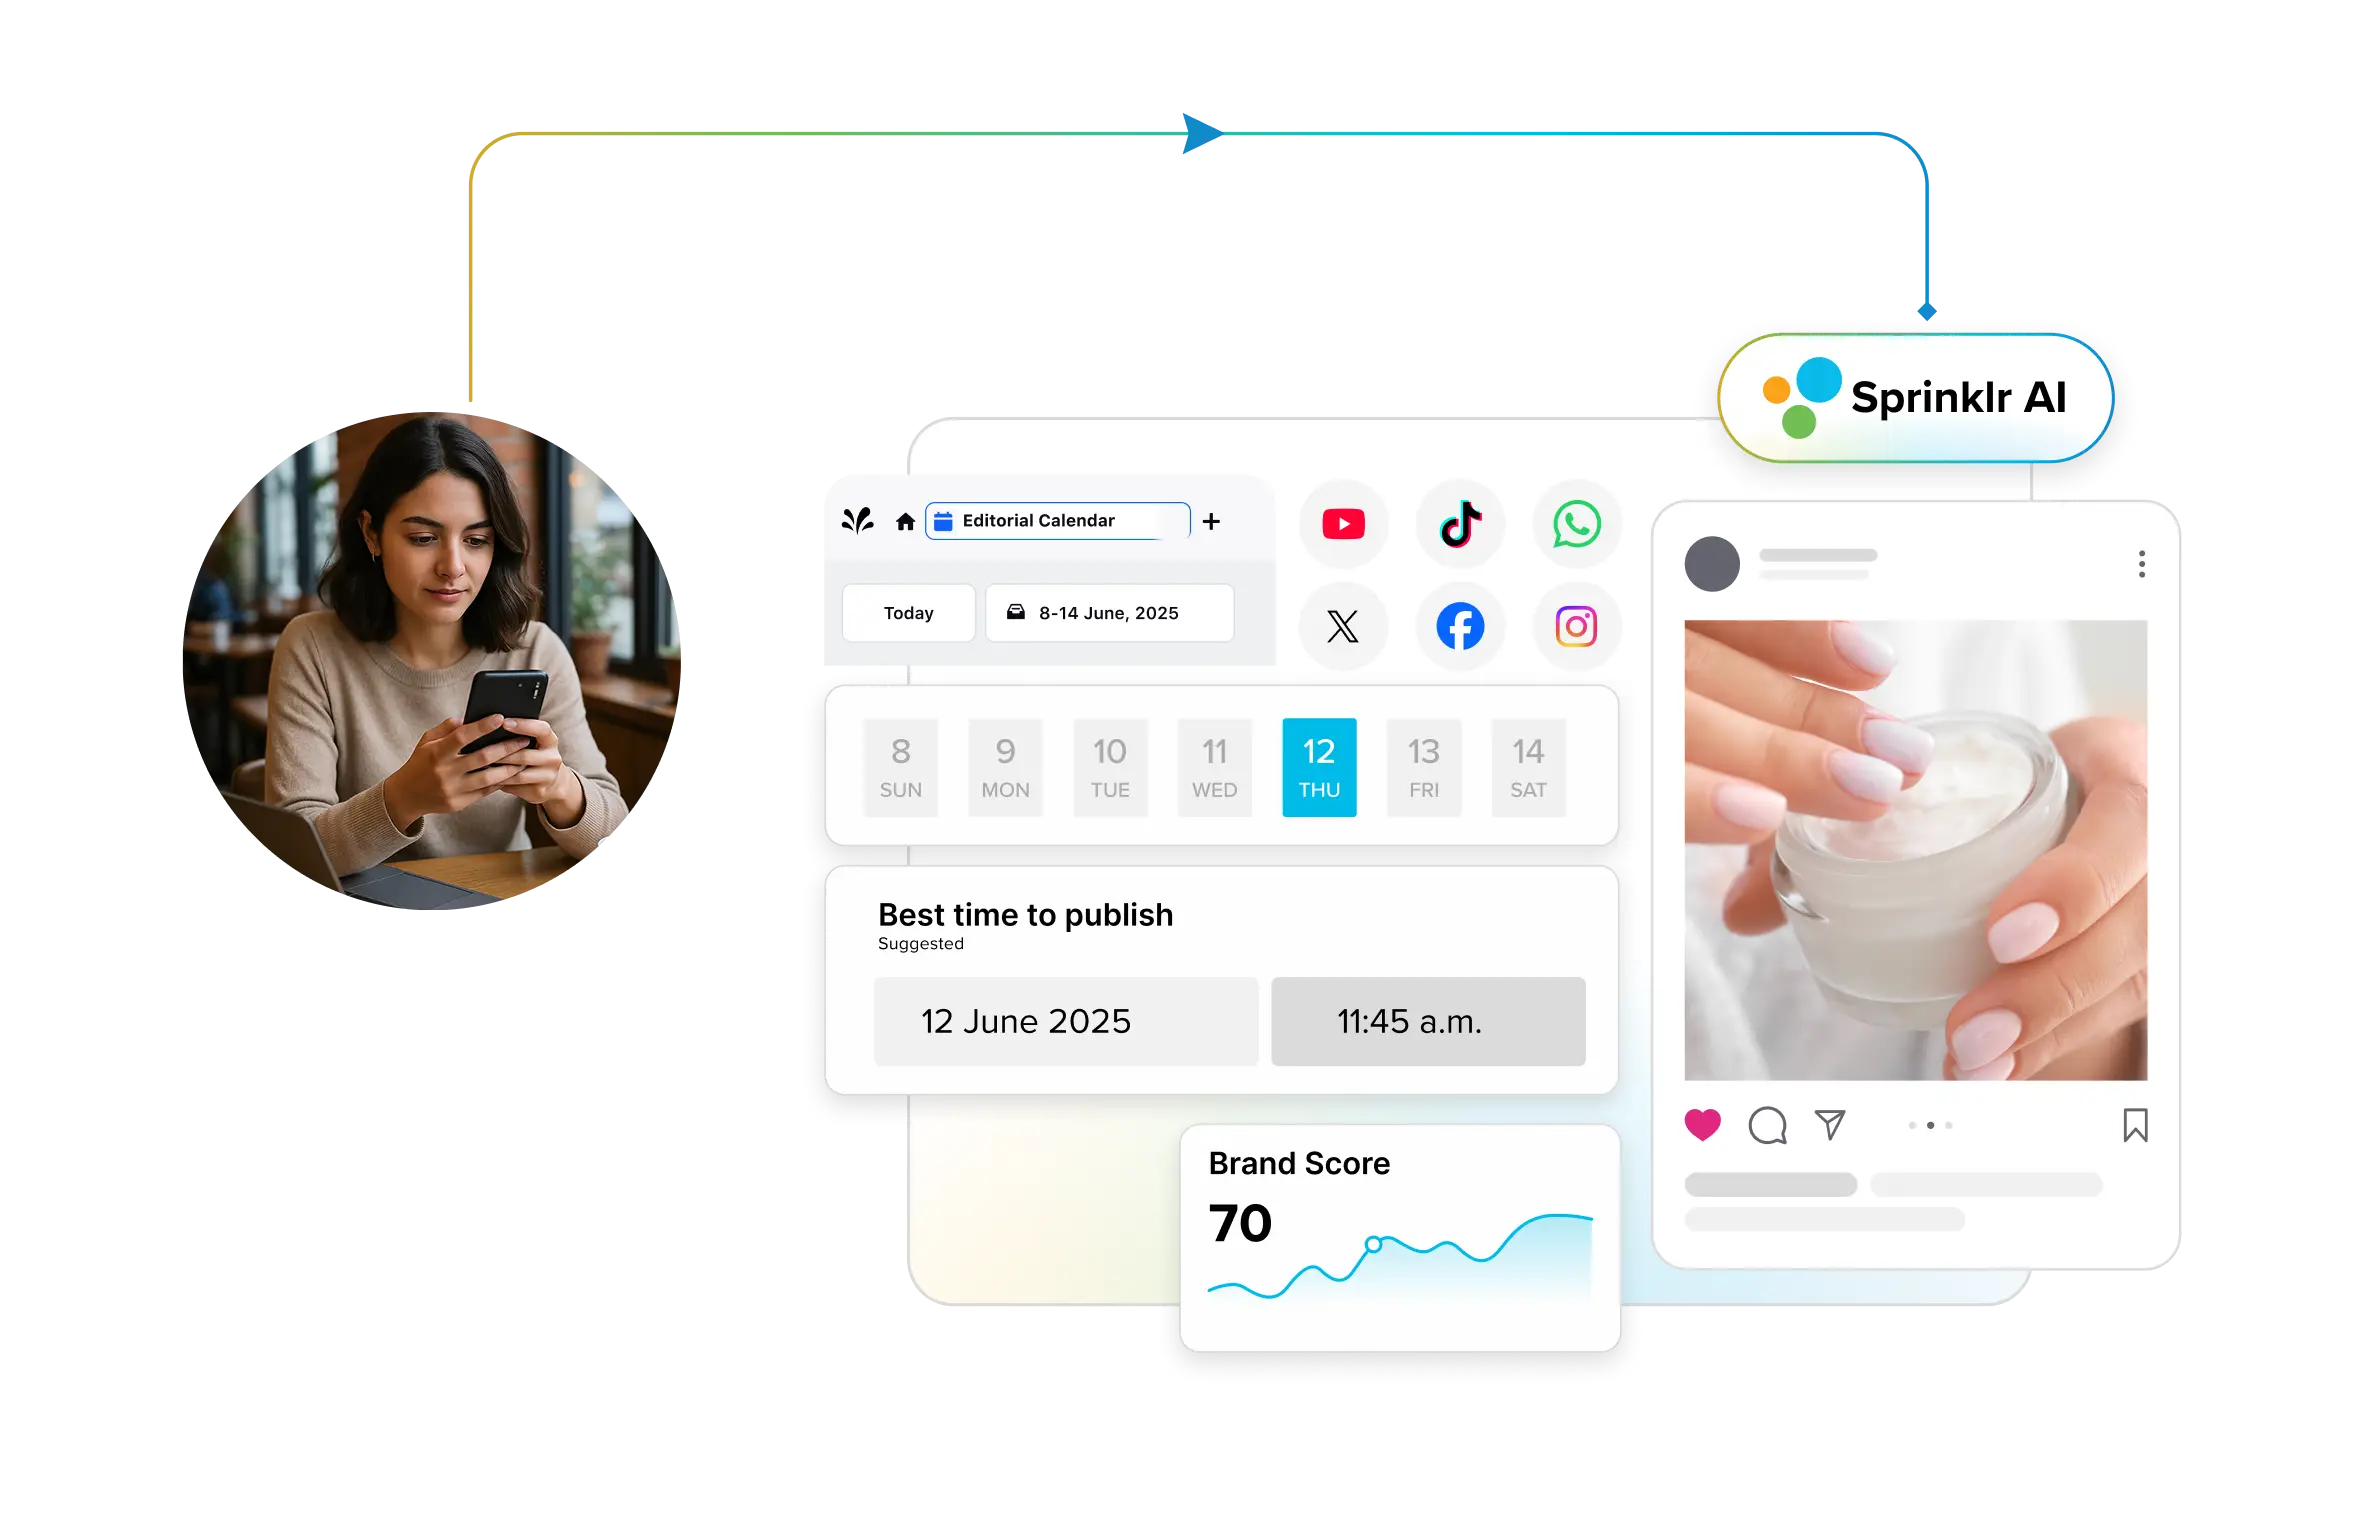
For over a decade, Sprinklr Social has helped the world’s biggest brands reimagine social media as a growth driver with a unified platform, industry-leading AI and enterprise-grade scale.


Social Media KPIs That Prove ROI


Social media growth has always been subjective in the enterprise. What a CMO calls momentum, a CEO may call noise. That is why social media KPIs exist. They are designed to transform social performance into a consistent language that the business trusts. But in 2026, many commonly reported KPIs no longer stand up to scrutiny.
At enterprise scale, follower growth without downstream behavior creates false confidence. Engagement that does not compound into consideration or action disappears quickly, both in algorithms and in budget conversations.
This blog helps you explore social media KPIs for modern enterprises. It focuses on which KPIs matter, how to prioritize them by maturity and how to operate them across regions without metric sprawl, so social performance becomes a system leaders can fund, scale or correct with confidence.
- What are social media KPIs?
- The 11 social media KPIs that matter in 2026 and beyond
- Revenue and unit economics
- Conversion performance
- Demand and discovery strength
- Customer experience and brand risk
- Operating discipline and governance
- Tracking social media KPIs takes time. Automating them is the real unlock.
What are social media KPIs?
Social media KPIs are measurable indicators that show how social media contributes to specific business outcomes such as awareness, demand, revenue, customer experience, and risk management.
They help leaders evaluate whether social investments are working and what needs to change. They are decision controls that tell leadership what social is doing for awareness, demand, revenue, customer experience and risk, with enough clarity to fund it, fix it or shut it down.
A clear enterprise example comes from Gap.
Gap positioned its “Better in Denim” campaign as a driver of traffic and double-digit denim growth in earnings commentary, reframing social performance as commercial lift rather than reach.
To keep KPI conversations clean at scale, most programs still organize metrics into three categories. The categories remain stable. What changes in 2026 is how strictly each category is allowed to prove value.
Awareness KPIs
- These indicate whether your brand is becoming more noticeable and easier to recall
- What leaders get wrong: Treating awareness as success instead of a leading indicator that must connect to downstream lift
Engagement KPIs
- These signal whether attention reflects intent, trust or repeated interest
- What leaders get wrong: Rewarding high-volume engagement that does not move buyers or stakeholders closer to action
Conversion KPIs
- These show whether social creates business action or protects revenue through service and retention
- What leaders get wrong: Relying on last-click attribution and concluding that social does not convert in complex journeys
From here, we focus on the KPIs that matter within and across these categories and how executives should prioritize them by maturity and region.
The 11 social media KPIs that matter in 2026 and beyond
We’ve grouped these KPIs into five categories because enterprises no longer run social media as a single function. Some KPIs prove revenue. Some protect customer retention. Some maintain teams' consistency and compliance across regions. This structure prevents metric chaos. It also clarifies what to prioritize as maturity increases.
Revenue and unit economics
These KPIs answer the only question leadership actually cares about: Is social creating profitable growth or just an activity?
KPI 1: Revenue and pipeline influence
Use this to measure how often social contributes to pipeline creation and closed revenue.
In many enterprises, LinkedIn content may rarely be the last click before a form fill, but it consistently shows up as a meaningful touch for target accounts that later convert through events, partner referrals or outbound.
Pipeline influence makes that contribution visible and defensible.
How to calculate it?
Social-sourced pipeline = Σ (opportunity value where first touch source is social)
Social-influenced pipeline = Σ (opportunity value where social is a tracked touch before close)
Social acceleration = (Avg. sales cycle days without social) − (avg. sales cycle days with social)
Tips to make the most of this KPI
- Define “meaningful social touch” upfront and exclude passive impressions. Use only intent signals like repeat engagement, ICP comments, high-intent clicks or registrations.
- Report by segment, at minimum, enterprise vs. mid-market or the blended number will mislead budget decisions
- Track the influenced pipeline from known touches before you claim full multi-touch attribution
KPI 2: Customer acquisition cost (CAC) and payback for social
This KPI reveals the actual cost of acquiring a customer through social media and how long it takes to recoup that cost.
Many teams celebrate low cost per lead (CPL) from paid social until finance loads in content production, tools, agency and community labor and discovers the program is unprofitable. CAC and payback eliminate that disconnect.
How to calculate it?
True social CAC = (Paid spend + content costs + tools + agency + community and care labor) ÷ customers acquired via social
Payback period (months) = CAC ÷ avg. monthly gross profit per customer
Tips to make the most of this KPI
- Lock the cost model with finance and revenue operations once per quarter, then maintain consistency to ensure CAC trends are accurate
- Split CAC by motion to avoid cutting the wrong spend. Always-on demand, ABM support, partner motion and expansion.
- If engagement is up but CAC is worsening, shift focus to conversion efficiency
KPI 3: CAC to LTV by channel and segment
The customer acquisition cost (CAC) to customer lifetime value ratio indicates whether social media is acquiring valuable customers.
A channel can appear expensive in terms of CAC while quietly producing higher-retention customers who expand more, ultimately making it the most profitable channel over time.
CAC to LTV makes that visible and rationalizes reallocation decisions.
How to calculate it?
CAC: LTV ratio = CAC (by channel or segment) ÷ LTV
LTV = (Avg. gross margin per customer per period) × (avg. retention periods)
Tips to make the most of this KPI
- Segment aggressively by market, tier, and motion
- Use trends over 3–4 quarters, not single-quarter snapshots that are too noisy for budget decisions
- Report ranges if LTV modeling is still maturing
Pro tip💡: You cannot afford fragmented paid reporting by channel and region if you are tracking CAC, payback, and pipeline influence. An AI-powered social advertising platform enables teams to manage paid campaigns across multiple social channels with enterprise-level governance and automated workflows and view cross-channel reporting in one place.
That makes it easier to tie spend and outcomes back to conversion efficiency and unit economics and to spot which campaigns are driving significant business action instead of cheap volume.
Real time success story ⭐
A leading global entertainment company was spending heavily on Snapchat, but signups and purchases were underperforming.
It utilized Sprinklr Marketing’s social advertising capabilities, specifically Ads Composer, to A/B test two Snapchat optimization windows and Ads Reporting with a custom near-real-time dashboard to monitor results and make adjustments quickly.
In four weeks, the better-performing setup reduced cost per signup by 29% and cut cost per purchase by 19%, directly improving conversion efficiency and unit economics.
Conversion performance
These KPIs distinguish between activity and business action. They tell you whether social is creating measurable outcomes, even when the customer journey includes private sharing and multi-step conversion paths.
KPI 4: Conversion efficiency index (CEI)
CEI measures how efficiently social turns attention into outcomes. Many enterprise teams achieve a strong click-through rate (CTR), but the pipeline remains flat because the landing experience, offer or qualification is flawed. Conversion efficiency reveals where the drop-off occurs, so you can adjust the right lever.
How to calculate it?
Conversion efficiency index (CEI) = (Click-through rate × landing conversion rate) ÷ cost per conversion
Where:
CTR = Clicks ÷ impressions
Landing conversion rate = Conversions ÷ landing visits
Cost per conversion = Spend ÷ conversions
Tips to make the most of this KPI
- Report CEI by campaign objective and segment, rather than as a single blended number. Awareness campaigns will always distort it.
- Diagnose with one rule. If the CTR is high and the CEI is low, adjust the landing offer and qualification. If CTR is low and CEI is low, fix the message and targeting.
- Set thresholds by region and product line so teams do not chase the wrong benchmarks
Related read: Social media conversion: A guide for beginners to experts
KPI 5: Dark social contribution
How often do you think private sharing drives conversions that your dashboards never credit?
In enterprise buying, a post is often forwarded in DMs, Slack, or email, and then the buyer converts later through search, direct outreach, or a sales conversation.
Dark social contribution makes that hidden distribution visible enough to act on.
How to calculate it?
Dark social contribution rate = (Conversions from tagged "share" links + conversions from private-share landing variants + conversions self-attributed to private sharing) ÷ total social-attributed conversions
Directional add-ons:
Private share assist rate = Conversions where a private-share link was clicked at any point ÷ total conversions
Tips to make the most of this KPI
- Stop chasing perfect attribution. Use three signals together: trackable share links, dedicated landing variants and a simple “How did you hear about us” field.
- Create share-ready assets designed for 1:1 forwarding, then track those assets separately
- Use dark social patterns to inform what sales and customer service management (CSM) teams should share in 1:1 outreach
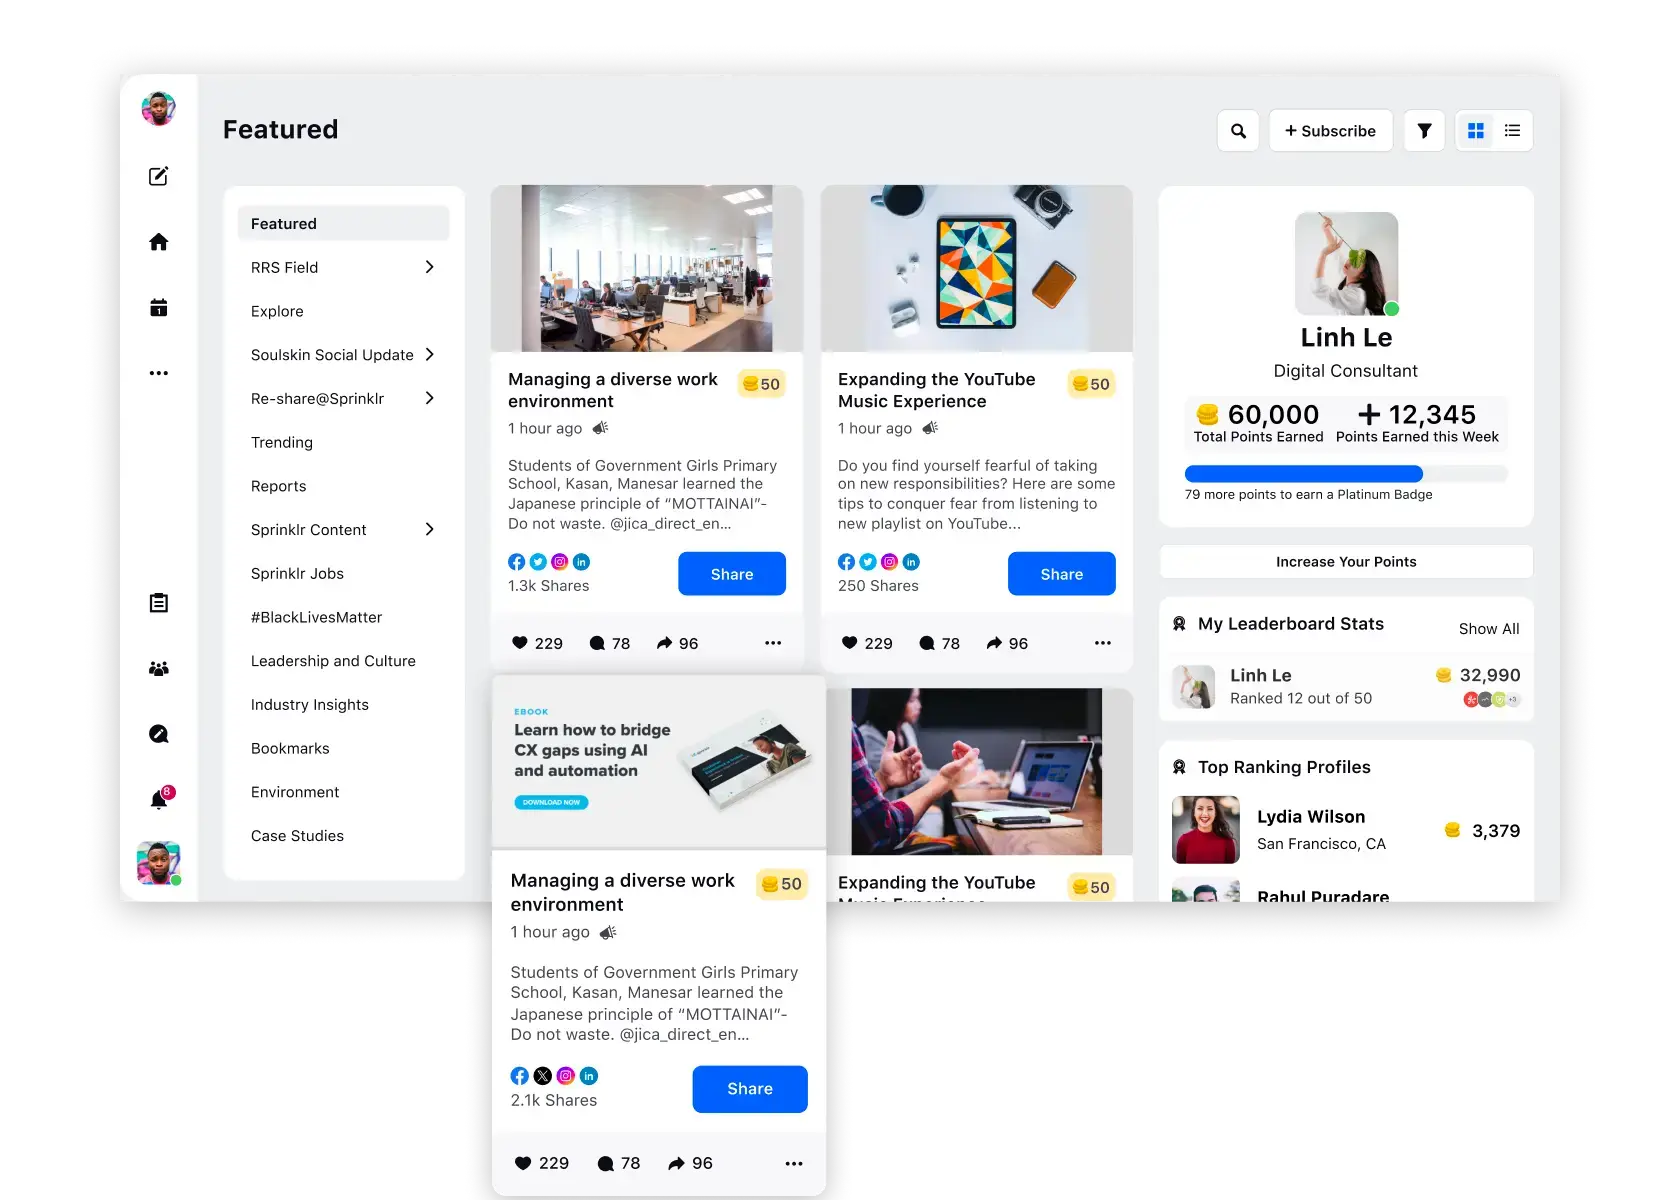
Pro tip💡: Since dark social is where influence happens, employee sharing is the one “private distribution” channel you can govern and measure without guessing.
A modern employee advocacy platform enables you to curate a library of approved content, provide employees with ready-to-post captions and maintain compliance through governance controls.
You also get participation and engagement reporting, so you can see which employee-shared posts are driving measurable traffic and conversions tied to your conversion efficiency work.
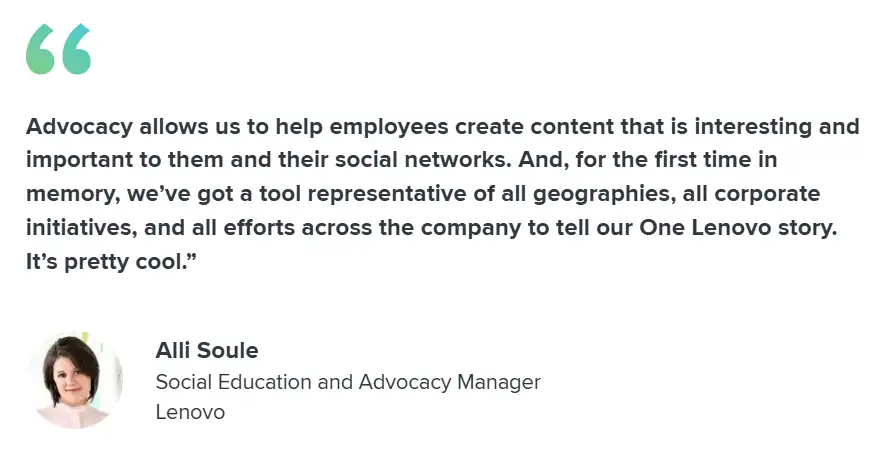
Real time success story: Lenovo
Global enterprise Lenovo wanted employee sharing to scale without losing control or visibility into what was working.
Using Sprinklr Advocacy, it grew its advocates to over 2,000 users on the platform and, in six months, drove a 360% increase in social reach, a 200% increase in total engagements and approximately 8,000 total shares.
Demand and discovery strength
These KPIs indicate whether you are capturing attention that sticks and if buyers can actually find you when they begin researching on social media.
KPI 6: Platform search visibility
Platform search visibility measures how often your brand appears when people search on platforms, large language models and whether they take the next step to visit your profile or engage with your content.
A buyer who searches “best practices” in your category on LinkedIn or YouTube may never see your paid campaign. They will see whoever owns the search results.
How to calculate it?
Platform search visibility rate = (Impressions from platform search placements) ÷ (total impressions)
Search-driven action rate = (Profile visits + follows + clicks that originated from search) ÷ (impressions from platform search placements)
Tips to make the most of this KPI
- Define a priority query list for each region and review it monthly. One global list will fail.
- Build repeatable series that answer those queries, then track ranking and search-driven actions
- Conduct a weekly search audit for the top queries that impact the pipeline.
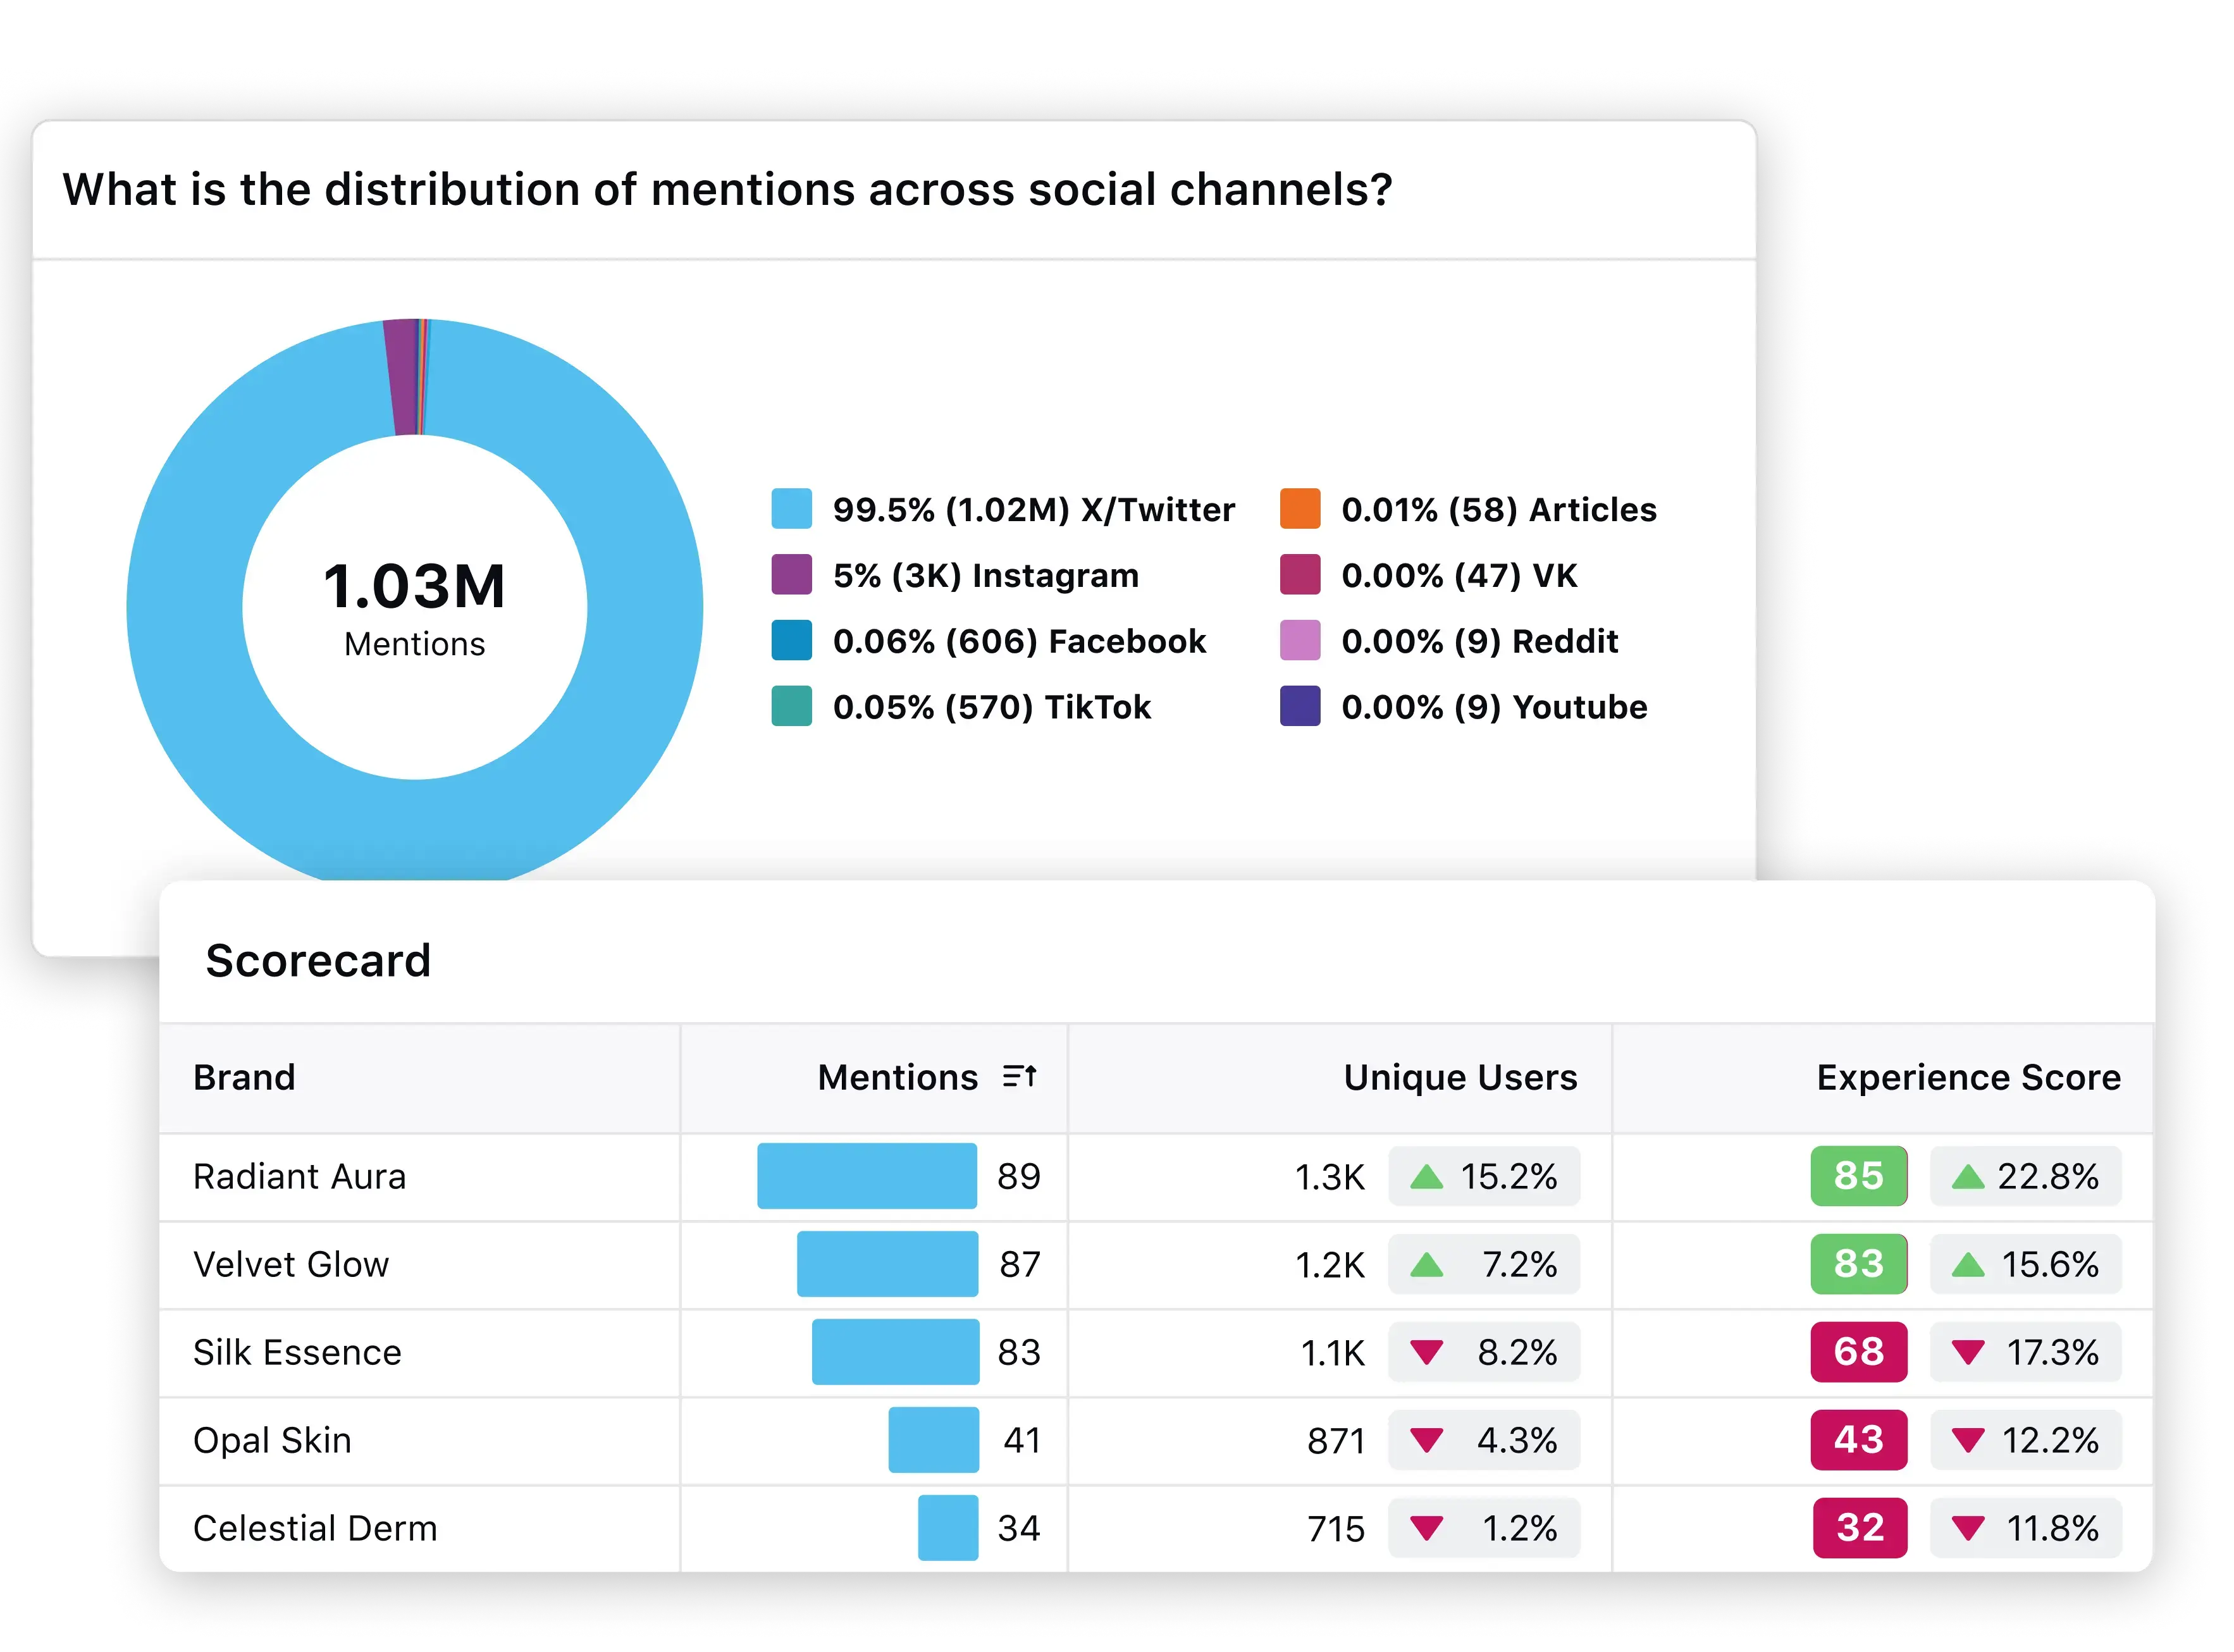
KPI 7: Share of voice for demand capture
Share of voice tracks how visible you are versus competitors on the topics that shape buying decisions, not just brand mentions. In many categories, the brand that wins early topic visibility tends to end up on more shortlists, even when conversions occur later through sales.
How to calculate it?
Share of voice (topic-based) = Your brand mentions for priority topics ÷ (your brand mentions + competitor mentions for priority topics)
Share of voice delta = Your SOV this period − your SOV last period
Tips to make the most of this KPI
- Measure SOV only on priority topics tied to the pipeline, not broad category noise
- Track SOV shifts around launches, incidents, and industry moments, then link to downstream lift
- Use SOV gaps to decide where to publish more and where to stop spending
Pro tip💡: Use an AI-powered competitive benchmarking tool to track your performance versus competitors across multiple social channels from one dashboard.
It supports benchmarking on KPIs like engagement, reach and follower growth and it can monitor competitor activity across many profiles with AI-driven aggregation and alerts.
That makes it easier to spot where you are losing discovery and where your content is earning durable attention.
Customer experience and brand risk
This set of KPIs treats social as a real operating surface. They demonstrate whether you are protecting renewals, reducing service costs, and catching risks early, not just posting content.
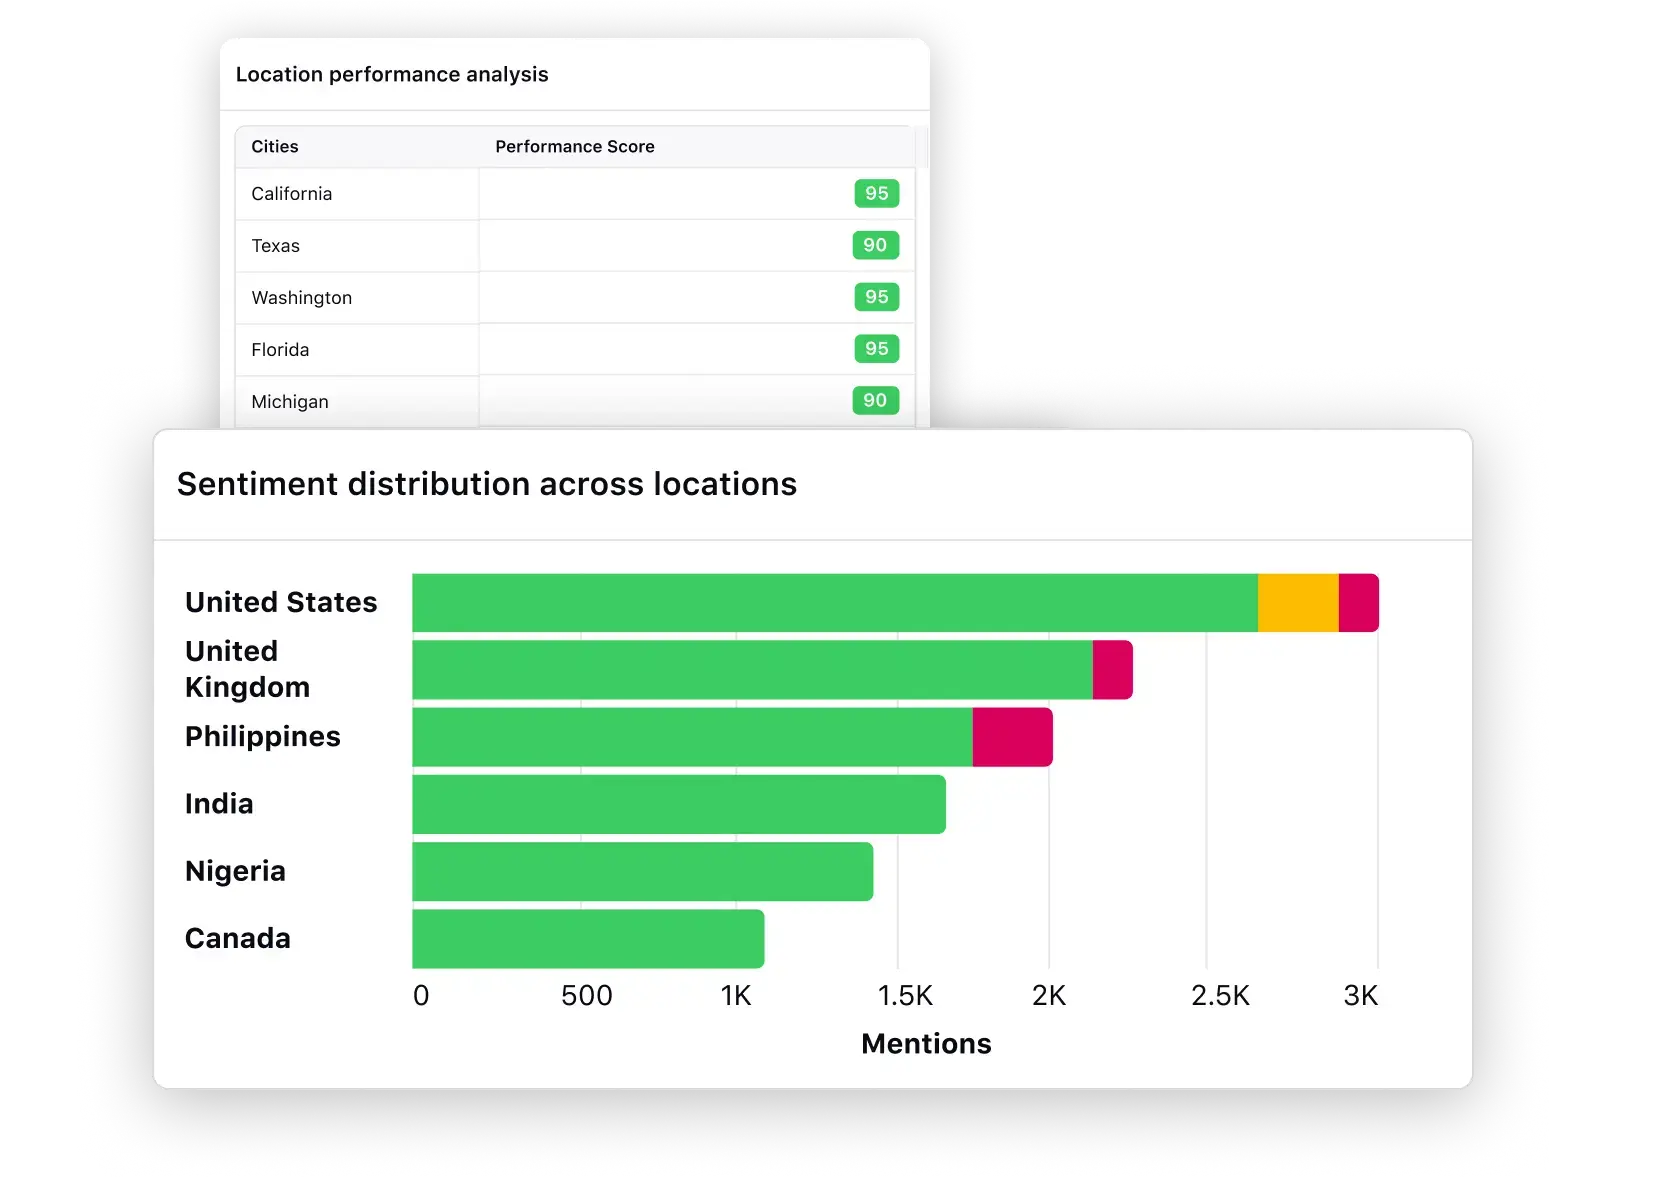
KPI 8: Sentiment linked to churn, renewals, and risk
Customer sentiment is only useful when it predicts business outcomes. A global brand often sees sentiment dip first on social when a product update breaks something, a shipping issue spikes or a policy change lands badly.
If that dip clusters around strategic accounts or renewal windows, it becomes a revenue risk signal.
How to calculate it?
Sentiment-to-outcome correlation (quarterly) = Correlation coefficient between (net sentiment score trend) and (churn rate or renewal rate trend)
Net sentiment score = (Positive mentions − negative mentions) ÷ total mentions
Sentiment risk rate (accounts) = # of priority accounts with negative sentiment spike ÷ total priority accounts monitored
Tips to make the most of this KPI
- Track sentiment by topic and customer cohort, rather than a single blended brand score
- Set alert thresholds for sudden changes, then route them to the team that can identify and resolve the root cause. Product, support, communications.
- Tie reporting to renewal windows and churn cohorts so the metric stays financial, not emotional
Also read: Customer Sentiment Analysis: How to Get Insights (+ Tools)
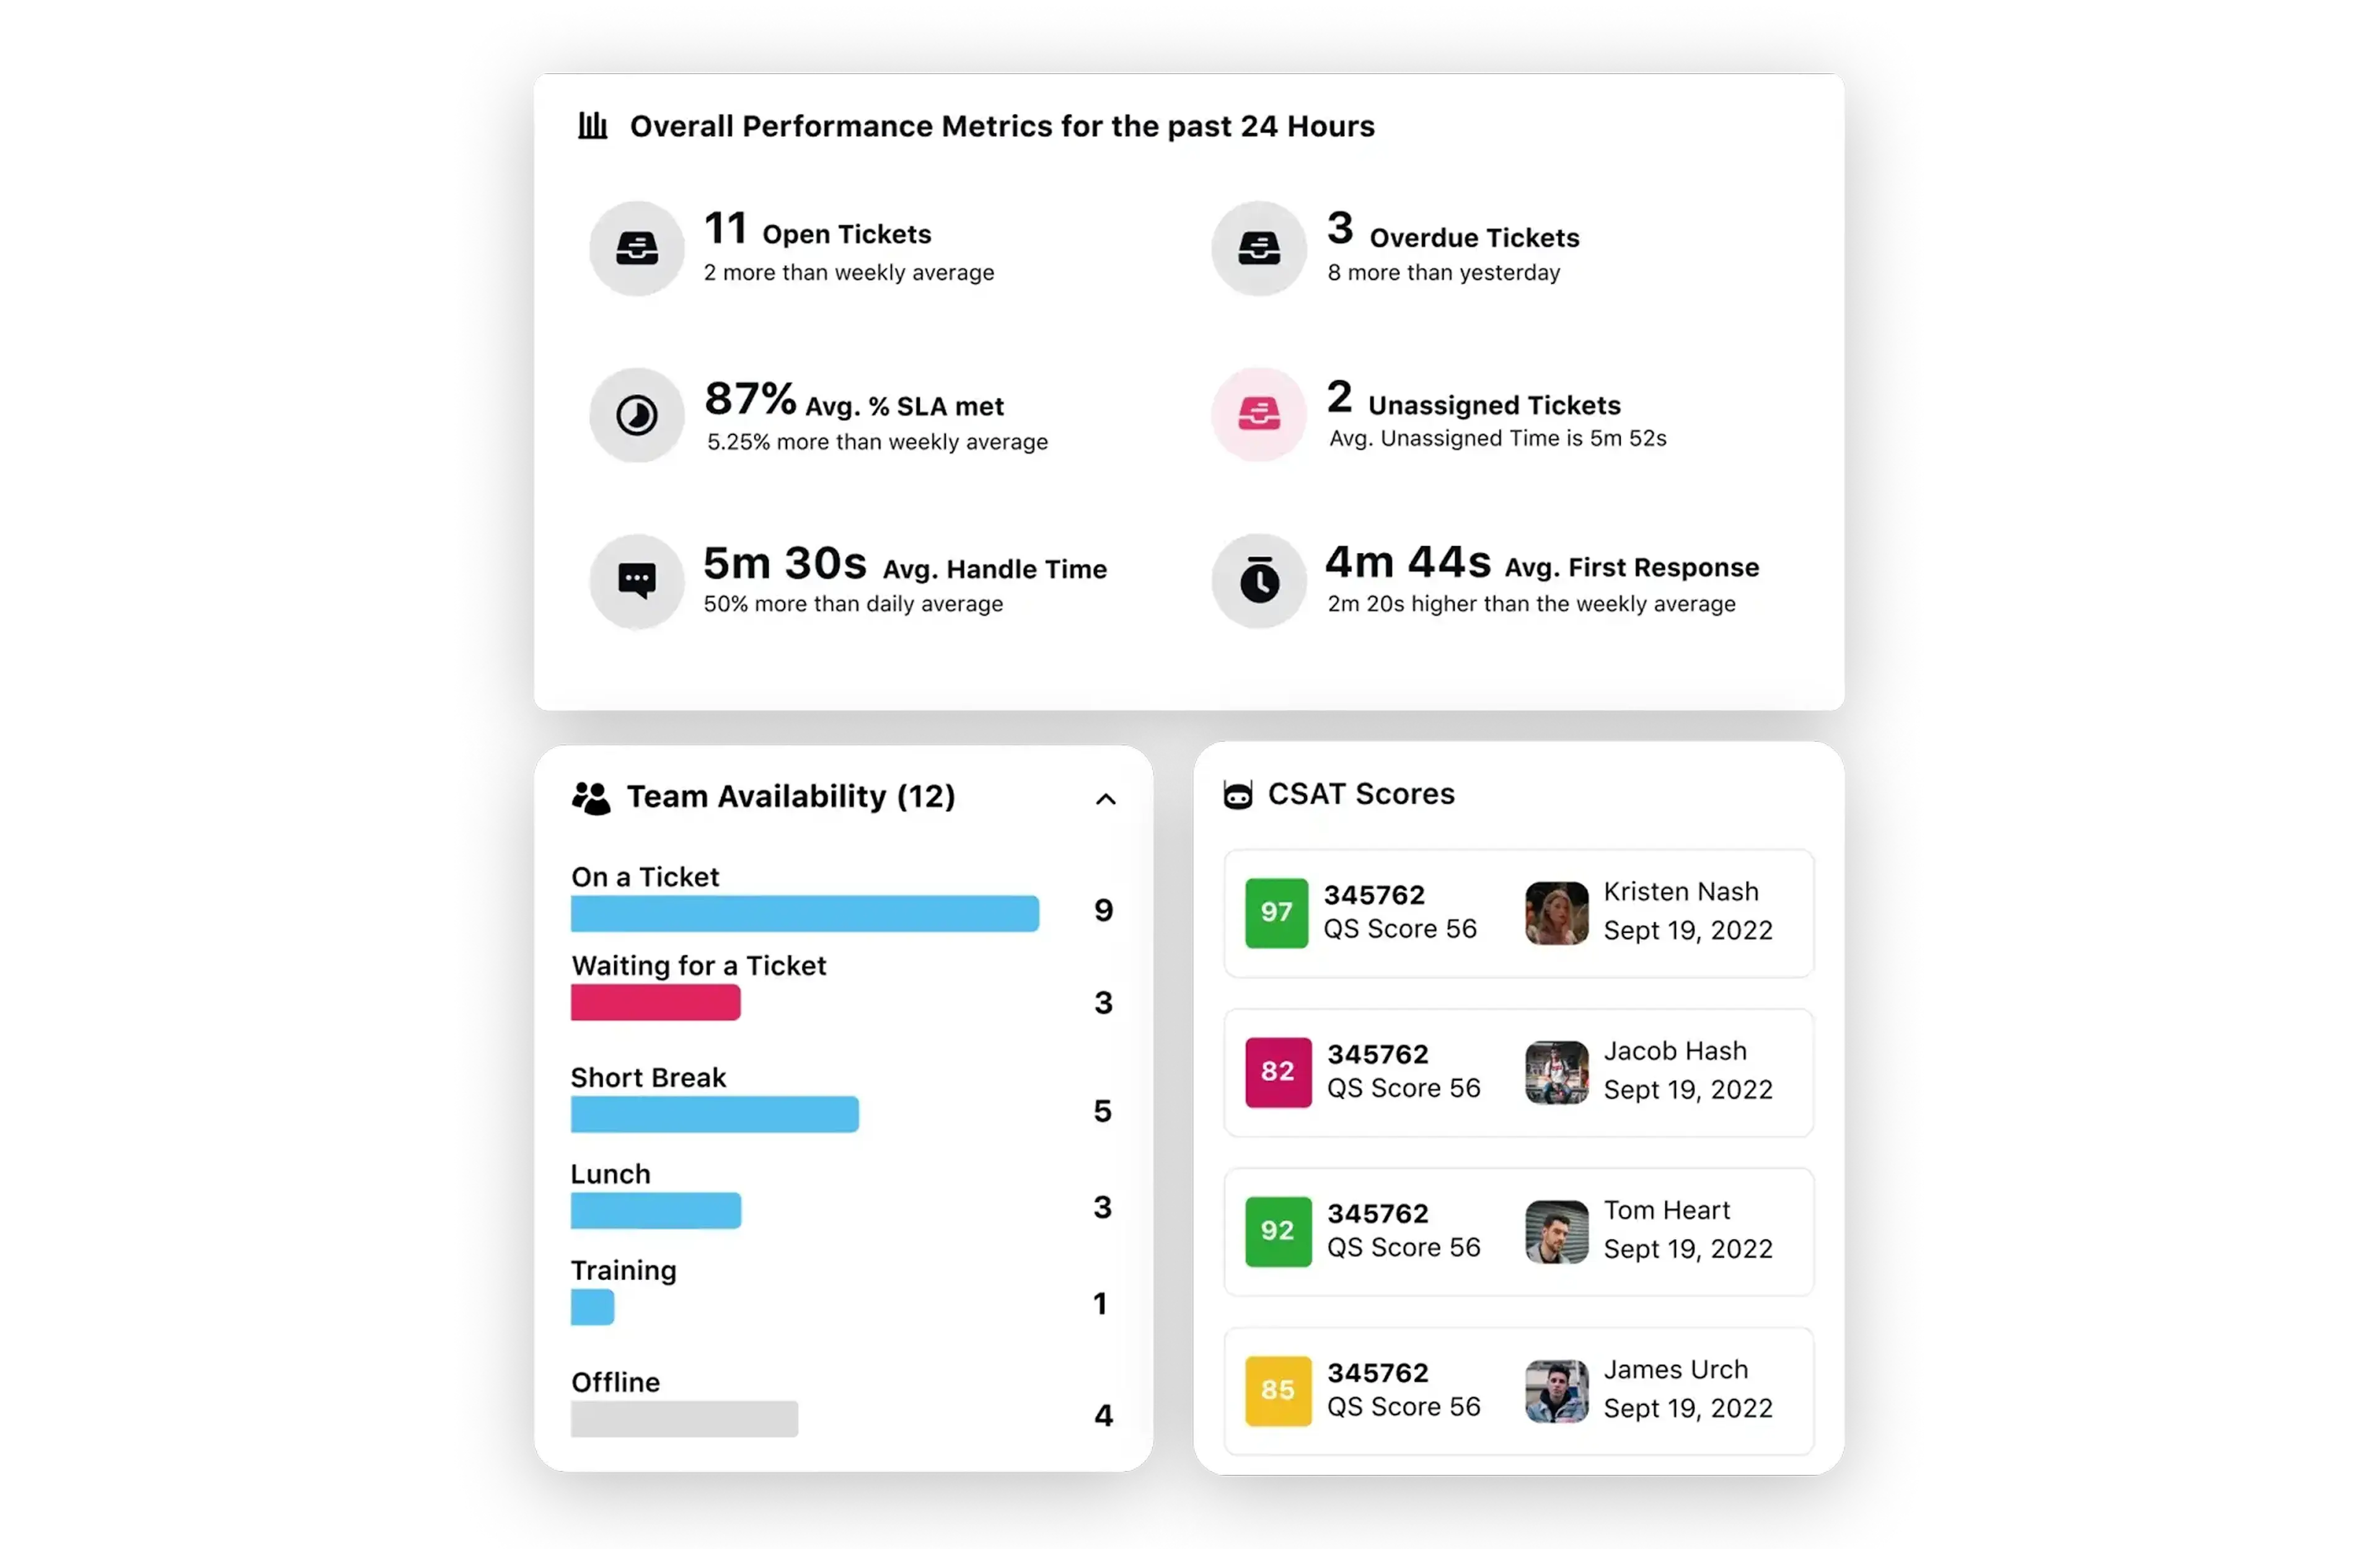
KPI 9: Response quality and resolution rate for social care
In many enterprises, response time appears good on a dashboard, while the same customer has to repeat their context across channels, gets escalated unnecessarily or quietly churns after a bad public thread. Resolution quality catches that gap.
How to calculate it?
First response time (FRT) = Avg. time from first customer message to first agent response
Resolution rate (within SLA window) = # of cases resolved within SLA ÷ total cases
Escalation rate = # of cases escalated to tier 2 or ticketing ÷ total cases
Cost per resolution = Total social care operating cost ÷ # of cases resolved
Tips to make the most of this KPI
- Measure resolution within a defined SLA window, plus escalation rate
- Standardize case categories and resolution reasons across regions to ensure accurate quality comparisons
- Use a weekly QA sample review. Identify top failure patterns, then coach on those patterns.
You may like: 4 Use Cases that Prove AI’s Value Creation in Customer Service
KPI 10: Community health index
Enterprise buyers are increasingly validating vendors through peer discussions. A community that answers questions, shares workarounds and challenges misinformation reduces support load and strengthens retention.
How to calculate it?
Active community rate = Weekly active participants ÷ total community members
Conversation depth = Avg. replies per thread where replies exceed 3 levels
Member-to-member ratio = # of member replies to other members ÷ total replies
Advocacy rate = # of unsolicited positive recommendations ÷ total active participants
Tips to make the most of this KPI
- Track member-to-member help rate—the clearest signal the community has real value
- Build programs that reward peer contribution, not brand praise
- Map community participation to renewal and expansion cohorts where possible, even if the connection initially appears directional
Pro tip💡: A new-generation generative AI-powered social media customer service software can help you run these KPIs as successful operations.
It provides a unified view of customer messages across 25-plus social channels, along with tools to identify, prioritize and resolve issues more efficiently with the help of GenAI.
This makes it easier to track resolution rates, escalations, and response performance consistently across regions and teams.
Operating discipline and governance
This KPI determines whether your social program scales without compliance risk, brand inconsistency and wasted production effort across regions.
KPI 11: Content quality and governance score
Content quality and its governance score show how reliably your organization publishes accurate, compliant, on-brand content at scale.
In a distributed enterprise, two regions can publish the “same” message and still create completely different outcomes. One follows claims guidance, accessibility basics, and approval workflows. The other posts fast, makes a product claim that needs rework and creates avoidable risk. A quality and governance score makes that difference measurable.
How to calculate it?
Content quality and governance score (0–100) = (accuracy score × w1) + (brand compliance score × w2) + (accessibility score × w3) + (approval hygiene score × w4) + (post-publication rework score × w5)
Where each sub-score ranges from 0 to 100, weights (w1–w5) should sum to 1.0 and stay consistent across regions.
Tips to make the most of this KPI
- Use a single global scorecard with local exceptions, rather than separate scorecards for each team
- Make the score operational. Auto-flag posts that miss critical checks, then block publish until fixed.
- Track rework and takedowns as a visible cost. It is the fastest way to make governance funding non-negotiable.
Pro Tip💡: Consider investing in a distributed marketing platform for remote or distributed teams. These are typically designed to address the specific issue that this KPI reveals.
Central teams can set governance, approvals, and brand guardrails, while local teams execute with speed and relevance.
That helps you scale content across regions without losing control and it provides a consistent workflow and performance visibility, ensuring that quality and compliance are measured uniformly everywhere.
Tracking social media KPIs takes time. Automating them is the real unlock.
The KPI system outlined here works, but it’s not set-and-forget. Even with AI-assisted workflows, enterprises still need active oversight to monitor performance, reconcile definitions across regions, validate what drives outcomes and turn weekly signals into decisions leadership can act on. That’s where many programs stall. Teams continue publishing and reporting, but lack the bandwidth to run KPI management as a continuous loop that improves quarter over quarter.
This is why Sprinklr introduced AI Agents. Trained on your workflows, approval rules, and reporting standards, they monitor performance shifts, track priority KPIs and generate stakeholder-ready insights automatically. The result is faster decisions, less manual effort and KPI management that scales with the enterprise. Book a free demo and let a Sprinklr specialist show you what the process will look like for your business.
Frequently Asked Questions
Prioritize KPIs that tie social activity to business outcomes. Start with revenue and pipeline influence, CAC, payback and CAC-to-LTV ratios by channel and segment. Then add conversion efficiency to see where the funnel breaks. Use discovery and CX KPIs only if you can connect them to pipeline, retention, or cost reduction.
Use a simple model first, then mature it. ROI = (Revenue attributable to social minus total social cost) divided by total social cost. Total social cost should include paid spend plus content creation, tools, agency and community or care labor. If direct revenue attribution is limited, report influenced pipeline and payback period as the next best executive-ready proxies, then improve attribution over time.
B2B should weigh pipeline influence, deal velocity, and CAC to LTV because the journey is longer and social often influences rather than closes. B2C should weigh conversion efficiency, CAC, payback, and platform search visibility because demand capture is faster and volume swings are larger. Both need retention-weighted engagement. Both need sentiment and resolution KPIs if social is a major support channel.
Vanity metrics describe activity that appears impressive but does not influence a business decision. KPIs are tied to a goal, have a clear definition and change what you do next. Followers are a vanity metric if they do not correlate with discovery, conversion, or retention. Engagement is a vanity metric if it does not predict pipeline movement, lower CAC, or stronger customer outcomes.
Monitor operational KPIs weekly so teams can act. Report executive KPIs on a monthly and quarterly basis so that trends are clear and noise does not drive decisions. Use a fixed cadence by category: conversion performance weekly, discovery and share of voice weekly or biweekly, CX and risk daily to weekly depending on volume and unit economics, quarterly, with finance to keep inputs consistent.


