


Elevate CX with unified, enterprise-grade listening
Sprinklr Insights gives you real-time consumer, competitor and market intelligence from 30+ channels without the noise. Make smarter decisions, strengthen your brand, and stay relentlessly customer-led.


6 Ways to Measure Customer Satisfaction [+8 Top KPIs]


Someone discovers your product via a LinkedIn ad, visits your website, reads G2 reviews, signs up for a free trial, interacts with your chatbot for setup, and later reaches out to support via email.
The typical customer journey leading to your business has become more complicated and diversified.
For your customers, this zig-zag way to “aha moment” results in a multifaceted experience, which the customer satisfaction score (CSAT) of a single touchpoint alone cannot fully comprehend.
Each touchpoint shapes their perception of your business. Now, imagine prompting a CSAT survey only after a website visit.
You get only a part of the larger picture. And for customers, even if one of the touchpoints feels disjointed or inconsistent, the entire experience suffers.
Customers cannot see your limitations. And as we say at Sprinklr: One good experience anywhere sets the expectation everywhere!
So, how do you measure customer satisfaction that considers the larger picture in today’s complicated setups?
This guide breaks down how to approach CSAT the enterprise way — what to measure, where to start, and how to turn sentiment into a competitive advantage.
- What is customer satisfaction, and why is it more than a score
- Top 8 KPIs to measure customer satisfaction (+ formulas and examples)
- How to measure customer satisfaction in large organizations (+Best practices)
- Step 2: Identify key touchpoints and moments that matter
- Case studies: Why CSAT is important for enterprises
- Knowledge, tools, and strategy aren’t enough. You need customer intelligence
What is customer satisfaction, and why is it more than a score
Customer satisfaction (or CSAT score, since it’s measurable) is an indicator of how well your business meets or exceeds customers’ expectations across every interaction, from the first touchpoint to post-sale support.
Measuring CSAT typically involves asking questions to customers after a qualifying interaction: "How satisfied were you with your experience?" with a scale to score within one to five, one to 10, or using a percentage scale (higher score being very satisfied).
For enterprises, CSAT is more than just sharing a survey link after a phone or email conversation.
More touchpoints. More determinants of customer satisfaction
Today, multiple touchpoints impact customer experience — marketing, website, third-party reviews, product experience, and support.
You’ve got to account for these touchpoints for an accurate CSAT prediction and to make meaningful impacts.
A CSAT score of a single touchpoint cannot capture the multifaceted influences that shape your customer’s experience and satisfaction as they interact with your business.
Consider a customer finds your product via a YouTube video. They then sign up after reading G2 reviews, struggle with onboarding, contact support, and finally get value from help articles.
If you only survey them after the support call, even a 7/10 CSAT rating reflects that moment, not the full journey. It misses earlier friction and the trust built through marketing.
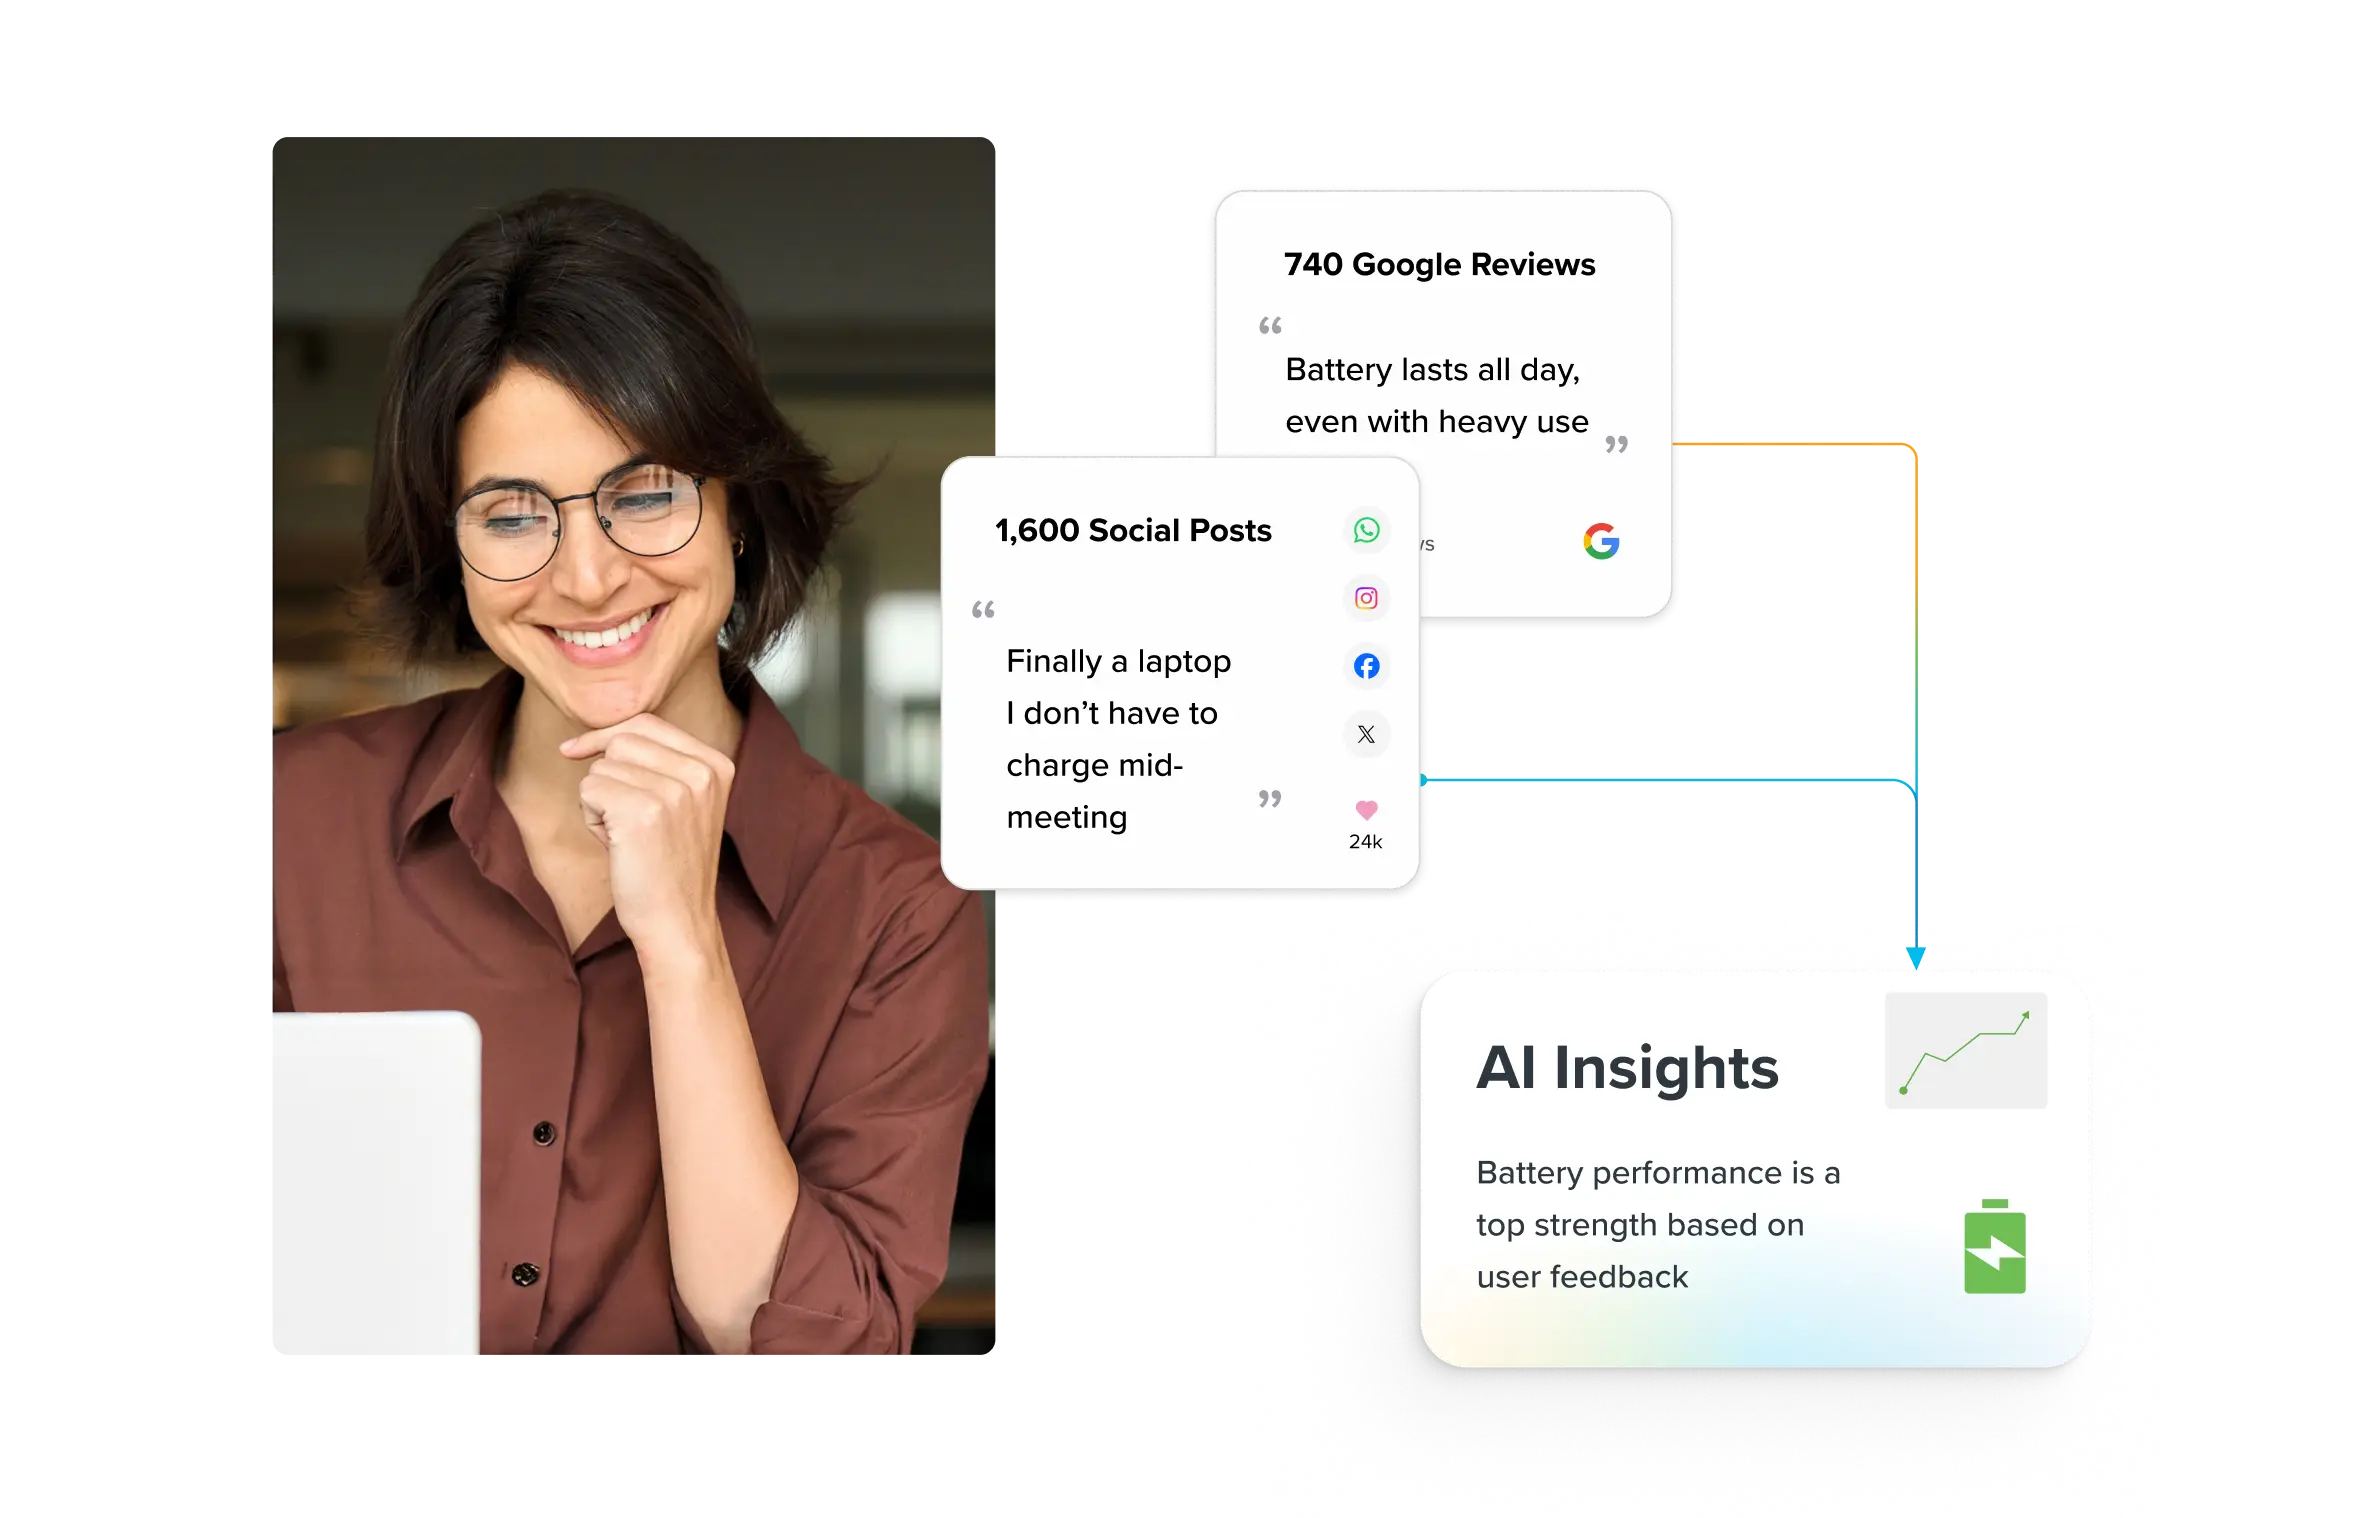
But imagine analyzing a customer conversation that reveals the larger picture, such as the sentiment and context behind it 👇
This is what large enterprises are now chasing — AI-powered software to measure and predict customer satisfaction beyond one-off surveys or scores, that tells the entire story.
The next generation of measuring customer satisfaction analyzes conversations for the score that you trust, plus intent, sentiment, emotions, intensity, and time of reply, for a richer snapshot of CSAT.
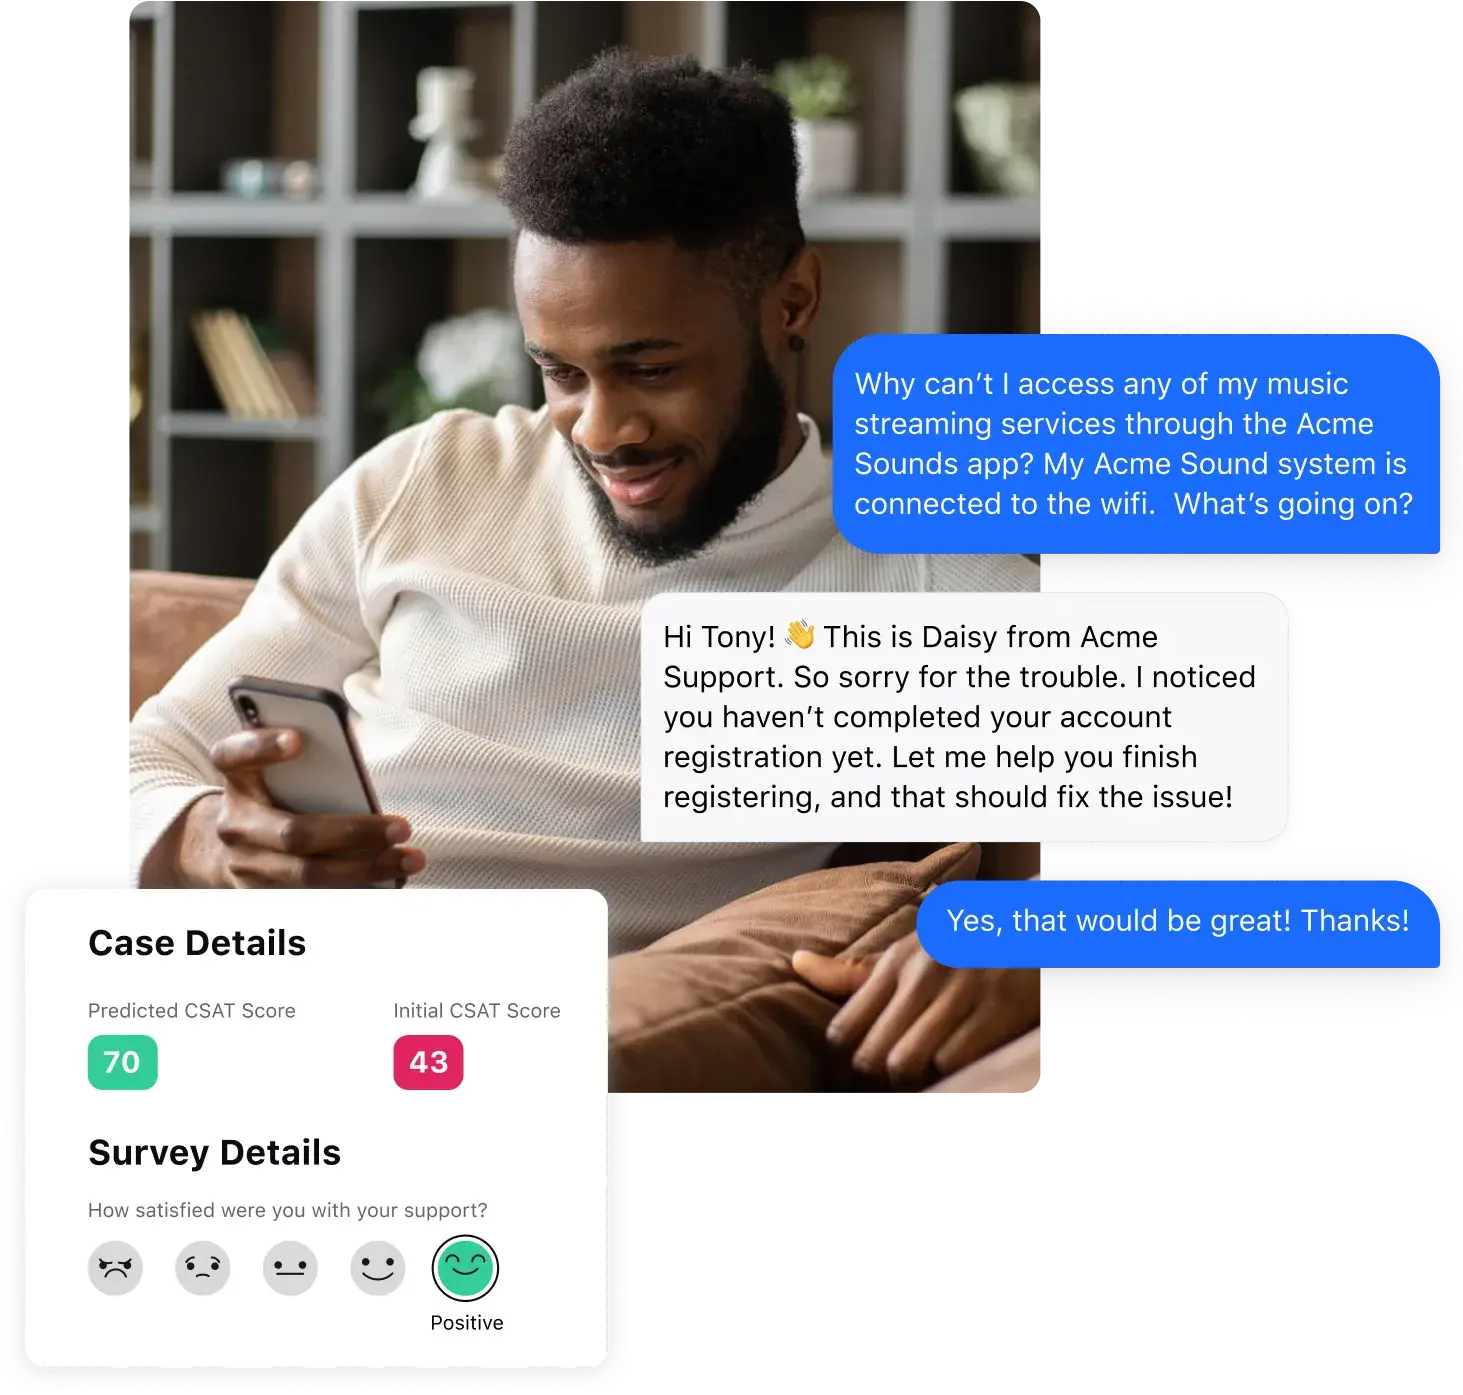
🔥Measure customer satisfaction beyond a score with AI-powered CSAT Prediction
Most customers don’t finish CSAT surveys. Those who do, do it out of frustration. The results in skewed numbers or inaccurate data.
Sprinklr’s CSAT Prediction engine — a survey software powered by the world’s most advanced AI — conducts surveys and analyzes conversations for cognitive, psychological, and emotional indicators for a richer CSAT overview beyond scores.
One AI-driven CSAT software to improve CX across the board:
✅ Build surveys once and deploy across touchpoints. AI will adapt questions
✅ Trigger surveys automatically with routing logic for internal workflows
✅ Get AI-triggered alerts when trends change — for better or worse
✅ Attach survey reports to agents for accountability, tracking, and training
Top 8 KPIs to measure customer satisfaction (+ formulas and examples)
You cannot definitively measure customer satisfaction from one single survey or a score between one to 10 alone.
The logic is simple: satisfaction is dependent on several factors, such as emotions, effort, loyalty, and behavior, all of which are a result of complex customer journeys. The way customer A will get the “aha moment” won’t be the same as customer B.
This is why you must rely on a combination of KPIs to measure CSAT [like this Reddit user is suggesting 👇], each capturing the unique feedback of a particular journey and experience with your brand.
These KPIs help you track customer sentiment and show you where to act, what to fix, and how to grow:
KPI | What it measures | Formula | Example |
Customer satisfaction score (CSAT) | Customer satisfaction with a specific interaction (e.g., support call, delivery, onboarding) | (Number of satisfied responses ÷ Total responses) × 100 | 425 out of 500 customers rated four or five on a five-point scale → CSAT = (425 ÷ 500) × 100 = 85% |
Net promoter score (NPS) | Willingness to recommend your brand that reflects loyalty and long-term satisfaction | Percentage of promoters – Percentage of detractors (based on 0–10 rating scale) | 60% promoters, 10% detractors → NPS = 60 – 10 = 50 |
Customer effort score (CES) | How easy it was for your customers to get their issue resolved or goal completed | Average score of responses to the statement “It was easy to handle my issue” (1–7 scale) | 300 responses averaging 5.6 → CES = 5.6 |
The projected revenue your business earns from a customer over the entire relationship | CLV = (Average purchase value × Purchase frequency) × Average customer lifespan | $200 × 4 times/year × 5 years → CLV = $4,000 | |
The percentage of customers who stop doing business with you over a specific period | (Customers lost during period ÷ Total customers at start of period) × 100 | Lost 150 out of 2,000 customers last quarter → Churn Rate = (150 ÷ 2000) × 100 = 7.5% | |
Upsell/Expansion rate | Growth from existing customers through upsells, cross-sells, or upgrades | (Revenue from upsell/expansion ÷ Total revenue from existing customers) × 100 | $50K in upsells from $200K in customer revenue → Rate = (50K ÷ 200K) × 100 = 25% |
Sentiment score | Overall customer sentiment from unstructured feedback (social, chat, email) | AI-calculated score based on positive, neutral, and negative language patterns | After a new feature launch: 70% positive, 20% neutral, 10% negative → Sentiment Score = 70 |
First contact resolution (FCR) | Percentage of support cases you have resolved in the first interaction | (Issues resolved on first contact ÷ Total issues) × 100 | 800 out of 1,000 tickets resolved immediately → FCR = (800 ÷ 1000) × 100 = 80% |
How to measure customer satisfaction in large organizations (+Best practices)
Your organization must measure its maturity level before setting goals and choosing CSAT strategies to improve.
Here’s a quick way to self-assess where your brand lies on the customer satisfaction timeline:
CX maturity stage | What it looks like |
Ad hoc | Customer feedback is unstructured, mostly anecdotal, and varies across teams. For example, one region might collect informal comments via email while another uses a one-off survey with no follow-up. |
Reactive | Metrics exist, but they’re tracked in silos and rarely drive change. For instance, support teams may track CSAT after tickets, but insights don’t reach product or leadership for decision-making. |
Integrated | Metrics are embedded into workflows and reviewed regularly across teams. Think of a company that shares monthly CS dashboards with CX, product, and marketing, and adjusts onboarding flows based on feedback. |
Predictive | Insights are used to anticipate issues and optimize CX proactively. For example, AI flags a drop in satisfaction before renewals, triggering proactive outreach from account managers. |
Once you’ve identified what stage you’ve reached, follow these steps to measure customer satisfaction.
Step 1: Align on what satisfaction means
Before you measure anything, set your target priorities. Otherwise, you'll end up tracking disconnected numbers that don’t drive action.
Without alignment, one team may focus on resolution time while another prioritizes customer empathy or personalization, making comparisons and progress tracking impossible.
- Gather input from support, sales, product, and marketing to define "satisfaction" across different customer journeys. Without this, each team may work toward a different goal, creating inconsistent experiences
- Clarify whether satisfaction is tied to resolution speed, personalization, ease of access, or something else
- Then, connect this definition to outcomes that matter, such as retention, upsell, and advocacy, so the metric means something beyond a score
❓How to create this shared definition Host a working session with key CX stakeholders, such as customer success leaders, heads of support, product owners, and marketing managers.
Use real customer journeys to map where satisfaction shows up and agree on how it should be measured.
💡Best practice
- Turn the process of identifying CSAT goals into a team-building exercise using live customer scenarios.
- For example, a support leader may value faster resolutions, while product teams prioritize onboarding satisfaction.
- When discussed together, you’ll find common ground and avoid misalignment later when reporting results.
Step 2: Identify key touchpoints and moments that matter
Evaluating customer satisfaction across the entire product cycle is neither possible nor advisable.
To streamline your data gathering and analysis process, focus on interactions and touchpoints that will help shape brand perception and decision-making. These are your moments that matter.
If you try to collect feedback after every interaction, you’ll overwhelm your customers and drown in fragmented data. But if you only track support tickets, you’ll miss satisfaction drivers in onboarding, renewals, or feature usage.
❓How to identify key touchpoints
- Map out the customer journey and pinpoint the key points where expectations are high, such as onboarding, escalations, renewals, or major product milestones
- To flag high-impact moments, use a mix of qualitative input (from frontline teams) and data (like drop-off points or repeat contacts)
- Prioritize where feedback will create the most actionable insight, not just where it's easiest to collect
💡Best practice
- Start with three to five high-friction or high-volume touchpoints. For example, if most customer churn happens post-renewal, measure satisfaction 30 days before and after that phase
- If onboarding is a common pain point, embed short CSAT surveys after completing the first interaction or milestone. This ensures your satisfaction data ties directly to business outcomes rather than just measuring for reporting
Step 3: Choose the right metrics for each stage
Not every part of the journey requires tracking the same metric.
A support interaction might call for CSAT. A renewal moment might need NPS. A self-service flow could benefit from a customer's effort score.
The key is choosing metrics that reflect what the customer expects and what your team can act on; using the wrong metric can lead to misleading insights.
For example, measuring NPS after a password reset tells you little about brand loyalty. Instead, align metrics to match touchpoints, channels, and goals.
❓How to choose the right metrics
- Use CSAT for quick post-interaction feedback, especially after support or onboarding events
- Use CES to evaluate how easy it was for the customer to solve a problem or complete a task
- Use NPS when you're gauging long-term loyalty and likelihood to refer
- Layer in open-ended feedback to understand the "why" behind the score
- Here’s a table highlighting the different CSAT metrics you can use:
Metric | What it tells you | Best use case |
Customer satisfaction (CSAT) | “Was this experience good enough?” Measures how well you met expectations in the moment | Post-interaction check-ins (e.g., after support, onboarding) |
“Will they stay with us long-term?” Reflects emotional and behavioral commitment | Strategic planning, churn forecasting | |
“Would they recommend us?” Indicates advocacy, not just satisfaction | Brand tracking, CX benchmarking | |
“Was it easy to get help?” Measures how much friction the customer faced | Self-service flows, contact center journey reviews |
💡Best practice
Map each customer journey stage, like awareness, consideration, purchase, onboarding, and retention, and assign metrics that align with the goals and expectations at each point.
Consider investing in a social listening tool like Sprinklr Insights to take this a step further.
These platforms will help you choose the right satisfaction metrics by uncovering insights from real-time, unstructured data across 30+ digital and social channels.
In the process, you will find indicators like customer sentiment, emotion, and brand mentions throughout the journey, from first impression to post-purchase support.
You can use the built-in dashboards and customizable reports to track and act on metrics like CSAT, share of voice, and brand awareness
👇 Also read: Customer service metrics to track in 2025 [+ How to use them]
Step 4: Choose the proper survey delivery method
Even the best-designed survey won’t deliver value if you send it at the wrong time or through the wrong channel.
How and when you ask for feedback directly impact response rates, data quality, and ultimately, your ability to act on what you learn.
As we’ve discussed before, enterprise customers engage across multiple platforms, including in-product, on mobile, via chat, or after support calls.
A one-size-fits-all survey strategy won’t capture satisfaction accurately across those touchpoints.
❓How to choose the proper survey touchpoint
- Use in-app surveys for product usage feedback and real-time experience ratings
- Use email surveys for post-purchase or longer-form feedback
- Chat-based surveys after live support sessions should be used for immediate context and higher response rates
- Avoid over-surveying, especially in high-frequency journeys like support or billing
💡Best practice
Limit surveys to two to three questions with one open-text field.
Continuously A/B test timing; surveying 30 seconds after an interaction vs. 30 minutes later can yield different results. Consider using dynamic survey logic based on user behavior or segments.
To go a step further, consider conversational surveys and automated analysis. It can auto-generate targeted survey questions, compare results with social, reviews, and support data insights, and surface real-time satisfaction drivers.
Here’s how it works: After hanging up a support chat, you send a conversational WhatsApp survey.
The AI engages the customer in a natural conversation and asks dynamic questions and finds out that the customer has been complaining about repeating their issue.
Sprinklr’s AI detects this pattern across chats and public reviews and flags it as a root cause. You consider the feedback and retrain agents, which leads to higher CSAT.
This end-to-end approach ensures you continuously measure, adapt, and act on what matters most across every channel for every customer.
Step 5: Integrate your systems for centralized insight
Collecting CSAT data is one thing. Making it usable across the business is another.
If insights are limited by disconnected tools, support platforms, CRM, surveys, and social dashboards, they won’t inform decisions at the speed your teams need.
Centralized visibility turns feedback into fuel. It ensures that marketing, support, product, and leadership follow the same playbook and respond to customers with consistency and context.
❓How to choose the proper survey touchpoint
- Integrate satisfaction metrics into your CRM or customer data platform, so feedback is tied to accounts, segments, and lifecycle stages
- Use customer journey analytics tools to visualize how satisfaction fluctuates across touchpoints
- Tag survey and sentiment data by interaction type, issue category, or customer tier to unlock deeper, action-ready insights
💡Best practice
Consolidate all voice-of-customer data into a unified CX dashboard and set up real-time alerts for key satisfaction trends or anomalies. This will let frontline teams respond faster, and strategy teams see the whole picture.
Consider using tools that automatically enrich satisfaction data with metadata, such as channel, agent, or product line, to slice insights without extra manual work.
That level of connected insight turns your satisfaction metrics from static reports into decision-ready intelligence that scales with your business.
Step 6: Close the feedback loop and act on insights
Measuring satisfaction means nothing if the insights don’t lead to action. Customers expect to see action based on their feedback.
When it doesn’t happen, satisfaction drops even further. Internally, teams lose trust in the process if feedback sits in a dashboard with no next step.
Your organization needs clear workflows to create a real impact and turn any type of customer feedback into real change.
❓How to choose the proper survey touchpoint
- Route low scores or negative sentiment to escalation workflows, whether that’s auto-replies, callbacks, or priority support
- Share recurring feedback trends with product, training, or process teams so systemic issues are addressed
- Use positive feedback to reinforce what’s working, recognize agents, optimize high-performing channels, and replicate best practices
💡Best practice
- Operationalize satisfaction metrics by including them in weekly or monthly business reviews, not just quarterly reports
- Set benchmarks and define owners for each journey stage, so action is continuous, not reactive
- Automate “close the loop” actions wherever possible, like triggering a follow-up when NPS drops or escalating repeat low-CSAT customers for retention outreach. This approach turns customer feedback into enterprise learning and builds a CX program that delivers on its promise.
Deep dive: Customer feedback: How to collect and analyze (latest guide)
Case studies: Why CSAT is important for enterprises
Studies show that satisfied customers are more likely to trust your brand and return for repeat purchases.
Satisfaction and trust are key drivers of future buying decisions, especially in post-sale scenarios.
And for enterprises, satisfaction isn’t a soft metric; it’s a lever to drive revenue, increase customer retention, and enhance long-term customer value.
1. Utility Warehouse increased its star rating by 33% by unifying its first touchpoints
Utility Warehouse, a leading UK multi-service provider, uses Sprinklr Service — part of the unified customer experience platform — to improve customer experience and satisfaction.
They unify their digital support channels and automate responses through an AI-powered platform.
Following the unification of their support channels, “we immediately saw a huge drop in the number of phone calls we received because the automated responses assuage customer anxiety and let them know their issues are being actively looked into,” explains Sean McManamon, network relationship manager of Utility Warehouse.
This approach enabled faster, more consistent service, resulting in a 48% increase in first-contact resolution (FCR) and five-star customer reviews from 66% to 93%.
Recommended: Customer happiness: Proven strategies to delight and retain your customers
2. Jackson Hewitt doubled review response coverage while cutting effort in half
With over 5,200 locations, Jackson Hewitt faced the massive CX challenge of fragmented review management.
Each branch handled Google My Business reviews separately, leading to inconsistent messaging and tone of voice, slower replies, and compliance risks. All these factors impact the overall customer satisfaction scores in real life.
By centralizing review management with Sprinklr’s unified platform, the company used the built-in AI tools and pre-approved response templates to ensure speed, accuracy, and brand consistency.
As a result, they reduced average handling time by 80%, increased review response coverage from 40% to nearly 100% and maintained quality, despite a surge in volume during tax season, which improved customer satisfaction as a byproduct.
3. A leading European retailer saved 864 agent hours while improving digital CX
This major European retail brand wanted to replicate its in-store service experience across digital.
But managing campaigns, service, and engagement across multiple social channels was time-intensive, keeping agents from focusing on high-value conversations.
With Sprinklr’s Unified-CXM platform, the company combined AI chatbots for routine queries with tools that empowered agents to focus on personal support and sales.
In just eight months, they saved 864 hours (about 1 month and 11 days) of agent time while increasing service consistency, reducing delays, and elevating customer satisfaction.
Knowledge, tools, and strategy aren’t enough. You need customer intelligence
By now, you have a good grasp of the knowledge, strategies, and tools required to measure customer satisfaction regularly. But any vendor can offer metrics, dashboards, and templates.
Some might even promise more for less. What sets real enterprise growth apart isn’t just capability, it’s intelligence.
Does generative AI power your CSAT tools? Are they updated frequently with the latest models, features, and security protocols? Can your platform adapt as fast as your customers do?
Sprinklr Insights is built for that reality. Trusted by brands like Uber, Microsoft, and Acer, the platform is continuously enhanced with the latest advancements in generative AI, from real-time sentiment analysis to AI-first survey design.
The products are unified in a secure, enterprise-ready stack, so you’re not switching tools every time the market shifts.
Ready to see what intelligent CSAT measurement looks like? Book a free demo and experience it for yourself.
Frequently Asked Questions
Yes. You can track satisfaction through in-app surveys, feedback widgets, chat transcripts, and behavioral data like drop-off rates or repeat visits.
AI CSAT software like Sprinklr can also analyze sentiment from chatbot interactions and help center activity to measure satisfaction without human contact.
Continuously. For large enterprises, waiting for quarterly surveys isn't enough. Use real-time feedback tools after key interactions, monitor sentiment on digital platforms, and run periodic deep-dive surveys to capture trends over time.
The most valuable sources combine structured and unstructured data. This includes post-interaction surveys (CSAT, NPS), support tickets, call/chat transcripts, product reviews, and social media sentiment. AI platforms help unify these into a complete view of customer satisfaction.
Yes. AI tracks satisfaction signals from live chat, emails, social posts, and call transcripts. It tags sentiment, detects emotion, and flags dissatisfaction as it happens, so teams can act before the customer churns or escalates.
Some common mistakes include:
- Measuring too few touchpoints
- Relying only on surveys
- Ignoring unstructured feedback
- Treating satisfaction scores as results, not signals to act
- Not aligning KPIs to business goals or ownership
Avoid these, or you might get an inaccurate view of customer experiences.
