- What is contact center reporting?
- Types of contact center reports
- How reporting enhances your contact center performance
- 10 key metrics and KPIs in contact center reporting
- Top 5 contact center reporting tools
- Steps to improve contact center performance by efficient reporting
- How can Sprinklr simplify reporting for you?
What is contact center reporting?
Contact center reporting is the process of collecting, processing, analyzing, and presenting contact center data to reveal insights into a contact center's operational excellence and performance. It assesses customer satisfaction, net promoter score and loyalty while revealing the operational agility and efficiency of your customer service delivery. Contact center reporting constitutes the following activities:
Data collection: Gathering data from various sources within the contact center, including ACD, CRM, IVR, and WFM systems.
Data processing and transformation: Organizing and formatting raw data into a usable format for analysis.
KPI definition: Defining key performance indicators (KPIs) that align with business goals and customer service objectives.
Report creation: Generating reports that present relevant contact center metrics and KPIs in a clear and understandable format.
Data analysis: Examining the reports to identify trends, patterns, and areas for improvement in contact center operations.
Performance evaluation: Assessing agent performance based on metrics like first-call resolution, AHT, customer satisfaction scores, etc.
Forecasting and planning: Using historical data to predict future call volumes and staffing needs, enabling effective resource allocation.
Quality assurance monitoring: Evaluating the quality of customer interactions through methods like call quality monitoring, scoring, and feedback.
Feedback and coaching: Providing agents with feedback on their performance and offering coaching or training to address areas for improvement.
Compliance tracking: Ensuring that agents adhere to company policies and regulatory requirements in their interactions.
Continuous optimization: Using insights from reports to implement changes in processes, workflows, and staffing levels to enhance performance.
Feedback loop management: Establishing mechanisms to collect feedback from customers and agents for ongoing process improvement.
Custom report development: Creating specialized reports tailored to specific business needs or client requirements.
Read more: The A to Z of contact center analytics
Types of contact center reports
Automation and AI have made contact center reporting more comprehensive than ever. Contact center reports can be broadly categorized into three types:
Agent performance reports
Customer satisfaction reports
Contact center performance reports
Let’s take a look at the most common reports under each category frequently used to assess quality management and contact center operations.
1. Agent performance reports
Agent availability report
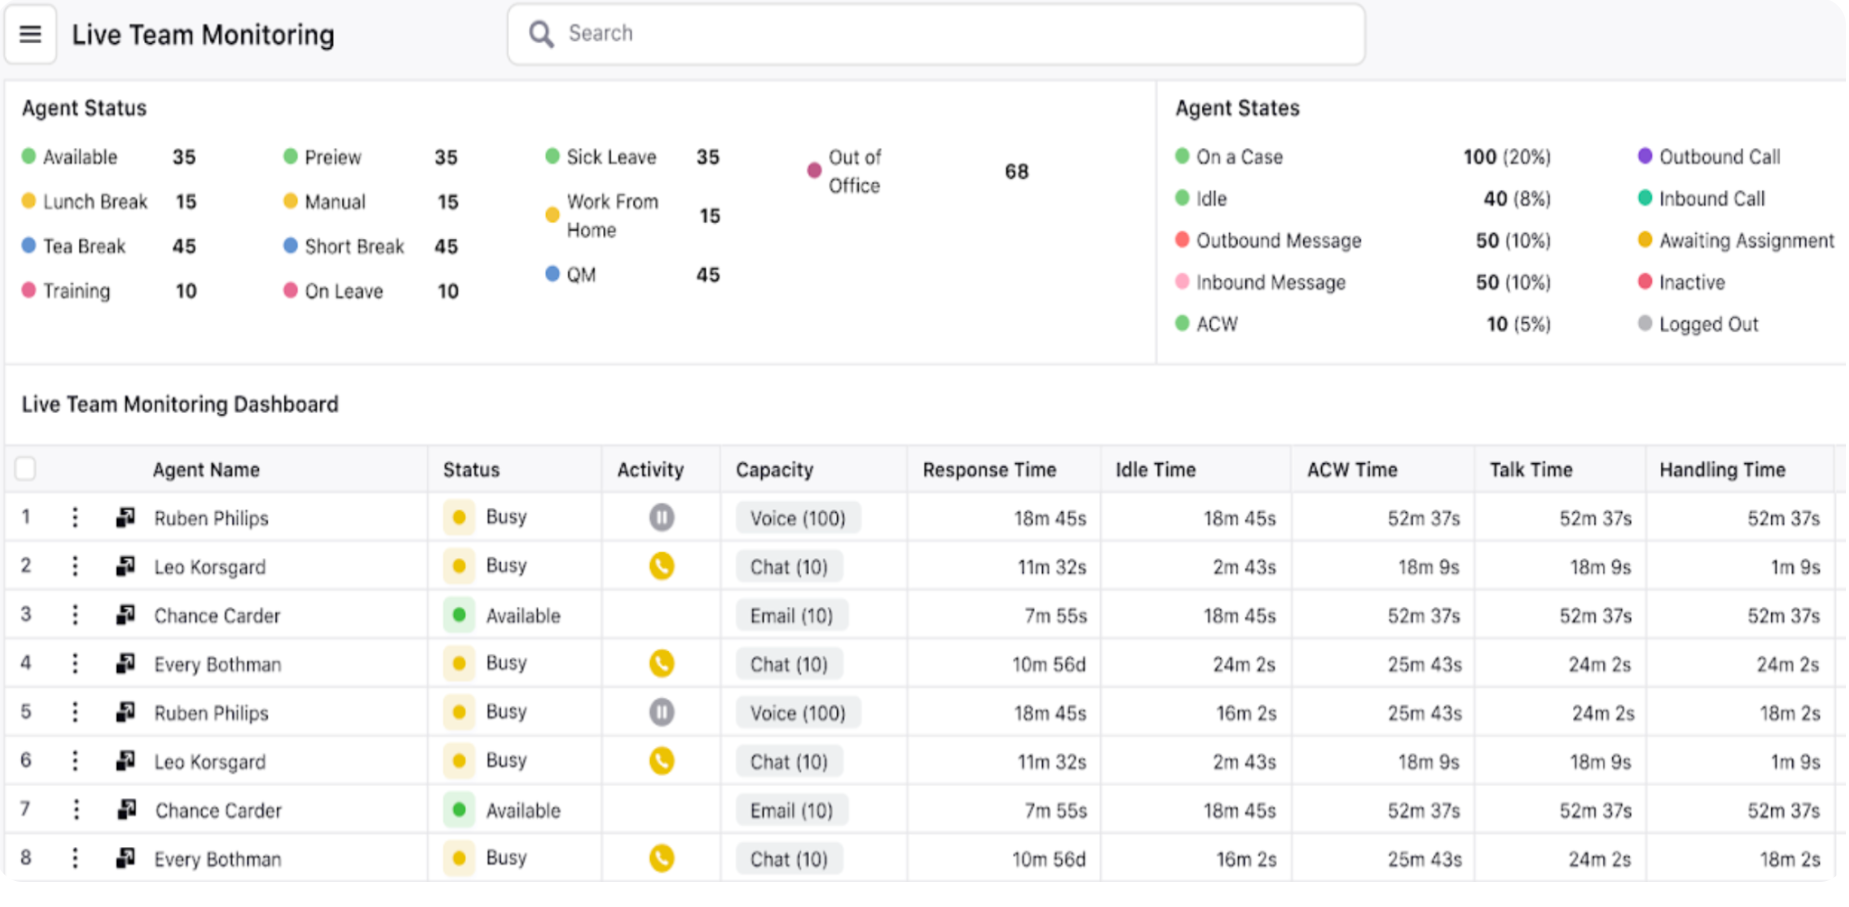
The agent availability report highlights agents' login and logout times, total logged-in times, and more. Hence, it accurately reports the number of available and unavailable agents in your contact center at a given time.
Agent activity report
Agent activity reports cover key metrics such as average handling time, first-contact resolution and percentage of unanswered calls, typically reflecting agents' activities on a particular day, week, month or quarter. Other key aspects reflected in this report are
Number of calls offered to an agent
Number of calls taken by an agent
Number of unique profiles handled by an agent
Average call duration from call connection to disconnection
Percentage of the number of tickets resolved within the SLA
Average time taken to resolve/close a ticket
Top agents by reply time
Top agents by no. of replies
Top agents by call handled
Top agents by average handling time (AHT)
Good to know: Advanced unified omnichannel platforms allow supervisors to customize agent performance reports for channels like voice, social, email and live chat.

Quality management report
Quality management is a robust reporting instrument, empowering contact centers to excel in customer experiences and elevate agent performance. By scrutinizing all customer interactions, whether digital or voice-based, it furnishes quality managers and supervisors with AI-powered agent quality and compliance scores. This signifies that each conversation undergoes real-time analysis and data is consolidated across all channels, forging a singular foundation for contact center metrics.
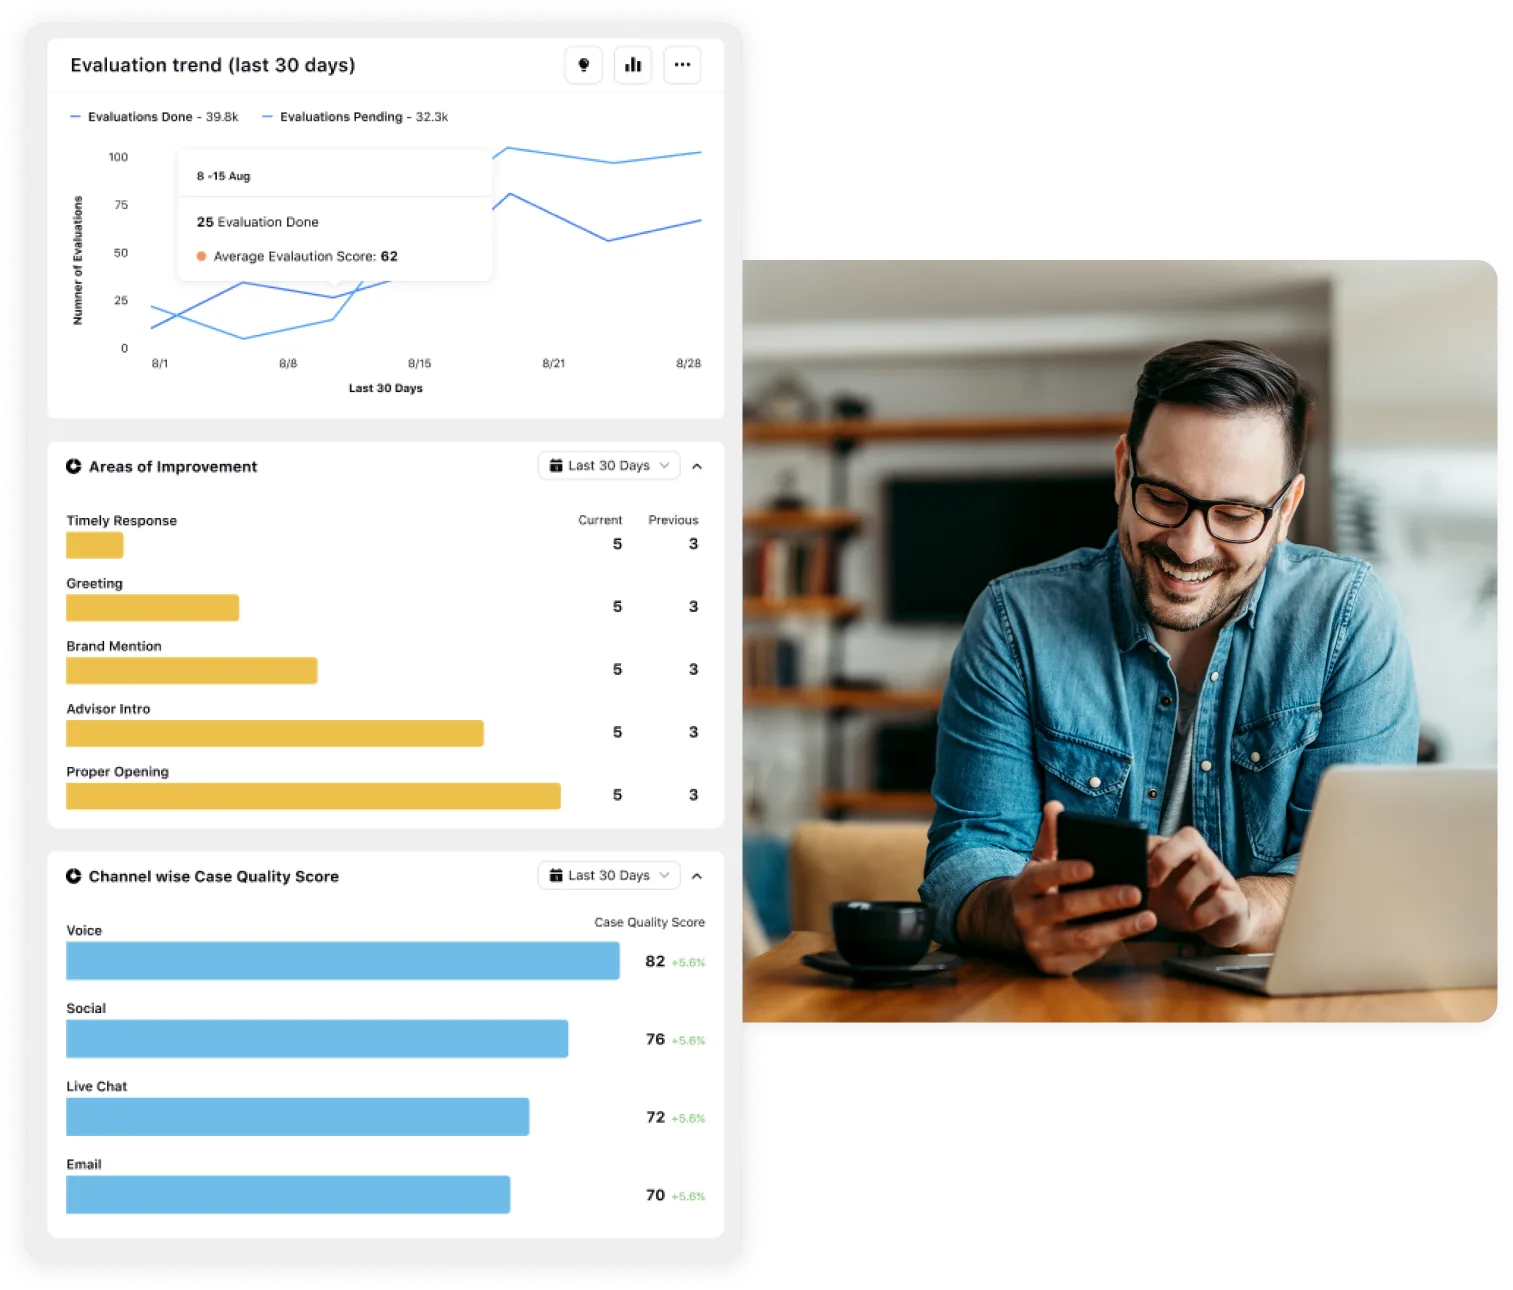
Do you know: Advanced call center quality monitoring software enables live and virtual agents to switch between channels while keeping the full context of the conversation. Moreover, you can automate your call center quality assurance with real-time, AI-powered conversational analytics that show you performance, service levels and CSAT metrics, all without digging for reports.
Adherence to schedule
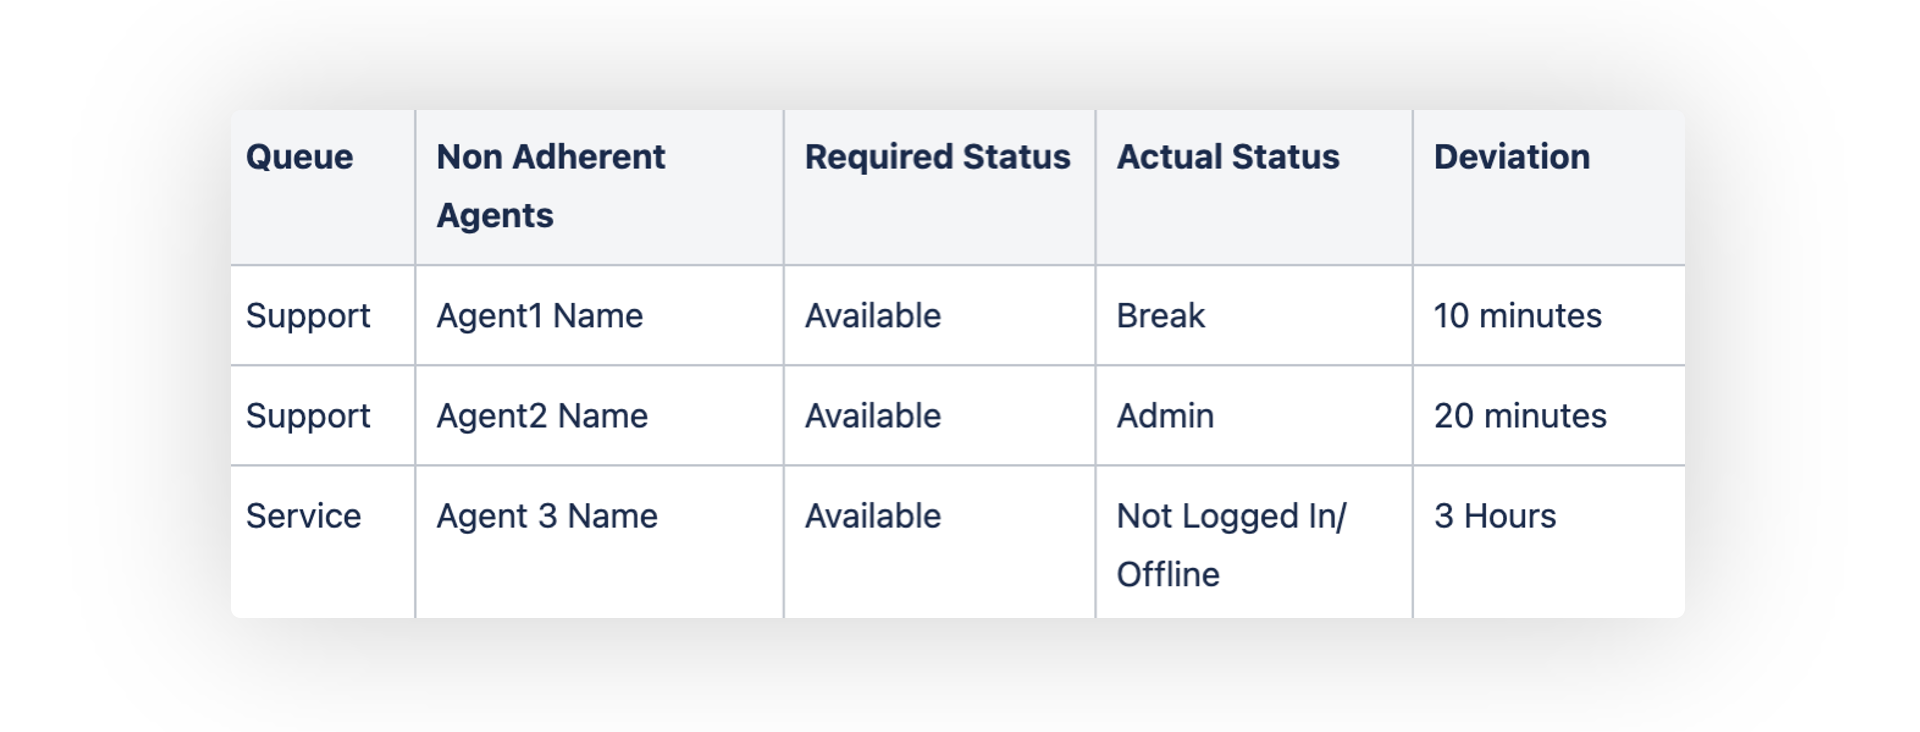
Effectively managing agents' scheduled and actual activities can be a challenging endeavor. Here, the real-time Agent Adherence report provides an all-encompassing solution. This report meticulously compares agents' scheduled activity status with their actual performance and presents this data to supervisors in a user-friendly format. This eliminates the necessity for continuous manual monitoring, ensuring supervisors are kept well informed.
Occupancy rate
The occupancy rate report in a contact center provides valuable insights into how efficiently agents are utilized during their working hours. It typically includes agent, availability, idle time, after-call-work time, hold time, meeting and training time, break time and unavailable time.
Call wrap-up time
Call wrap-up time, also known as after-call work (ACW) time, refers to the duration after a customer interaction, during which an agent performs tasks related to that interaction. It includes various post-interaction activities to ensure the customer's needs and inquiries are fully addressed and documented.
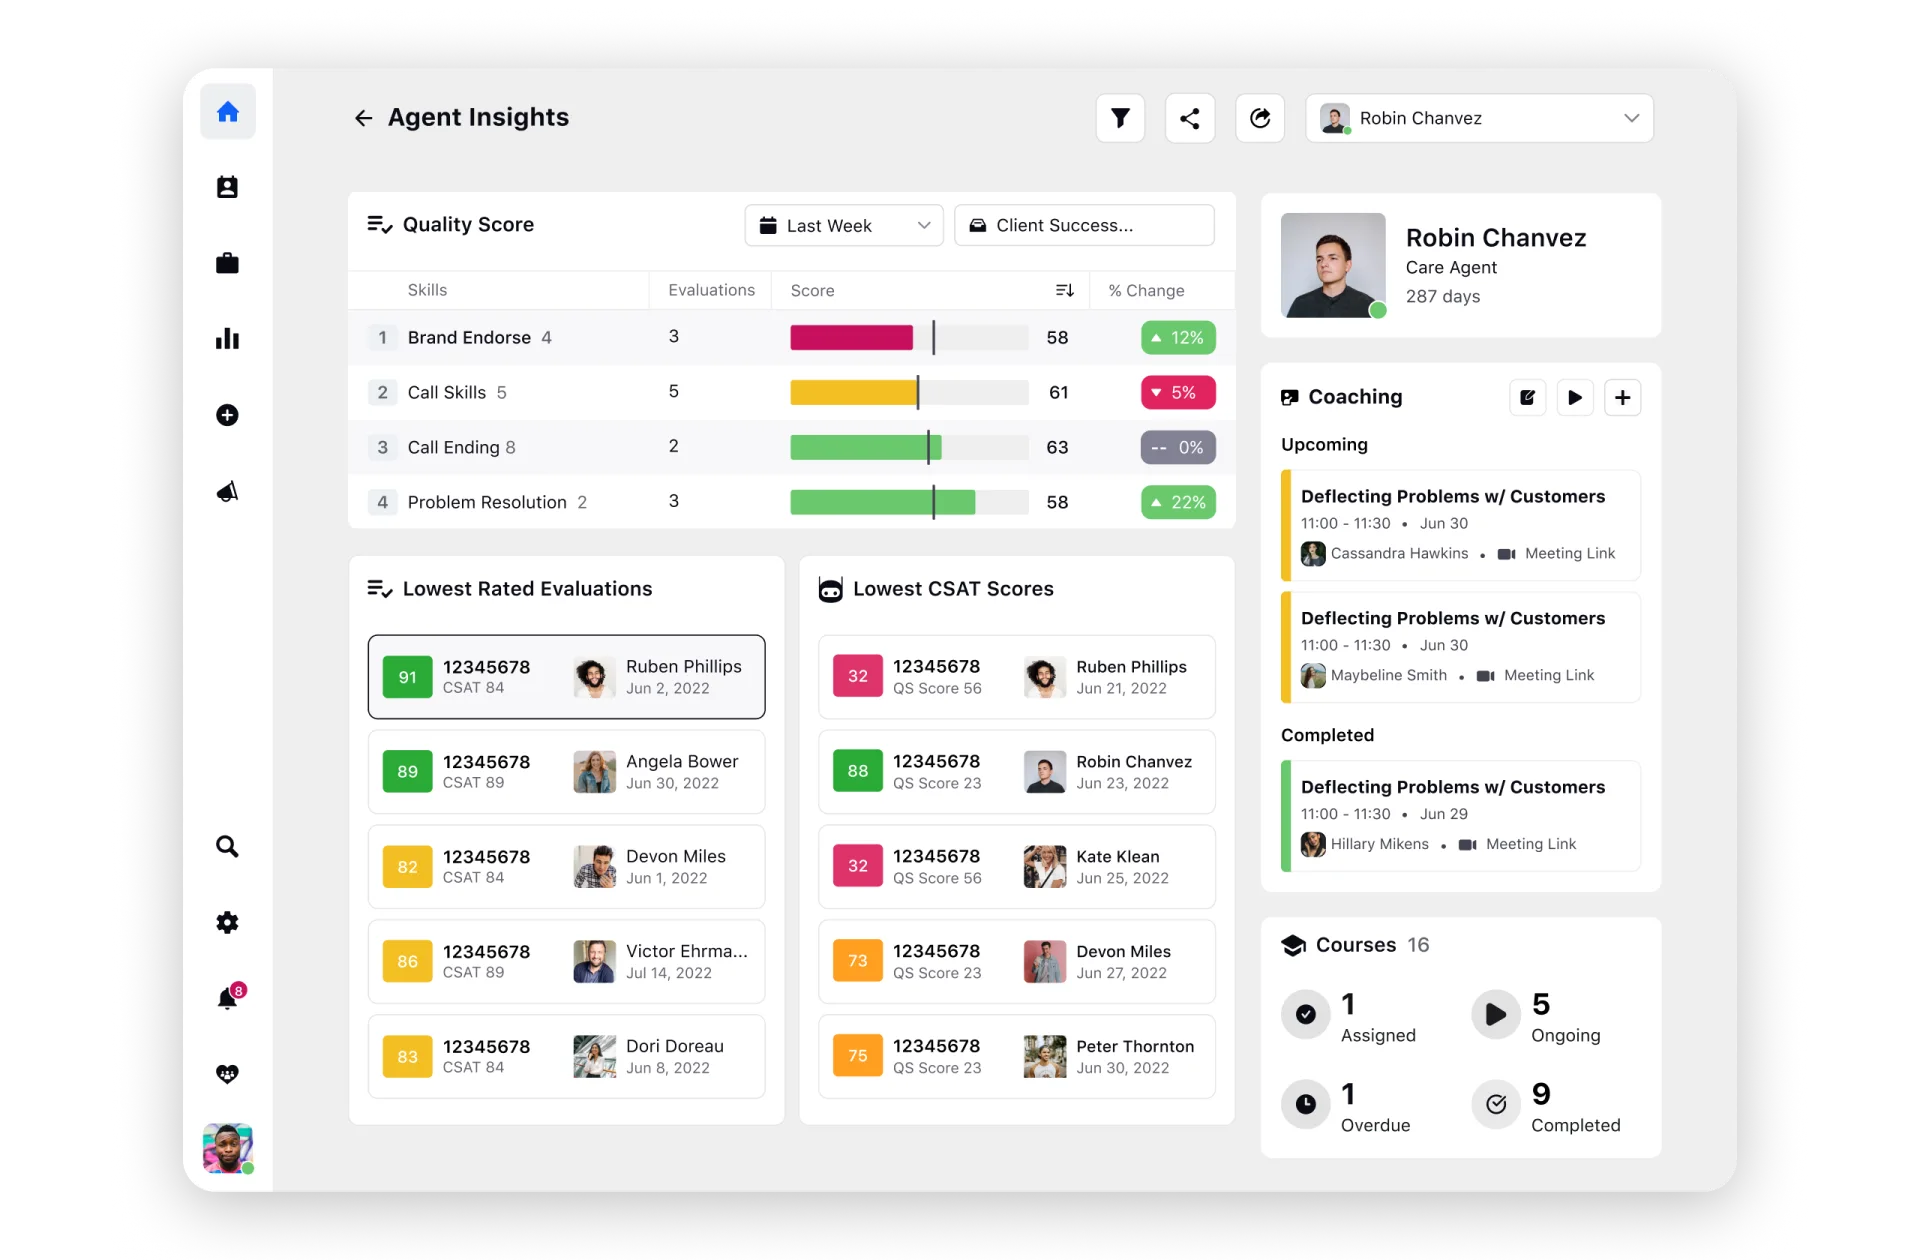
Good to know: Modern reporting and analytics software gives supervisors complete visibility into cases handled by their agents and surfaces critical insights such as which channels are used, how customers feel and agent behavior to make decisions on agent self-learning, coaching, scheduling and engagement strategies.
2. Customer satisfaction reports
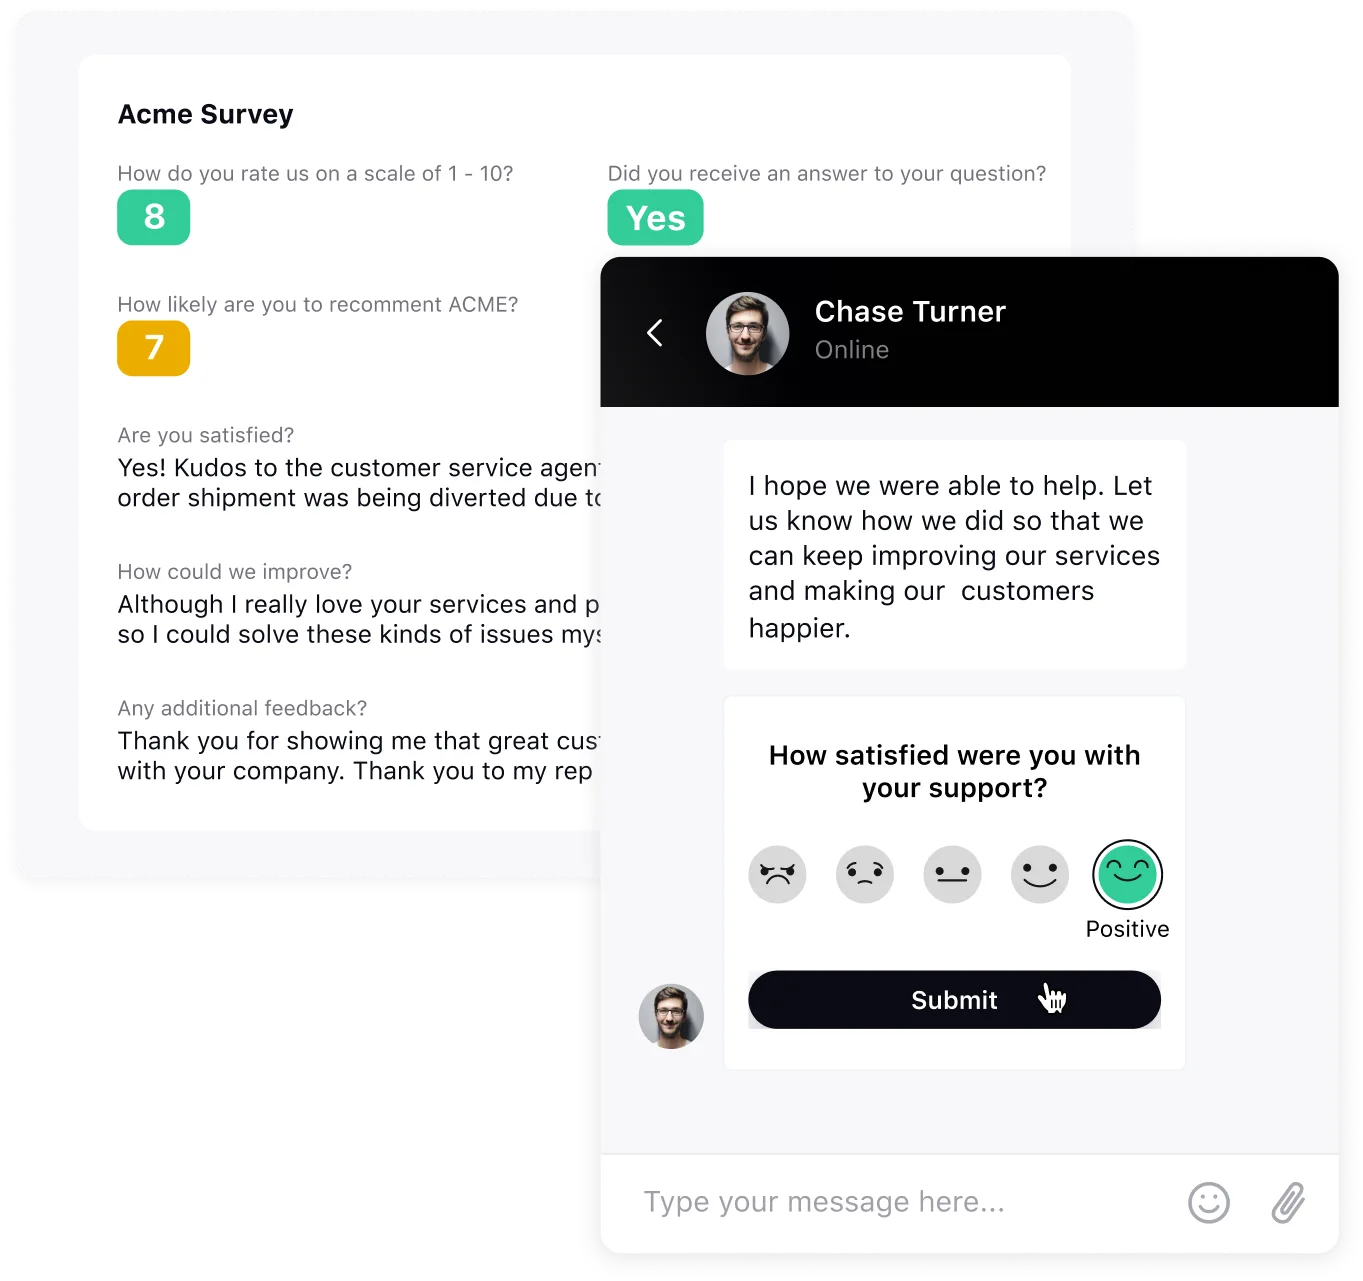
Customer feedback report
Agents and supervisors use this report to gauge customer feedback about service quality. This report analyzes three main feedback metrics:
Customer satisfaction (CSAT): To gauge the extent to which customers are happy when they interact with your company.
Customer effort score (CES): Indicates the amount of effort customers usually expend while interacting with your business.
Net promoter score (NPS): Quantifies customer loyalty by asking customers how likely they are to recommend your company or product, rated on a 0-10 scale.
Good to know: Modern customer satisfaction software automates customer surveys across multiple channels, eliminating the redundant work of creating surveys and obtaining customer feedback on a channel-by-channel basis. Moreover, you can trigger and send surveys automatically without relying on agents.
Customer retention report
The Customer retention rate report provides insights into how effectively a company retains its existing customers over a specified time period. The formula to calculate the churn rate is as follows:
Retention rate = (No. of customers at the end of the period – No. of customers acquired during the period/ No. of customers at the start of the period ) x100 |
In addition, this report also includes:
Churned customers
Reasons for customer churn
Impact on revenue
3. Contact center performance report
Service level agreement (SLA) report
SLAs lay down performance benchmarks for contact centers. An SLA report displays the mandatory metrics and your center's performance against each metric. For example, most contact centers employ an 80-20 rule. This means they must answer 80% of the calls in 20 seconds. An SLA report shows the supervisors:
How many times has an SLA been breached?
Number of agents and their names who are unable to stick to the SLA guidelines.
When did the breach happen - during peak or lean hours?
Good to know: SLA management is easy as pie today. You can define, customize and optimize SLA policies for different support platforms. In addition, set custom escalation policies and send alerts automatically to the suitable supervisor when SLA time approaches.

Workforce management report
The Workforce management (WFM) report encompasses forecasting, anomaly detection, staffing, reporting, scheduling, alerts, notifications and employee leave details. These help supervisors ensure proper resource allocation, forecast staffing needs, monitor schedule adherence, track performance, monitor compliance and optimize costs.
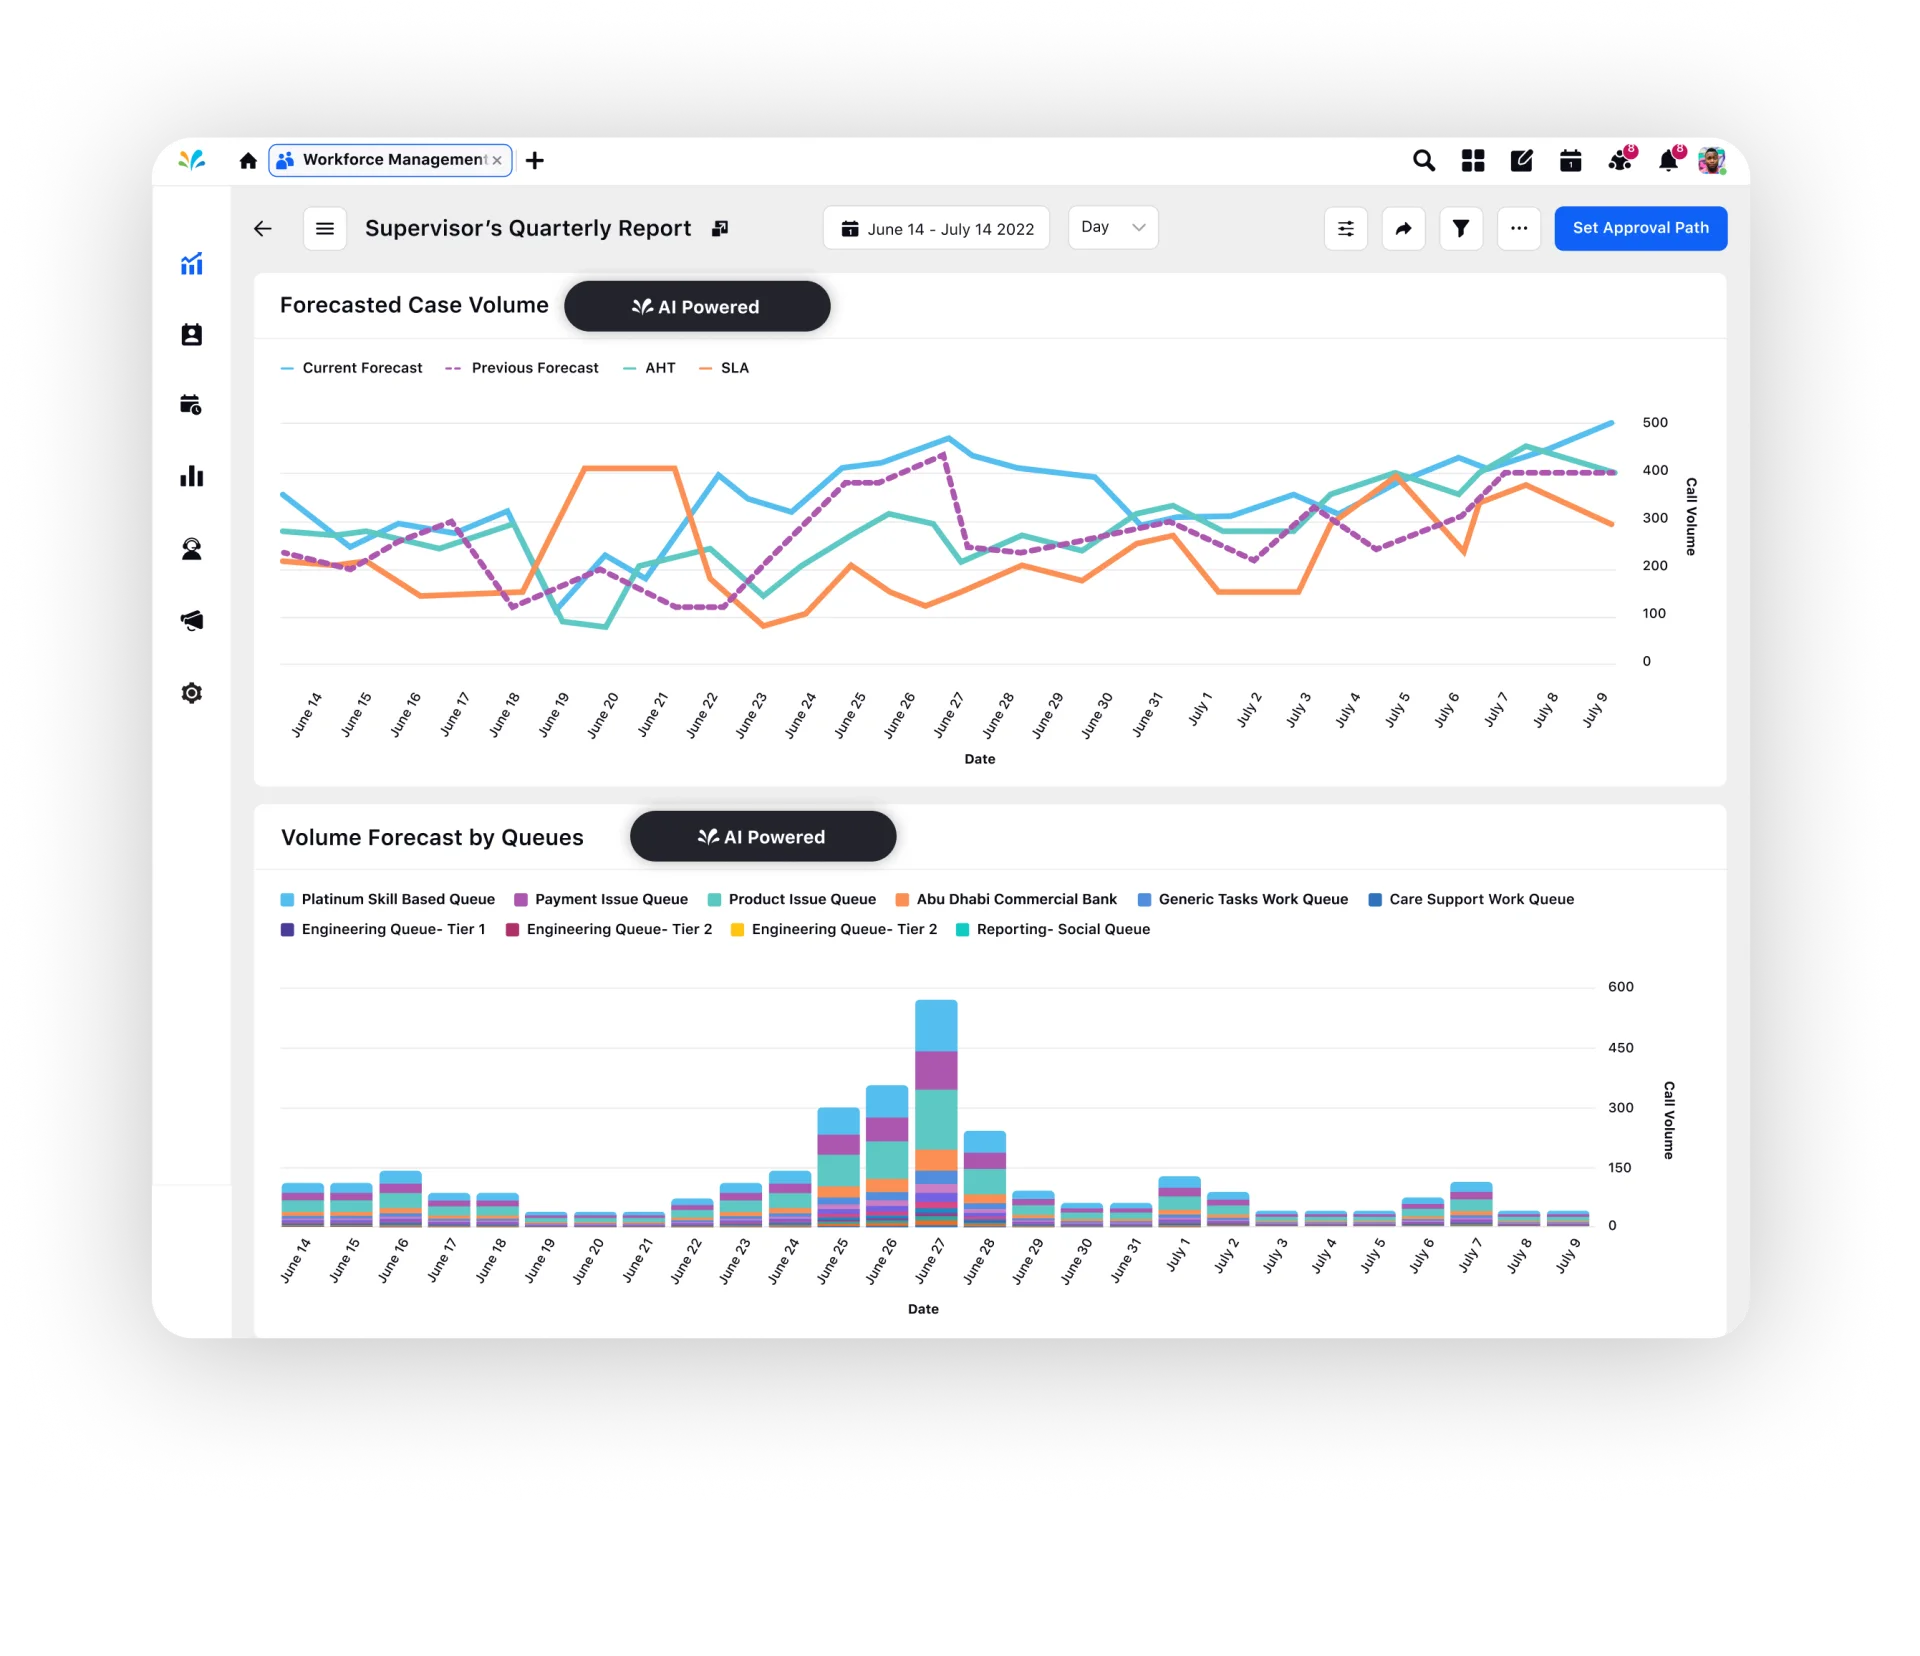
Good to know: From forecasting to capacity planning, omnichannel scheduling and customized reports and alerts, advanced call center workforce management software helps you accurately predict your workforce needs, improve efficiencies and cut down administrative workload by 30%.
IVR performance report
The IVR (Interactive Voice Response) performance report provides an evaluation of how effectively the IVR system is functioning within a contact center. It includes various key metrics and data points related to the IVR system's performance. Here are the typical components of an IVR Performance Report:
Call completion rate: This measures the percentage of calls that successfully navigate through the IVR system and reach the intended destination, whether it's self-service options or agent routing.
IVR response time: This indicates the average time it takes for the IVR system to respond to a caller's input or request. Shorter response times generally lead to a smoother customer experience.
Menu navigation success rate: It evaluates the percentage of callers who successfully navigate the IVR menu options to reach their desired destination without encountering issues or missteps.
Abandonment rate within IVR: This tracks the percentage of callers who hang up or abandon the call while interacting with the IVR system. A high abandonment rate within the IVR may indicate usability issues.
Call deflection: This measures the percentage of calls that are resolved within the IVR system without the need for agent intervention, indicating the effectiveness of self-service options.
Error handling: It assesses how well the IVR system handles errors or misunderstandings in caller input, ensuring that callers can recover and continue their interaction smoothly.
IVR Survey Results: If post-interaction surveys are incorporated into the IVR system, this provides feedback on the caller's experience and satisfaction with the IVR process.
IVR load and performance testing results: This includes data on how the IVR system handles peak call volumes and whether any performance issues arise under high load.
IVR outage or downtime information: Records any instances of IVR system downtime, which may impact overall call handling efficiency.
How reporting enhances your contact center performance
Contact center reporting provides accurate and timely information on:
Progress of daily tasks
The efficiency of agents and processes
The state and impact of customer service
Plus, here are the other key ways contact center reporting impacts the output.
Strategic decision making
Contact center performance reports are invaluable for you to make informed, data-driven decisions. By meticulously analyzing these reports, latent trends and patterns within your workforce and processes are highlighted. This insightful data empowers you to implement targeted changes in hiring strategies, refine training programs, adopt advanced technologies and fine-tune overall contact center management. For instance, if reports reveal a surge in call volumes during specific hours, you can strategically adjust staffing levels to ensure adequate coverage.
Shapes the customer experience
Utilizing insights from customer satisfaction reports can be transformative for your contact center. Implementing the recommendations derived from these reports can significantly enhance mission-critical customer support metrics, such as customer satisfaction (CSAT) and customer retention. By understanding what resonates with your customers, the contact center can refine strategies and practices, ensuring a consistently exceptional experience that fosters loyalty and trust.
Evaluates agent performance
Contact center reporting maps agent-customer interactions, assesses agent performance against set goals and ensures adherence to organizational guidelines. It aids in identifying performance gaps and agents in need of additional training.
Leads to cost optimization
Monitoring every aspect of your contact center can be both challenging and costly. Reporting highlights areas that require streamlining. For instance, implementing skill-based routing for quicker call resolution can lead to time and cost savings.
Improves operational efficiency
By dissecting key performance metrics, you can pinpoint areas that require optimization. This data-driven approach allows for strategic resource allocation, streamlined workflows, and the implementation of technology solutions, resulting in a more agile and cost-effective operation.
Compliance and regulations
Contact center reporting meticulously monitors and enhances agent compliance with scripts, policies and regulatory requirements. It significantly mitigates the risk of compliance issues, fortifying the contact center's ability to operate within legal and industry-mandated parameters. This not only safeguards the business but also fosters trust with customers who rely on secure and compliant interactions.
Editor’s pick: How to ensure contact center compliance in 2023 (+ checklist)
10 key metrics and KPIs in contact center reporting
Contact center reporting has evolved over the years, with customer experience and agent performance proving to be the critical indicators of contact center success. The following metrics surrounding both are observed across all contact centers.
1. Quality assurance score
The Quality Assurance (QA) Score is a critical metric that evaluates the quality of interactions between agents and customers. It involves a systematic assessment of calls or interactions based on predefined criteria, such as adherence to scripts, empathy, active listening and resolution accuracy. The QA score provides a quantitative measure of how well agents are meeting established quality standards. A high QA score signifies that agents consistently deliver high-quality service, ensuring customer satisfaction and loyalty. On the other hand, a low QA score may indicate areas for improvement in agent training, coaching, or process refinement.
2. First response time (FRT)
It is the waiting time for a customer in a queue. The lower the first response time, the less time your customers wait to speak to an agent. A high first response time could indicate poor staffing at your contact center.
Formula:
FRT = Total Wait Time for All Calls / Total Number of Calls |
Interpretation: The lower the response times, the better.
Download eBook: 5 Ways to Improve Customer Response Times — and Your Bottom Line
3. First contact resolution (FCR)
First contact resolution is the percentage of customer queries an agent resolves and closes the query in the first contact without transferring, pausing or escalating it. A high FCR percentage indicates efficient and satisfactory customer service, as it minimizes customer effort and frustration.
Formula:
FCR = Total Number of Calls Resolved on First Attempt / Total Number of Calls Received |
Interpretation: The higher the first contact resolution, the better.
4. Abandonment rate
The call abandonment rate indicates the number of callers who hang up before reaching an agent. The reasons behind a high average call abandonment rate are:
Longer hold times.
Overly complex IVR menus.
Insufficient staffing.
Ineffective call routing systems.
Formula:
Call Abandonment Rate = (Number of Calls – Number of Handled Calls) / Number of Calls x 100 |
Interpretation: The lesser the call abandonment rate, the better.
5. Average speed of answer
Average speed of answer is a crucial metric that measures the average time it takes for calls to be answered by agents once they enter the queue. It provides valuable insights into the responsiveness of the contact center.
Formula:
Average Speed of Answer (ASA)=Total Waiting Time for Answered Calls/Total Number of Answered Calls |
A low ASA indicates that calls are being handled promptly, contributing to positive customer experiences. Conversely, a high ASA suggests longer wait times, which can lead to customer frustration and dissatisfaction.
By monitoring and managing ASA, contact centers can fine-tune their staffing levels, optimize call routing strategies, and implement interactive voice response (IVR) systems to improve responsiveness and reduce wait times.
6. Average handle time (AHT)
Average handle time is a metric used in contact centers to measure the average duration of a customer call interaction from when a customer initiates a phone call to the time of final resolution — which may happen either during the call or later. The duration includes talk time, hold time, transfers, and any after-call work (ACW) that an agent must perform post-interaction to resolve the customer query.
Formula:
AHT = (Total Talk Time + Total Hold Time + Total After-Call Work Time) / Total Number of Calls |
Interpretation: A lower AHT often indicates efficient and streamlined customer service, as agents resolve issues promptly. However, it's essential to balance AHT with other factors like quality of service to ensure that speed doesn't compromise the effectiveness of customer interactions.
7. Agent adherence to script
Agent adherence to scripts assesses how well agents follow prescribed conversation scripts or guidelines during customer interactions. This metric is crucial for maintaining consistency and ensuring that agents convey accurate and on-brand information to customers.
Formula:
Agent Adherence to Script = (No. of Calls Where Agent Followed the Script/Total No. of Evaluated Calls) x 100 |
High adherence to scripts indicates that agents are effectively using provided resources to deliver standardized, reliable information. However, it's essential to balance adherence with the ability to adapt to unique customer needs.
Monitoring agent adherence to scripts allows contact centers to identify areas for improvement in training and script effectiveness, ensuring that agents are well-equipped to handle a wide range of customer inquiries and concerns. It also helps maintain compliance with regulatory requirements and internal policies.
8. Service level
Service level measures the efficiency of a contact center in terms of call responsiveness. It represents the percentage of calls answered within a specified timeframe, typically expressed as a service level goal (e.g., 80% of calls answered within 20 seconds).
Formula:
Service Level = (Number of Calls Answered within a Defined Timeframe/Total No. of Calls Received) X 100 |
Maintaining a high service level is crucial for delivering prompt and satisfactory customer service. Regular monitoring of service level metrics allows contact centers to proactively manage call volume, staffing, and resource allocation to meet or exceed customer expectations for responsiveness consistently.
9. Forecast accuracy
Forecast accuracy is a vital metric that evaluates the precision of predicted call volumes and other contact center metrics compared to actual results. It measures how well the contact center's forecasting models align with real-world operational data.
Formula:
Forecast Accuracy = (Actual Value – Forecast Value/Actual Value) x 100 |
Accurate forecasting is essential for effective resource planning, ensuring that the right number of agents are available to handle expected call volumes. A high forecast accuracy indicates that your contact center can reliably anticipate customer demand and allocate resources accordingly.
However, if there are significant disparities between forecasts and actual volumes, it may lead to issues like understaffing or overstaffing, which can negatively impact your service levels and operational costs.
10. Customer satisfaction score (CSAT)
Measuring how happy your customers are with your service is a simple metric. You can calculate customer satisfaction by asking customers to rate your service on a scale of 1 to 5 or 1 to 10. The percentage of customers who score you between 8 and 10, or 4 and 5, make up your CSAT score.
Formula:
CSAT = Number of Satisfied Customers / Number of Survey Responses * 100 |
Interpretation: A high CSAT score indicates that customers are content with the service they receive.
11. Customer effort score (CES)
The customer effort score measures how much input your customers have to give to resolve their queries. First, you ask customers to rate your service on a scale of 1 to 5. Here, 1 means it was difficult to get a resolution, and 5 indicates it was easy.
Formula:
CES = [Number of customers who rate you between 4 and 5] – [Number of customers who rate you between 1 and 3] |
Interpretation: The higher, the better. A low CES indicates that customers found the process difficult and may be at risk for dissatisfaction and attrition.
Interested to learn more? Check out the full list of contact center metrics for 2023 here
Top 5 contact center reporting tools
Reliable contact center reporting tools can take the pain out of data analytics and reporting through quick data processing, forecast accuracy and visual reporting. Let’s look at the top five contact center reporting tools available today.
1. Sprinklr
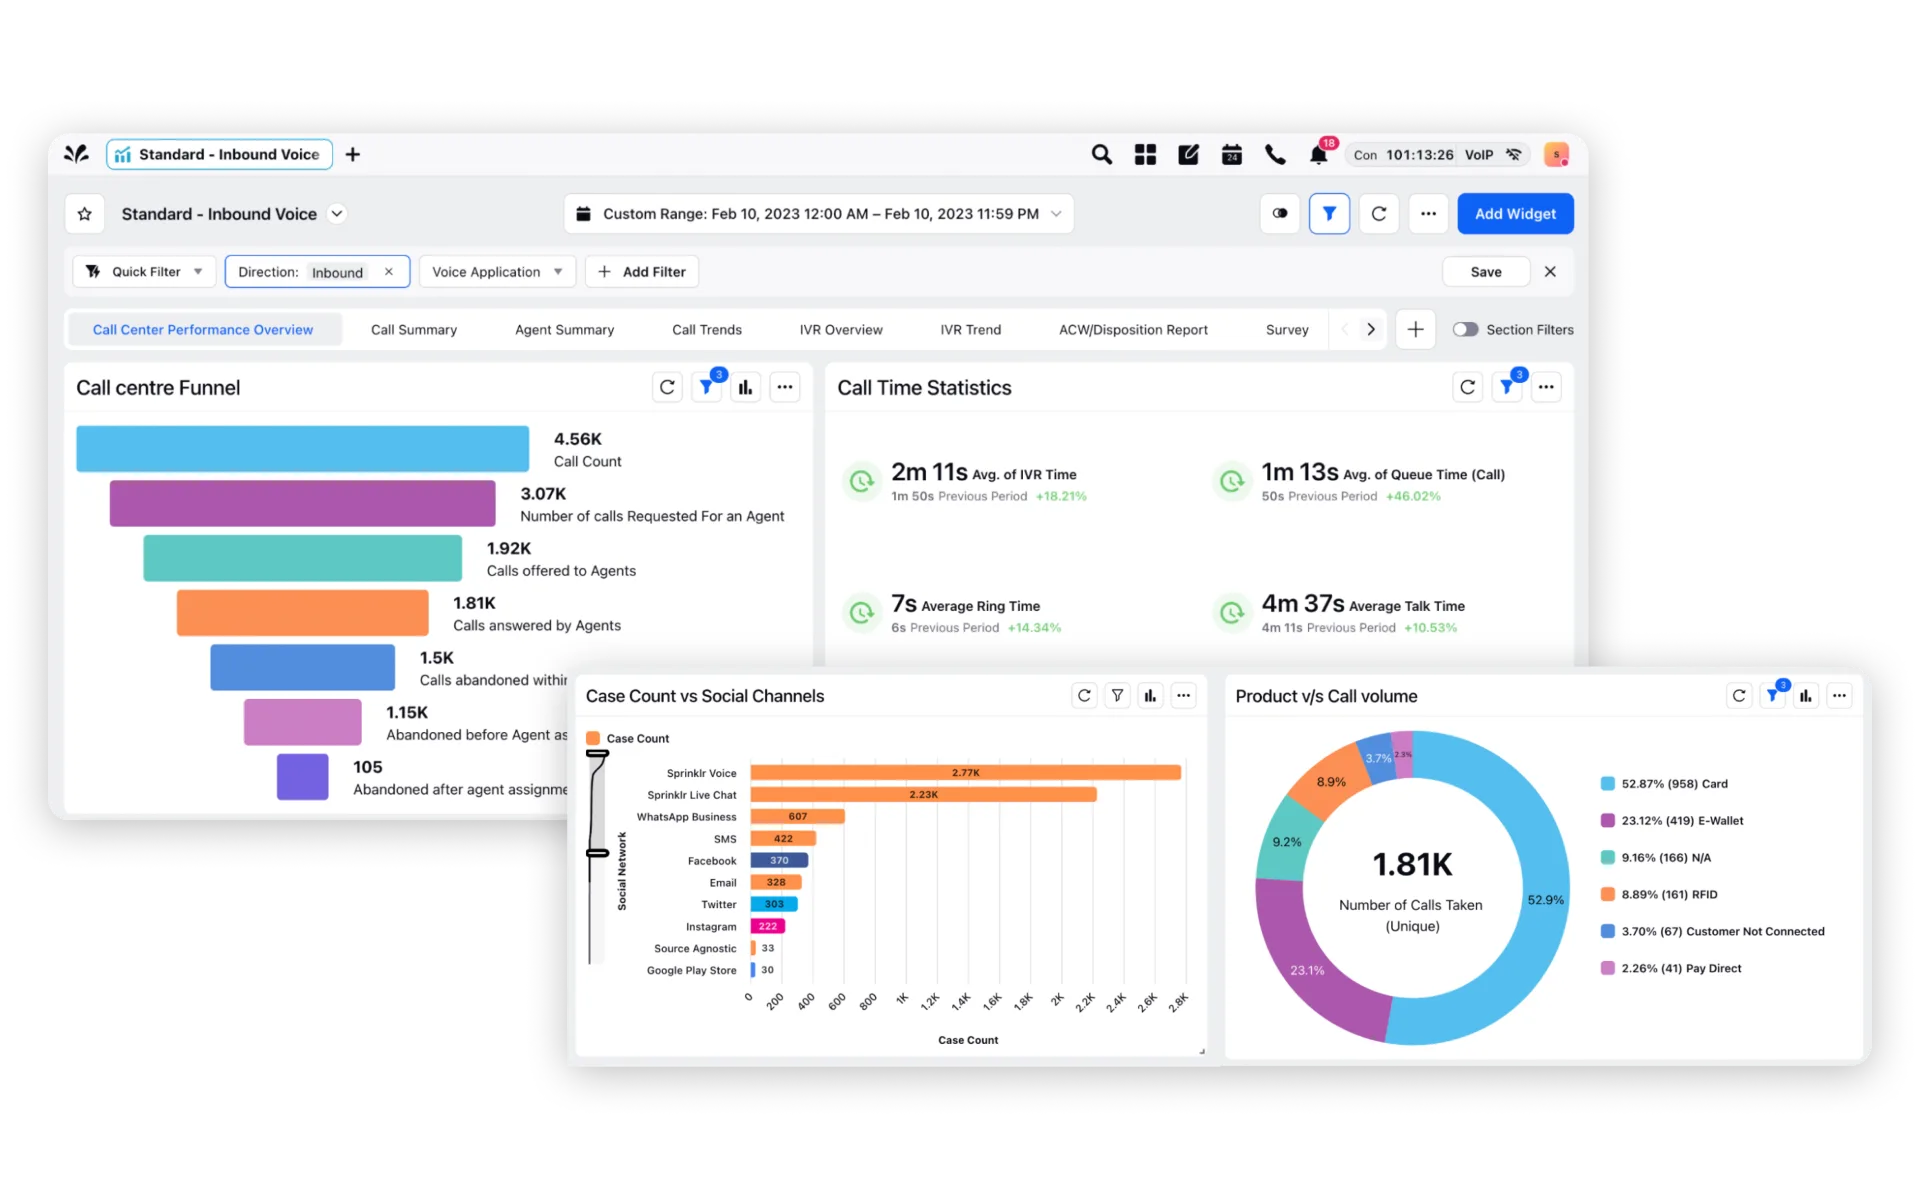
Sprinklr’s analytics & reporting tool provides a single point of truth for conversational analytics and quality management – with AI-powered, real-time insights on agent quality scores, products, processes and performance. Track end-to-end customer journeys and analyze interaction data in real time. Additionally, create multi-level dashboards to monitor queues, locations, agents and interactions. This allows tracking crucial business KPIs, team performance, daily targets and more.
Features
Real-time monitoring: Obtain valuable operational insights across different levels of your business, track Key Performance Indicators (KPIs), respond promptly to events, and focus on continuous, real-time enhancements.
Actionable dashboards: Create dashboards tailored to queues, locations, agents, and interactions for tracking critical business KPIs, team performance, and daily targets, respectively.
Conversational insights: Utilize AI-driven sentiment analysis to gain real-time insights into pivotal moments in customer conversations, allowing for effective handling of escalations.
Quality automation: Leverage industry-specific, AI-powered models to assess and gain insights into key Quality Assurance (QA) parameters. Use these insights to pinpoint areas for improvement and coaching opportunities.
DIY dashboards: Tailor dashboards using a comprehensive widget library, choosing from an extensive list of over 5000 metrics. Customize colors, layouts, and add annotations to suit your specific needs.
On-demand dashboards: Quickly share reports in various formats like Excel/CSV/PDF/PNG and schedule on-demand exports to S3/SFTP/Email paths.
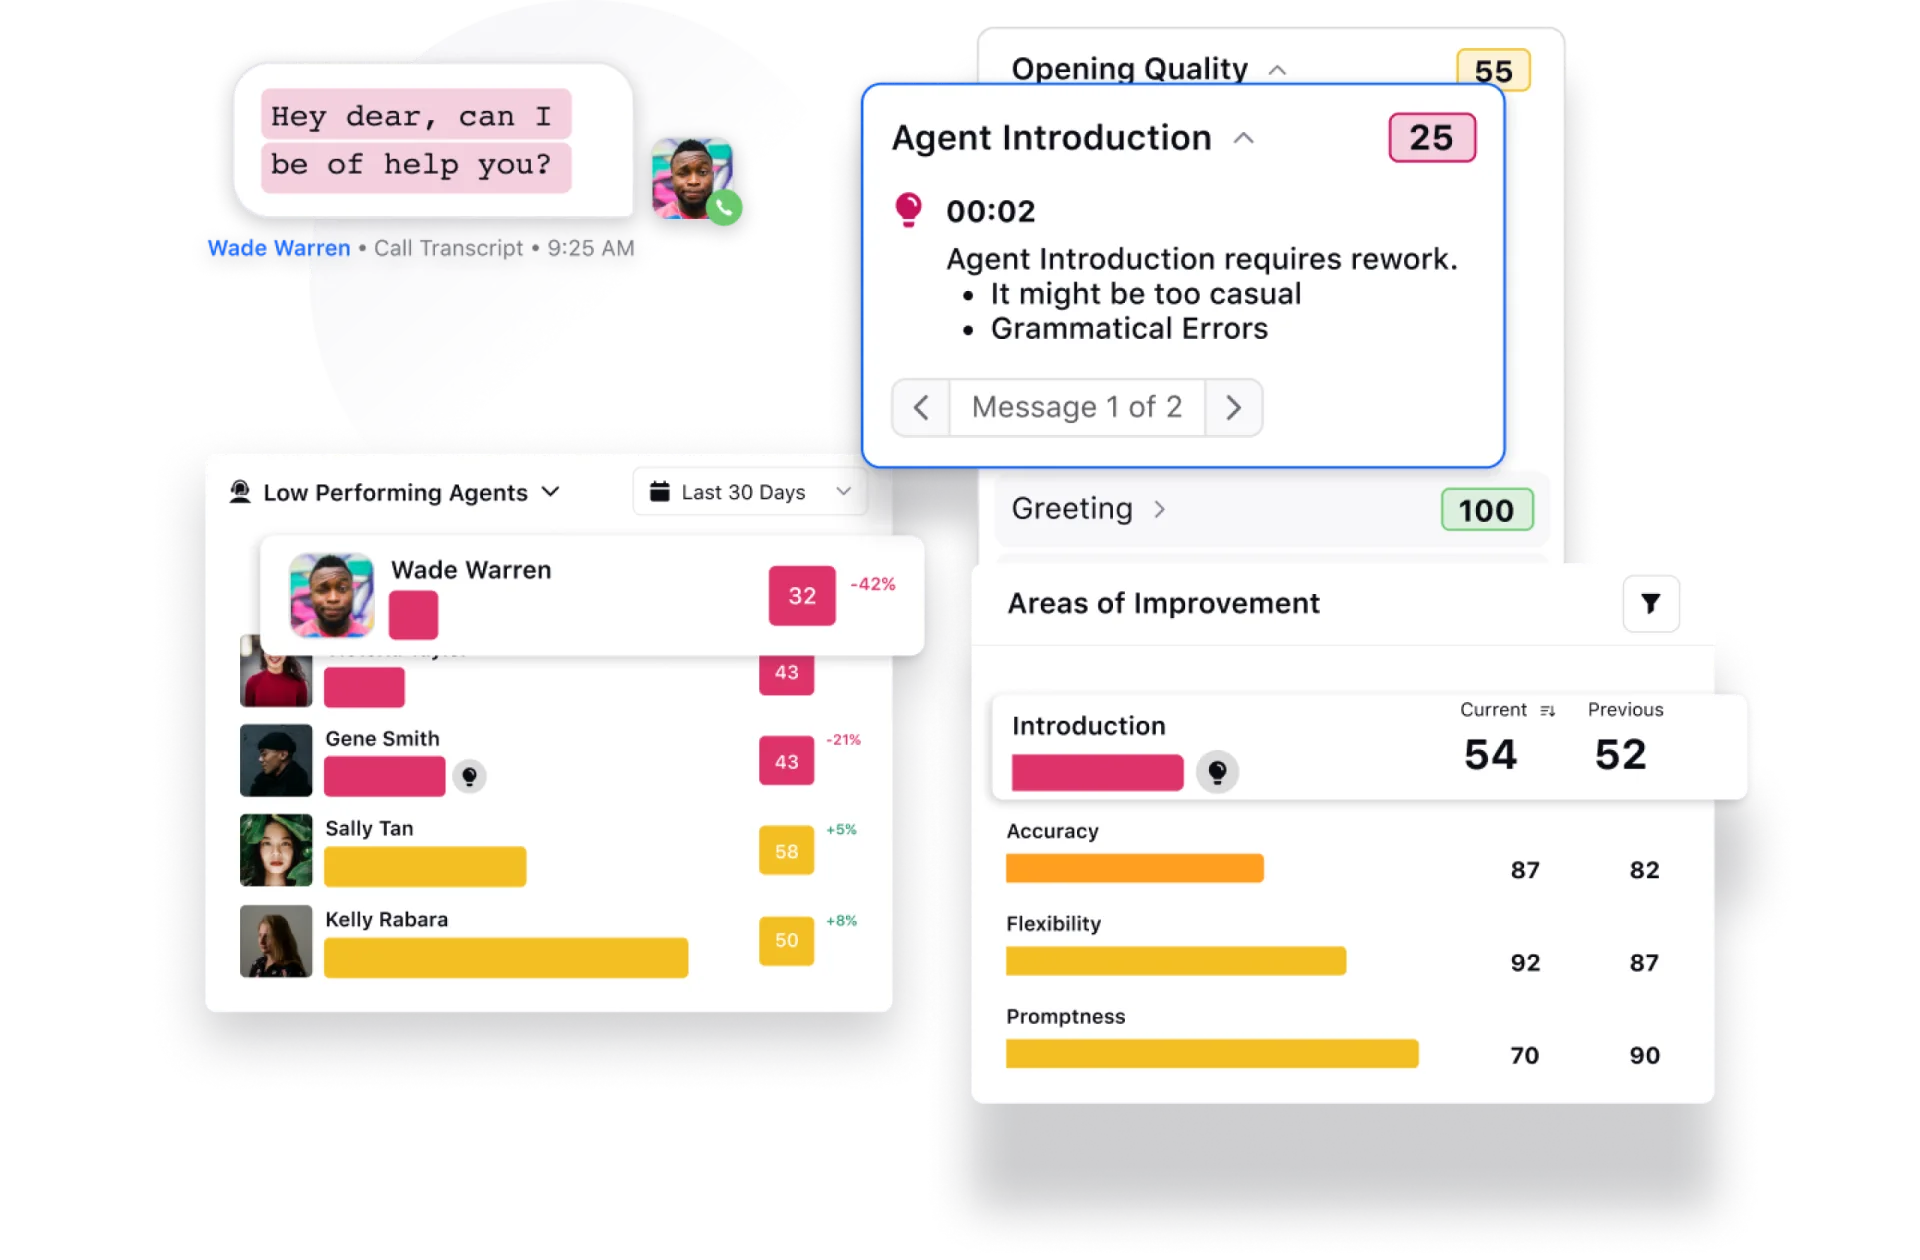
Quality management: Leverage the advanced capabilities of Sprinklr AI+ to evaluate all your daily conversations against over 30 quality and compliance benchmarks. These include opening and closing quality, introduction, active listening, empathy, and more. Additionally, gain insights into each agent's strengths and areas for enhancement through an AI-generated agent performance scorecard.
2. Zendesk
Zendesk offers a cloud-based contact center solution with omnichannel analytics and reporting capability. It integrates data from every channel, so you can measure how customers interact with your brand without losing the thread.
Features
Real-time and historical data
Pre-built dashboard for every channel
Customizable dashboard and charts
Note: According to some user reviews on Gartner peer review, the in-built reporting in Zendesk is half-baked and sometimes shows inaccurate data.
3. CloudTalk
CloudTalk is a cloud-based call center software that centralizes call data and lets users access agent performance and call statistics through real-time dashboards and analytics.
Features
Real-time dashboard
Agent reporting
Group reporting
Wallboard
Note: Some users have complained that CloudTalk's reporting software offers limited customization options and is sometimes very slow when generating complex reports.
4. Talkdesk
Talkdesk is a cloud-based contact center platform renowned for its ease of use and advanced capabilities. It revolutionizes customer interactions through voice, chat, and more, providing businesses with a powerful tool for exceptional customer support.
Features
Real-time dashboards
Interaction and sentiment analytics
Survey and feedback analytics
Note: According to users, Talkdesk's reporting software is complex, and it can be difficult to find the required reports sometimes.
5. Freshdesk
Freshdesk offers an intuitive, ready-to-use virtual phone system. You can easily set it up, manage daily operations and scale it up. It provides a unified platform for businesses to deliver exceptional customer service through email, phone, chat, and social media.
Features
Dashboards
Custom reports
Schedule reports
Note: Freshdesk’s reporting software does not integrate with many BI tools. Also, users have reported that generating complex reports on Freshdesk can be tiresome due to the slow and occasionally unresponsive interfaces.
Steps to improve contact center performance by efficient reporting
By following the below steps, you can harness the power of efficient reporting to drive tangible improvements in your contact center's performance and overall customer satisfaction levels.
1. Define clear objectives
Before delving into reporting, it's imperative to establish clear and specific objectives for your contact center. These objectives should align with your overall business goals and customer service strategy. Are you aiming to enhance customer satisfaction, increase first-call resolution rates, or optimize agent productivity? This clarity not only enables you to focus on collecting and analyzing data but also serves as a benchmark for measuring the effectiveness of your reporting initiatives.
2. Select relevant metrics
Two primary factors should guide your metric selection process: alignment with organizational goals and impact on the Customer Experience (CX).
Alignment with organizational goals: Each metric you choose should directly contribute to attaining your business objectives. For example, if your overarching goal is to increase customer loyalty, metrics related to customer satisfaction scores and Net Promoter Scores (NPS) become crucial indicators.
Impact on CX: Consider how each metric influences the customer's experience. Metrics that directly impact CX should be prioritized. For instance, first-call resolution and average handling time directly affect how customers perceive the efficiency and effectiveness of your service.
3. Implement advanced reporting tools
Utilize robust reporting software or tools to process and present data in a comprehensible and actionable format. Ensure these tools can generate both real-time and historical reports. In addition, it should be able to deliver persona-specific views and reports. Agent reports vary vastly from supervisor reports since their KPIs and focus areas differ. Likewise, it should allow custom as well as curated reports that are easily exportable in varied formats.
4. Automate data collection
Streamline data collection from various contact center systems, such as automatic call distribution, CRM, IVR and workforce management. Automation reduces manual efforts and minimizes errors.
5. Segment data for deeper insights
Break down data by criteria such as agent, team, time of day or customer segment. This granular approach helps pinpoint specific areas needing attention.
6. Implement real-time monitoring
Integrate real-time reporting capabilities to manage escalation promptly and efficiently. This ensures that corrective actions can be taken immediately to prevent further escalations.
7. Benchmark against industry standards
Compare your contact center's performance against industry benchmarks or best practices. This provides context and helps set realistic performance targets.
8. Implement agent training and coaching
Use reporting insights to identify areas where agents may need additional training or coaching. Provide targeted support to enhance their skills and knowledge. Share relevant reports with agents to foster a culture of accountability. Encourage them to take ownership of their performance and seek continuous improvement.
9. Leverage feedback loops
Use reporting to establish feedback loops with agents and customers. This helps gather valuable insights for process improvement and product/service enhancements.
10. Regularly review and adjust strategies
Continuously assess the effectiveness of your strategies based on reporting feedback. Adjust your approach as needed to address evolving customer needs and business goals.
How can Sprinklr simplify reporting for you?
Contact center reporting offers invaluable insights for enhancing customer satisfaction and operational effectiveness, empowering you to make informed business decisions and optimize your return on investment.
Harnessing the advanced capabilities of Sprinklr Service, driven by best-in-class AI technology, you can gain profound insights from your business data.
Through real-time access to agent and customer behavior, advanced conversational analysis, and comprehensive dashboards for agents and supervisors, your customer service teams can thrive with holistic insights and consistently deliver swift and effective resolutions, fostering lasting satisfaction and loyalty among your valued customers.
Curious to know how it works?
Book a demo with our experts or Take a 30-day Free Trial today!
Frequently Asked Questions
related products
Thank you for contacting us.
A Sprinklr representative will be in touch with you shortly.
Contact us today, and we'll create a customized proposal that addresses your unique business needs.
Request a Demo
Welcome Back,
No need to fill out any forms — you're all set.


