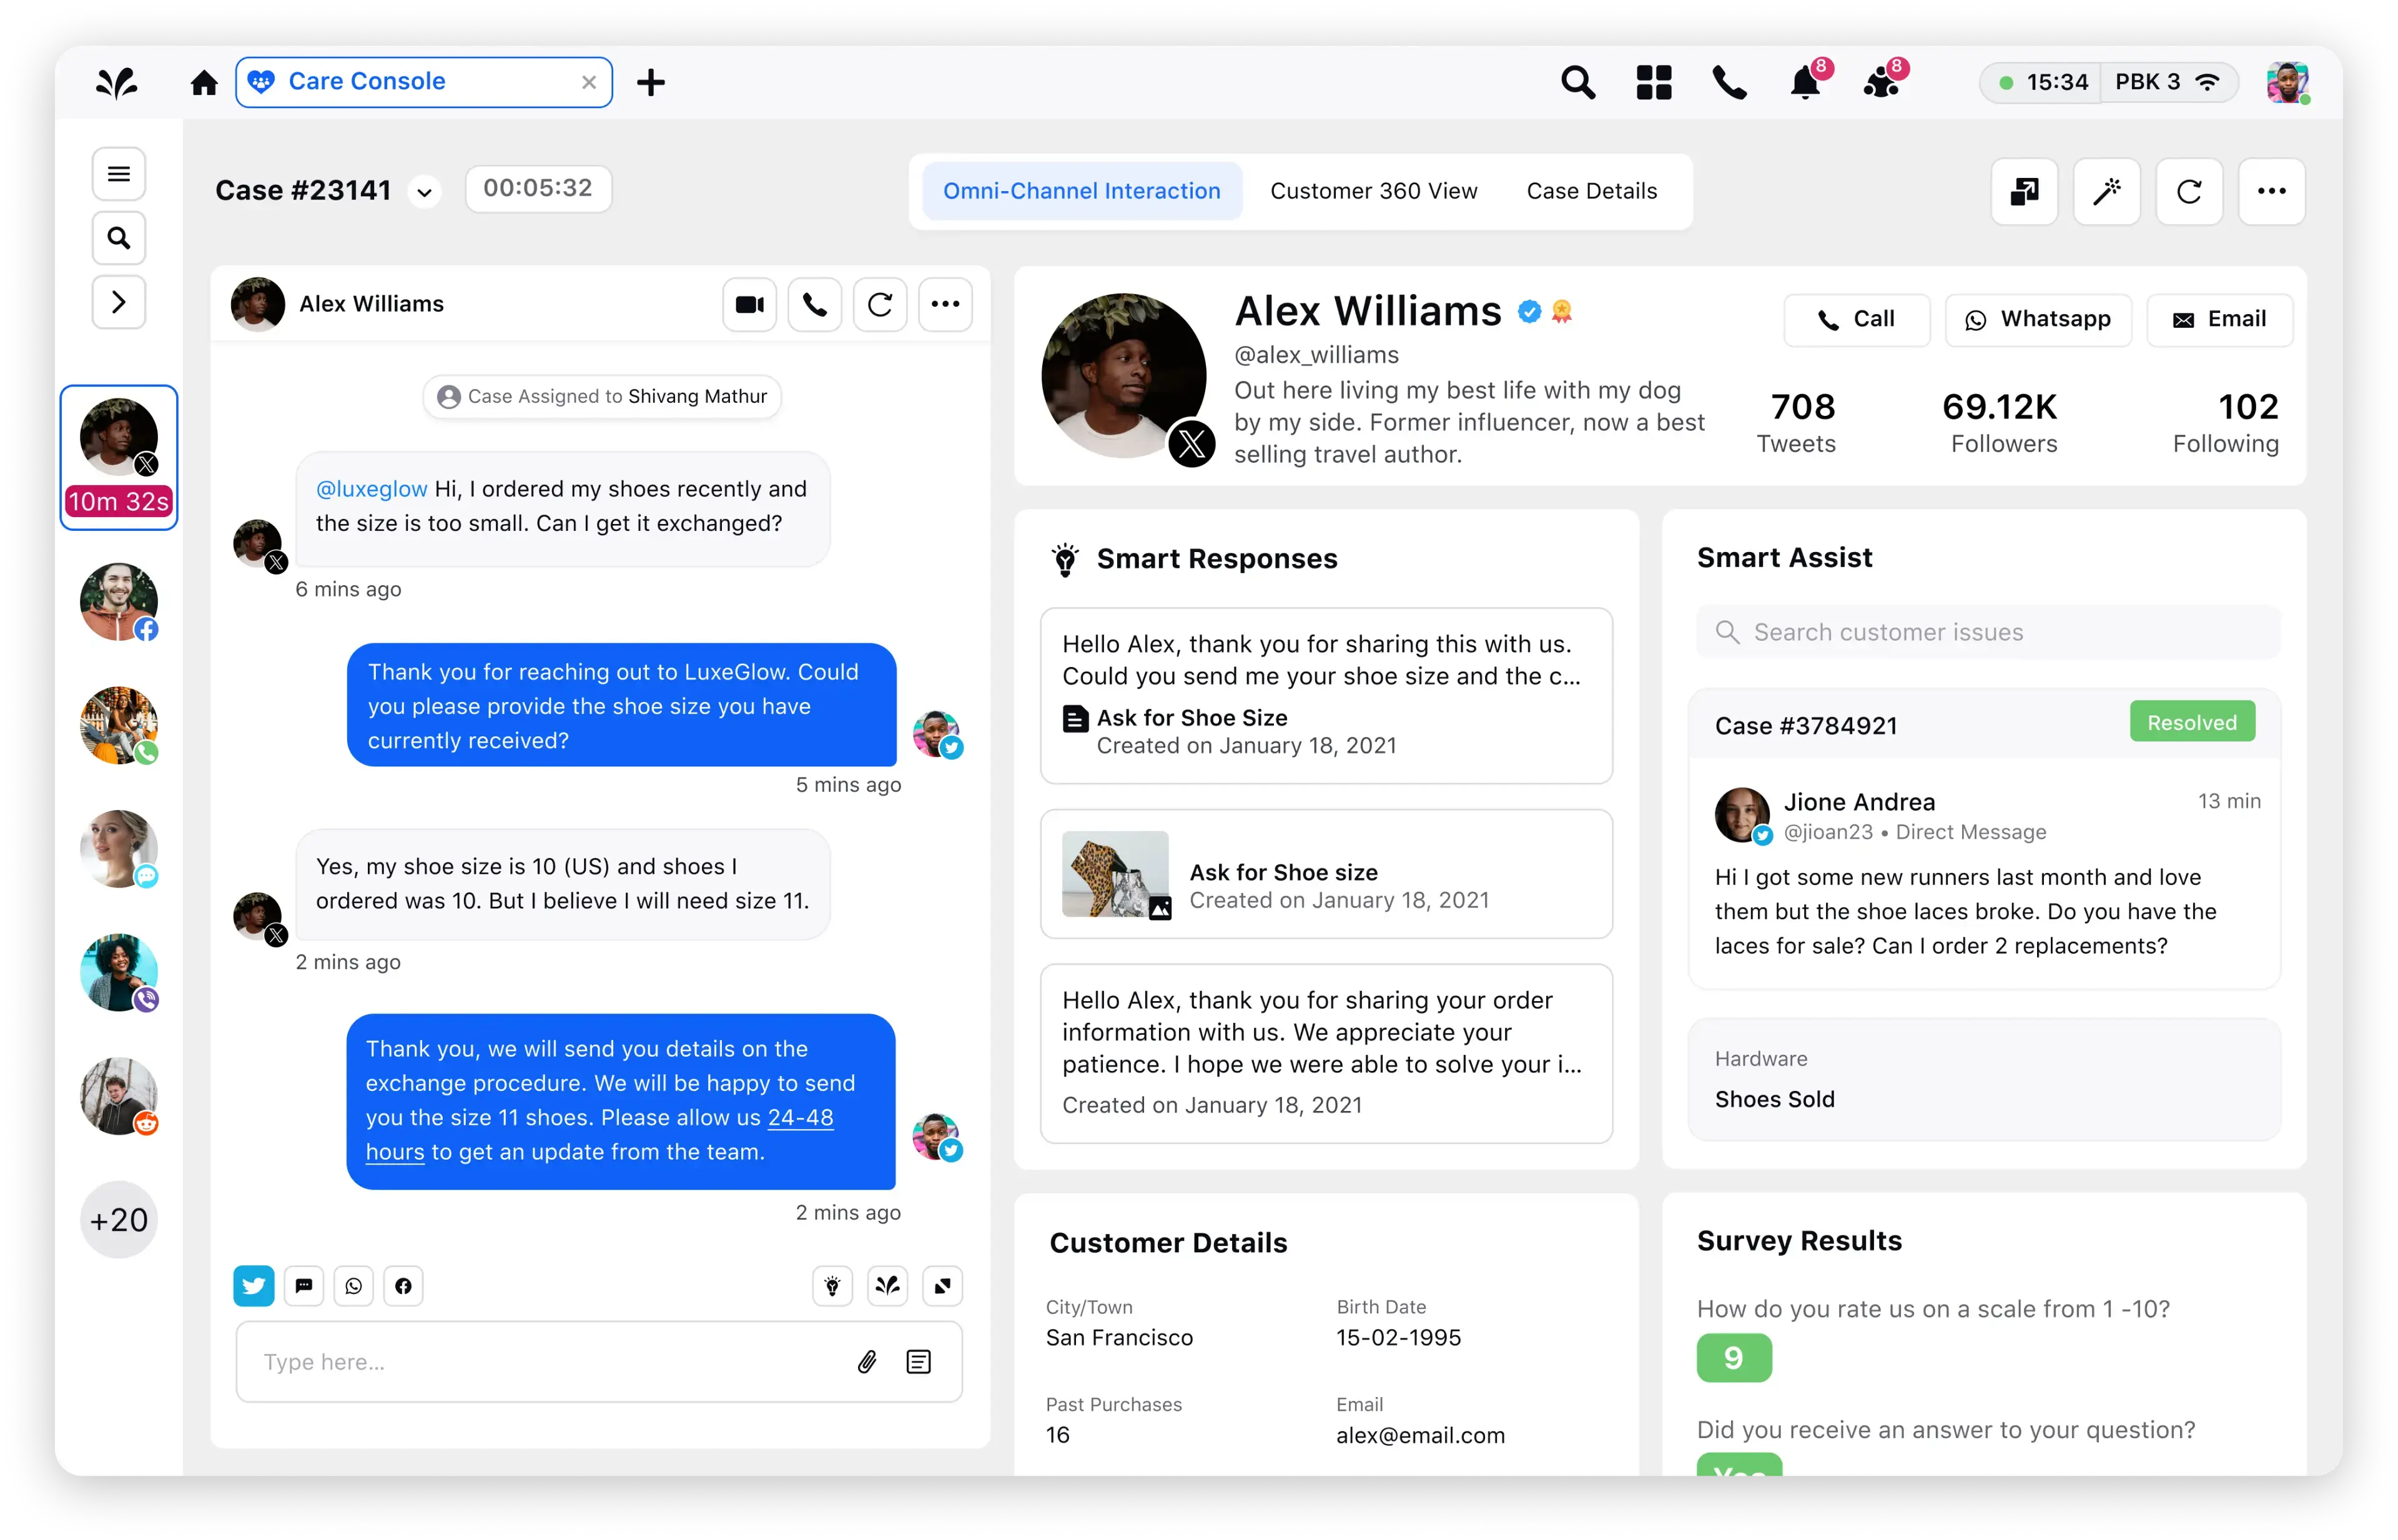
The next generation of CCaaS is here
Digital-first customer service, enterprise-scale voice support. Redefine customer service with an AI-powered platform that unifies voice, digital and social channels. Power channel-less interactions and seamless resolution no matter the channel of contact.

Top 17 Contact Center Metrics to Monitor in 2024
While the contemporary role of contact center channels is undeniably critical in delivering exceptional customer service, it's imperative to recognize that accessibility alone doesn't guarantee a positive customer experience.
Today, businesses invest substantial amounts in streamlining and digitizing customer service operations. However, the true measure of success lies in a select few contact center metrics. These metrics determine the worth of your investments and offer a comprehensive view of your customer service initiatives, shedding light on both progress and potential bottlenecks.
In this blog, learn everything about contact center metrics — uncover their definitions, formulas, interpretations and benchmarks. Furthermore, gain actionable insights on how to leverage these metrics in 2024 for optimal results.
What are contact center metrics?
Contact center metrics refer to the quantitative measurements and key performance indicators (KPIs) used to assess the effectiveness and efficiency of a contact center. They provide a data-driven understanding of the quality of customer interactions and the overall health of your customer service function.
Primarily utilized by customer service managers and contact center managers, stakeholders leverage contact center metrics to make informed choices regarding resource allocation, process improvements and overall customer service strategy formulation.
Why are contact center performance metrics important?
In the contemporary business landscape, prioritizing customer experience is a shared goal for companies, predominantly facilitated through their contact centers. The question that naturally arises is, how can you gauge your performance relative to your competitors?
This is where contact center metrics come into play, holding importance both strategically and operationally. Let's explore how they contribute.
- Strategic decision-making: Contact center performance metrics offer more than just numbers; they provide actionable data for decision-makers. For example, a deep dive into average handle time (AHT) patterns becomes a strategic tool for effective workforce management.
- Optimizing resource allocation: Insights into call volumes and peak hours empower contact centers to staff judiciously, avoiding resource underutilization or overload. This ensures a finely tuned workforce ready to meet customer demands.
- Identifying bottlenecks: A sudden spike in call abandonment rate can be a red flag, signaling potential issues in call routing or excessive wait times. Contact center metrics promptly reveal opportunities for customer service workflow enhancement and improved customer experiences by addressing these bottlenecks.
- Measuring operational efficiency: Contact center metrics provide a comprehensive view of daily contact center operations, offering clear insights into key metrics such as service level and response time. These metrics serve as valuable guides for continuous process refinement, ultimately contributing to heightened operational efficiency.
- Benchmarking against industry standards: Staying ahead in the industry requires a keen awareness of your position. Contact center metrics serve as the means to benchmark against industry standards, offering you the clarity needed to identify improvement areas and foster innovation.
17 contact center metrics to track in 2024 (+Formula)
Contact center metrics can be grouped into three broad types based on the actionable business and customer insights they provide. From the different types of contact center metrics, let’s drill each of them down to what insights they stand for and how they affect the customer experience and organizational goals.
Customer experience (CX) metrics
Customer experience metrics, or CX metrics, are a category of contact center metrics specifically designed to gauge the quality of interactions and overall satisfaction customers have with a company's products, services or support. Here are the top CX metrics for contact centers:
Net promoter score (NPS)
Net promoter score measures the likelihood of customers recommending a company's products or services to others.
How to calculate:
NPS is calculated by subtracting the percentage of detractors (customers with a low likelihood to recommend) from the percentage of promoters (customers with a high likelihood to recommend).
Interpretation: A positive NPS indicates satisfied and loyal customers.
Learn More: How to Improve the Net Promoter Score of Your Brand
Customer satisfaction score (CSAT)
CSAT measures customer satisfaction with a specific interaction. Customers are commonly asked to rate their satisfaction level on a customer satisfaction survey, on a scale ranging from 1 to an agreed maximum, usually 5 or 10. For instance:
"On a 5-point scale from 'very unsatisfied' to 'very satisfied,' how would you rate your experience with the quality of product delivery?"
How to calculate:
Interpretation: A higher CSAT score indicates higher satisfaction.
Read More: How to Measure Customer Satisfaction Without Surveys
Customer effort score
Customer effort score (CES) is the amount of time or ease with which a customer can find appropriate support information and get issues resolved. The metrics to measure CES can vary for different companies, but ironing out the customer journey is the difference between low and high effort.
How to calculate:
There are multiple methods to collect feedback from users, such as the 1-10 scale, Likert scale and the Emoji scale, and the formula to calculate CES from them varies based on the method used.
- 1-10 scale: The user is posed with a direct question such as “How easy was it to get your issue(s) resolved?” with a response range from 1 to 10, and any responses above 7 are considered a good standard.
- Likert scale: This system has a standard 5- or 7-response template, where users can answer anything between “Strongly agree” and “Strongly disagree.”
- Emoji scale: This method mostly uses three emojis — happy, neutral and sad — to gauge customer satisfaction and the average score is calculated based on the percentage of happy and sad emoji faces recorded.
Interpretation: CES responses should be segmented based on various factors such as customer demographics, product/service usage, or interaction channels. This segmentation helps identify specific areas where customers may be experiencing higher levels of effort.
Additionally, tracking CES scores over time allows you to assess trends and monitor changes, enabling you to gauge the effectiveness of implemented initiatives or improvements. Comparing scores before and after implementing changes provides valuable insights into the impact of your efforts on reducing customer effort.
First contact resolution (FCR)
First contact resolution is the percentage of issues resolved during the first interaction.
How to calculate:
Interpretation: Higher FCR indicates efficient problem-solving, reducing customer effort and repeat calls. Always aim for an FCR of 70% or higher.
Average speed of answer (ASA)
The average speed of answer measures the average time it takes for your customer service team to answer a call after it enters the queue.
How to calculate:
Interpretation: Lower ASA indicates faster customer response times, improving customer experience and reducing abandonment rates. An average speed of answer of 20 seconds or less is highly desirable.
Average hold time
The average hold time refers to the average duration a customer spends on hold before speaking to a contact center agent.
How to calculate:
Interpretation: A low average hold time is generally considered positive. It indicates that customers spend minimal time waiting for assistance.
Call abandonment rate
The call abandonment rate is the percentage of callers that hang up the phone before they’re connected with a live agent.
How to calculate:
Method 1:
Method 2:
Interpretation: A consistently high call abandonment rate can be concerning. It may indicate challenges in managing call volumes, leading to frustrated customers who end the call prematurely.
Operational efficiency metrics
Operational efficiency metrics in a contact center encompass a range of quantitative metrics that evaluate the efficiency and effectiveness of key operational processes. Here are the top operational efficiency metrics for contact centers:
IVR containment rate
The IVR containment rate measures the proportion of customer interactions resolved entirely within the IVR system.
How to calculate:
Interpretation: A higher IVR containment rate indicates successful utilization of the IVR system to address customer needs without agent involvement.
Reduce your call abandonment rate with Conversational IVR
Conversational IVR offers self-service options that enable callers to resolve simple inquiries or complete transactions without speaking to a live agent. Empowering customers to help themselves, it supports natural language inputs instead of keyboard inputs of traditional IVRs. This way, it reduces call volumes and wait times, leading to lower abandonment rates.
Check out Sprinklr’s advanced conversational IVR solution to optimize incoming call handling and contact center metrics.
Average first response time
Average first response time or FRT is the time to reply to a customer query. Chatbots and IVR are great ways to automate first-response and collect customer context even before an agent picks up a request.
How to calculate:
Interpretation: A low average first response time is generally favorable. It indicates that the contact center is responsive to customer inquiries, providing timely initial acknowledgment.
Editor’s Pick: 5 Ways to Improve Customer Response Time with AI
Average handle time (AHT)
Average handle time or AHT, shows how much time your agents spend on a support ticket across contact center channels.
How to calculate:
Interpretation: While lower AHT is desirable, it’s important to prioritize first-call resolution over rushing interactions.
Good to know: Modern agent console software consolidates multiple channels onto a single screen, reducing average handle time by 30%. Powered by Sprinklr AI+, it offers real-time conversation monitoring, aiding agents with prompts, recommendations and alerts for enhanced efficiency and customer satisfaction.
Resolution rate
The resolution rate is the number of tickets successfully closed over a defined timeline.
How to calculate:
Interpretation: A higher resolution rate suggests that many customer concerns are resolved successfully and on time.
Service level agreement (SLA) adherence
Service level agreement (SLA), often calculated in percentage, is the number of calls answered within the agreed-upon time frame.
How to calculate:
Interpretation: Meeting SLA commitments ensures efficient call handling and reduces customer wait times.
Agent occupancy rate
Agent occupancy rate denotes the percentage of time agents are engaged in call-handling activities.
How to calculate:
Interpretation: Aim for a balance between high occupancy (efficient resource utilization) and breaks/administrative time for agent well-being and productivity.
Learn more about call center shrinkage.
Escalation rate
Escalations are customers’ way of signaling that they are unhappy with the support provided. This could either be a result of delayed support or inadequate resolution.
How to calculate:
Interpretation: A higher escalation rate may indicate challenges in resolving issues at the frontline, requiring intervention from higher-tier support or management.
Average call transfer rate
The average call transfer rate is a crucial metric that signifies the frequency of calls being transferred from one agent to another during a support request. While call transfers may be necessary for handling complex situations, they can create a less-than-ideal customer experience.
How to calculate:
Interpretation: A lower call transfer rate is often considered favorable. It may indicate that agents can efficiently handle various issues, resulting in fewer transfers and a smoother customer experience. Learn how call transfer works with Sprinklr.
Cost management metrics
Cost management metrics are essential for monitoring and optimizing operational expenses. Here are some key cost management metrics:
Cost per call
Cost per call is the average cost of handling a single call in your contact center.
How to calculate:
💡Optimization tip: To reduce the cost per call, leveraging trained contact center agents proves crucial. Their efficiency translates into quicker issue resolution. Additionally, incorporating customer self-service options empowers customers to address issues independently, eliminating the need for agent intervention. This dual approach optimizes workforce management, resulting in substantial savings on carrier costs.
Interpretation: Lower cost per call suggests efficient resource utilization and cost-effective operations.
Agent turnover rate
It’s the percentage of agents who leave your contact center within a given period.
How to calculate:
💡 Pro Tip:
Consider industry benchmarks and use contact center dashboards to track and present your metrics for insightful decision-making effectively.
Interpretation: Low agent turnover rates are desirable. They indicate a stable and engaged workforce, crucial for maintaining consistent service quality and productivity.
Power up contact center performance with Sprinklr Service
Understanding and optimizing the end-to-end customer journey is paramount in the fast-paced customer service landscape. Yet, many businesses struggle to harness the wealth of customer interaction data, leading to missed opportunities and suboptimal performance.
Enter Sprinklr analytics and reporting software – your comprehensive solution to drive positive business outcomes and empower your teams with actionable insights. With Sprinklr, you can seamlessly monitor the entire customer journey, from initial interaction to resolution, using multi-level drill-downs that provide unparalleled visibility into every touchpoint.
Talk to our experts to discover how Sprinklr can help you in data visualization and customizable report generation for different stakeholders.

Frequently Asked Questions
Call center metrics primarily focus on voice interactions, while contact center metrics encompass a broader range, including various channels like chat and email. The latter provides a more comprehensive view of customer interactions across multiple touchpoints.
Real-time analytics in contact centers enhance decision-making by providing instant insights into customer interactions, agent performance and overall operational efficiency. This proactive approach enables immediate adjustments to optimize the customer experience.
Ensure data accuracy in contact center metrics by implementing robust data validation processes, regularly auditing data sources and leveraging advanced analytics tools. Establish data quality standards, conduct regular training and utilize reliable software solutions to maintain accuracy and reliability.


