The AI-native platform for global campaign management
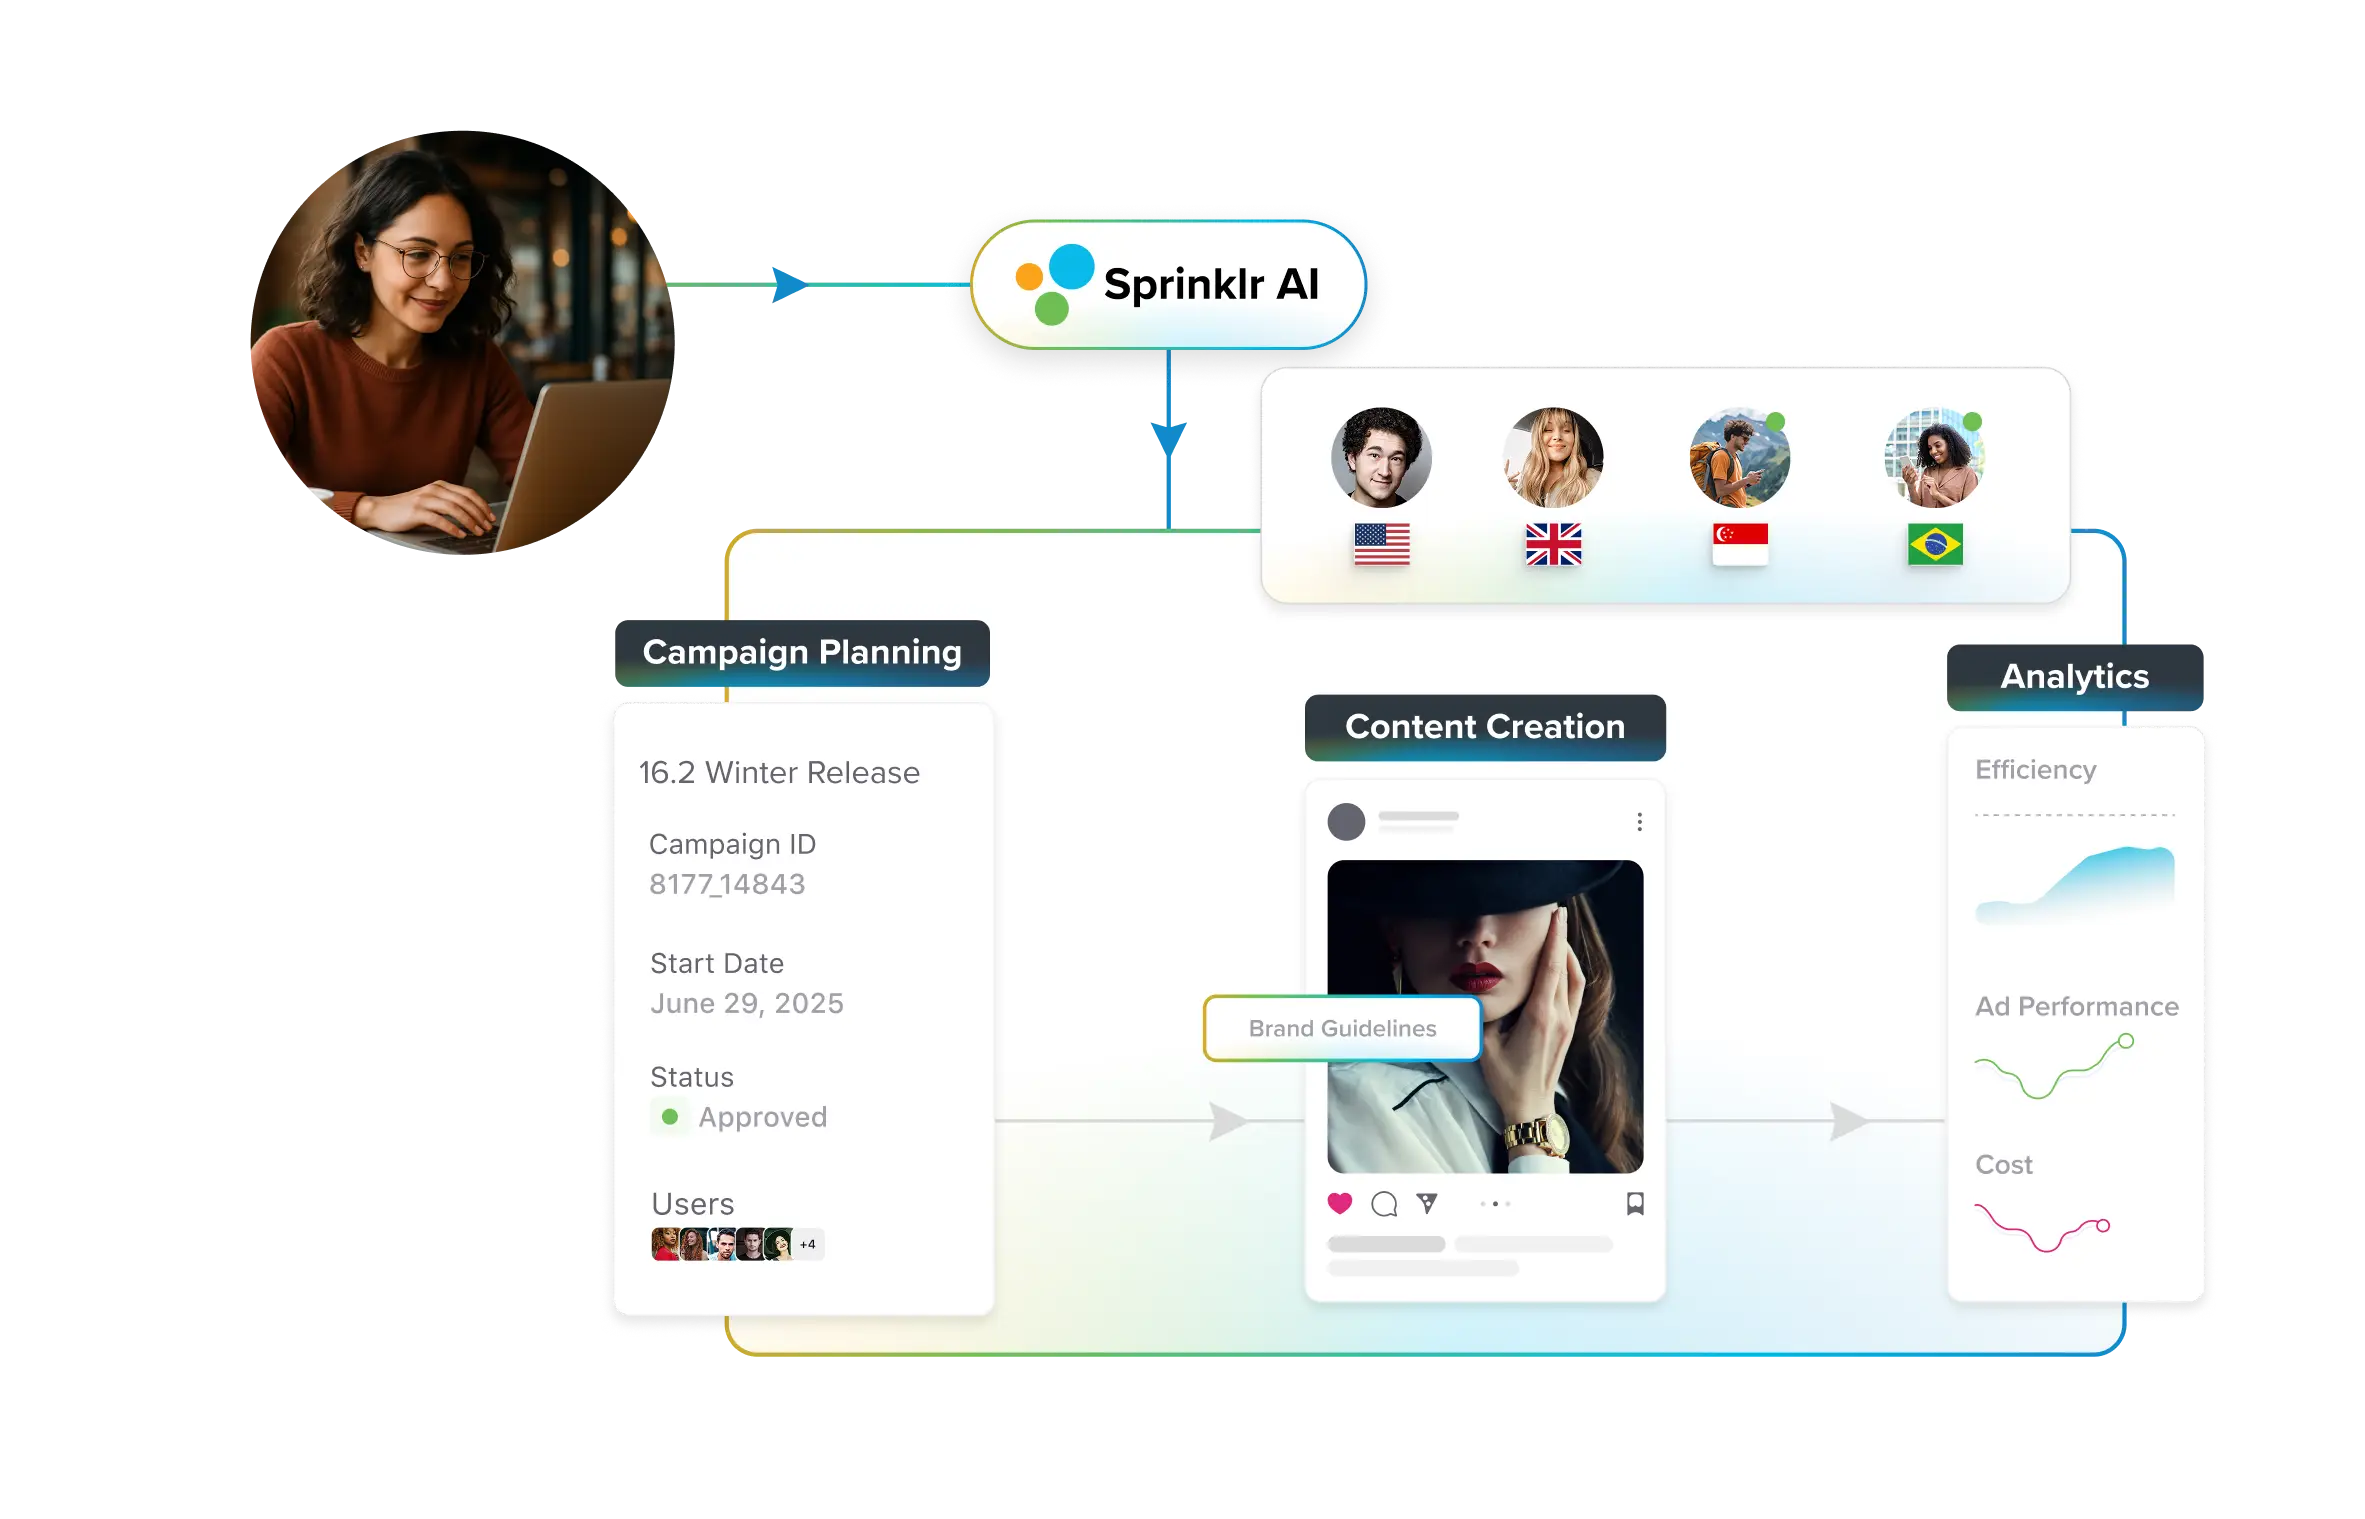
Sprinklr Marketing unifies campaign planning, content creation, publishing and analytics across global teams — all elevated by AI. Accelerate go-to-market, boost performance and enforce brand governance at scale.


What Is Campaign Analytics? Metrics, Tips, & Tools


Your campaigns — marketing or otherwise — are only as successful as the lessons you took away from the past campaigns.
Without data attesting to your wins and losses, attributing ROI or drawing business insights from campaigns becomes ambiguous and unreliable. This is where campaign analytics come into the picture.
If you have decided to double down on your campaign analytics and draw quantifiable insights from your marketing efforts, you’re in the right place.
After reading this post, you’ll know what to expect from your campaign analytics, what metrics to track, tools that can help you achieve your goals, and some bonus tips.
What is campaign analytics?
Your marketing or any outreach campaigns — paid or organic — generate data around performance, audience, engagement, conversion, and customers.
Campaign analytics is the system that captures campaign data from one or multiple channels and presents it in a structured format for analysis and attribution.
Metrics are the fundamental building blocks of campaign analytics which is why the term analytics is often associated with a dashboard of metrics and attributions.
Campaign analysis digs into how your efforts measure up against your objectives and KPIs. The natural next step is competitive benchmarking which adds perspective by comparing your results to the wider market.
Together, they help you spot internal gaps, understand leads, lags, and opportunities, and finally prioritize improvements based on industry and competitor standards.
Where to find campaign analytics
Your marketing and advertising platforms come with native campaign analytics. For example, Meta Ads Manager is the native analytics for ad campaigns run on Meta-owned channels like Facebook, Instagram, WhatsApp, and Messenger.
Other platforms like Google and LinkedIn have similar built-in capabilities.
However, campaign analytics native to a particular platform is always limited to insights for that specific channel where the data originates. You may have multiple campaigns running on different channels.
In such cases, you need a campaign analytics platform to pull data from different campaigns and present them in dashboards for reporting, governance, and insights.
✨ See how centralizing paid social campaign analytics and automated reporting helped AAA Alliance Club (ACA) save 1,560 days of work hours and surface insights it rarely saw before![NN1]
Difference between campaign analytics and campaign analysis
Given the homophonic nature of the two phrases, it’s easy to miss out on the important difference between campaign analytics and analysis. Here’s a quick overview:
Aspects | Campaign analytics | Campaign analysis |
Definition | It is the measurement and collection of data related to a marketing campaign's performance. | It involves the interpretation and evaluation of the campaign data. |
Function | It answers the "what" of the campaigns through raw numbers, metrics, and data points gathered from various platforms. | It inquires and answers the "why" and "so what" of the campaign by analyzing the trends, insights, successes, and failures. |
Goal | Quantify the raw data into measurable units | Attribute the data to tangible outcomes and inform future strategies |
Examples | Clicks, impressions, conversion rate, cost per click, and open rate are parts of campaign analytics | Answers to specific questions behind the metrics, such as why clicks are more but conversion rates are low, are part of campaign analysis |
Key insights you can drive from campaign analytics
Here are some key insights that you can derive from campaign analytics:
Strategic insights
- Target audience - Which audience segments are most responsive to specific campaigns?
- Channel effectiveness - Which channels (e.g., social media, email, search ads) deliver the best results in terms of engagement, conversions, and reach?
- Messaging and creative resonance - Which ad copy, visuals, and content perform best, and what resonates with the target audience?
- Customer journey insights - How do customers interact with the campaign across different touchpoints?
ROI insights
- Cost per acquisition (CPA) - Cost of acquiring a new customer through each campaign
- Return on ad spend (ROAS) - Revenue generated for every dollar spent on paid campaigns
- Customer lifetime value (CLTV) - Long-term value and the campaign's contribution to overall profitability
- Channel ROI - Which channels offer the highest return on investment, guiding budget allocation for future campaigns
- Budget allocation optimization - Data-driven decisions about where to invest the marketing budget for maximum impact
Competitive insights
NOTE: You need a competitive intelligence and benchmarking platform like Sprinklr Insights for these insights. ✨ Learn what is competitive benchmarking here.
- Social performance - Rank brand performance against the competition on several social media metrics
- Content strategy - Understand how competitor content resonates and use the information to improve your content marketing strategy
- Executive strategy - Understand the sentiment and engagement of brand leaders, identify top executive posts, visualize the social accounts of executive contributions
- Influencer strategy - Monitor competitors’ influencer performances and discover new opportunities to improve those partnerships
- Customer care strategy - Understand how brands interact with their audiences and know when, where, and how competitors reply on owned channels
- Paid strategy - With AI-powered machine-learning models, you can determine if competitor posts are likely to be paid or organic
- Crisis management - Monitor content for current trends, brand sentiment, and brand followers while also gathering insights into potential crises of other brands and competitors.
⚡Bring all your campaign analytics to 1 dashboard!
Pull campaign data from all your social and digital channels — paid or organic — and slice and dice it in one dashboard with Sprinklr’s marketing analytics platform.

✅ Centralize data from several channels, paid or organic
✅ Create custom taxonomy for goal-oriented attribution
✅ Get accurate AI-powered insights to boost ROI
Types of campaign analytics and metrics: Focus areas
Campaign analytics is an umbrella phrase for a collection of metrics captured and presented for your analysis.
It can differ depending on the campaign type and focus on aspects of the campaign’s performance, such as:
- Research and awareness (impressions, traffic, brand mentions)
- Engagement (click-through rate, bounce rate)
- Conversation (conversion rate, lead generation, return on ad spend, or ROAS)
- Website/app (user behavior flow, campaign landing page performance)
- Cost and ROI (campaign spend, cost per click)
- Audience (demographic, device types, interests)
✨ Check this article on metrics specific to social media
In most cases, you will follow analytics relevant to your campaign’s focus, while other metrics will be irrelevant.
Below is a list of the most popular campaigns and the corresponding metrics their analytics will capture:
1. Paid ads or performance marketing (search, social, display)
Paid ads involve running campaigns on search engines like Google, social media channels like Instagram, video platforms like YouTube, and other online properties such as websites, apps, and online platforms.
Display ads and native ads are other subsets of paid ads.
📊 Paid campaign metrics | 📢 What they inform |
Click-through rate (CTR) | Percentage of people who clicked after seeing your ads |
Cost-per-click (CPC) | Average price you pay for each potential customer who clicks on your ads |
Conversion rate | Percentage of ad clicks that resulted in a desired business outcome |
Return on ad spend (RoAS) | Revenue generated for every dollar you invest in your advertising campaigns |
Impression | Number of timesyour ad was displayed to a potential customer |
Cost per acquisition | Average cost to acquire a new customer through paid ads |
Lifetime value (LV) | Total revenue a single customer is expected to generate throughout their relationship with your business |
Cost per impression (CPI) or Cost per thousand impression (CPM) | The cost you pay for every time or every thousand times your ad is displayed to potential customers |
Cost per lead | How much it costs you to acquire a potential customer who has shown interest in your offering |
Cost per conversion | The total cost incurred to achieve a specific business goal from your campaign |
👉 Related: All you need to know about paid search
2. Email marketing campaigns
Email is one of the most popular forms of marketing and sales campaigns used by all categories of businesses.
This involves sending emails with different calls to actions designed to drive specific business outcomes such as purchases, demo bookings, subscriptions, or simply brand awareness.
📊 Email campaign metrics | 📢 What they inform |
Delivery rate | Percentage of sent emails that successfully reached recipients' inboxes |
Bounce rate | Percentage of sent emails that didn’t reach the intended recipient |
Open rate | Percentage of delivered emails opened by recipients |
Click-through rate | Percentage of recipients who clicked on a link within your email |
Conversion rate | Percentage of recipients who completed a desired action (e.g., purchase, sign-up) after clicking the email |
Unsubscribe rate | Percentage of recipients who opted out of future emails |
List growth rate | The rate at which your email list is expanding over time |
👉 Want some help? Most important email campaign analytics to track.
3. Content marketing campaigns
Content marketing campaigns involve creating blogs, videos, infographics, e-books, article series, podcasts, webinars, case studies, etc., to achieve business outcomes.
Goals could look like demand generation, brand awareness, and even leads. You can distribute such content through organic or paid means.
📊 Content marketing metrics | 📢 What they inform |
SERP ranking (by keywords) | Where your website appears in search engine results for specific keywords |
Traffic | Total number of visits your website receives from all sources |
SERP features | Your visibility through rich results like featured snippets or local business listings in search results |
Unique visitors | The number of distinct individuals who visited your website at a specific time |
Bounce rate | Percentage of visitors who leave your website after viewing only one page |
Time on page | Average duration visitors spend on a specific page of your website |
MQLs | Leads from your organic marketing efforts that have a higher likelihood of becoming paying customers |
👉 You may like: AI for content marketing: 3 Biggest advantages and 11 key tools
4. Affiliate marketing campaigns
In affiliate marketing, you agree to share revenue if a third party brings you business.
Businesses typically use specific affiliate properties or links to track the outcome and share the revenue as commission per closed deals.
📊 Affiliate marketing metrics | 📢 What they inform |
Click-through rate | Percentage of the clicks your affiliate link has received against the total times it was displayed |
Conversion rate | Percentage of users who completed a desired action through the affiliate link |
Average order value (AoV) | The average amount of dollars a prospect via an affiliate program spends on your business |
Cost per acquisition (CPA) | Total dollars spent to get a customer through your affiliate program |
Customer lifetime value (CLV) | Total amount you expect to earn from a single affiliate customer over the entire time they stay with you |
👉 You may need: 7 Best influencer marketing strategies to try
5. Public relations and media campaigns
PR and media campaigns involve partnering with media houses and PR agencies to create and distribute content about your brand to their established audience.
- Analytics for such campaigns can capture qualitative data such as brand awareness, share of voice, and word of mouth
- Quantitative data could include brand mentions, sentiment analysis, and potential reach, among others
📊 PR and media metrics | 📢 What they inform |
Media coverage and impressions | How often your brand is mentioned in media and the potential audience exposed |
Share of voice | Indicator of your brand's prominence in discussions compared to competitors |
Referral traffic | Website visitors arriving from your media and PR placements |
Potential reach | The total number of unique individuals who could view your message. It is based on estimations, like the number of unique visitors to a website where a press release was featured |
Social engagement | Number of people who interacted with your media assets on your partner’s social platforms |
👉 Related: Top PR KPIs and metrics to measure
6. Brand awareness campaigns
Brand awareness campaigns are strategic efforts that use different forms of content for the sole goal of creating awareness for your brand.
You can use a single or a mix of channels and content types to deliver and distribute such campaigns.
Your analytics tool will capture data on the success of your campaign depending upon your content and channel.
📊 Brand awareness metrics | 📢 What they inform |
Brand mentions | Number of times your brand is mentioned in public channels and conversations |
Branded search volumes | Estimated number of times people search for your brand name on Google or Bing |
Share of brand voice | Overall percentage of conversation about your brand compared to all your competitors |
Backlinks | Number of websites that link back to your content assets on digital properties |
Net Promoter Score (NPS) | A score indicating how likely a person is to recommend your brand to others |
Earned media coverage | Number of times your brand is mentioned or linked back from a media story without paying |
👉 For you: Social media metrics: All types explained [2025]
7. Post-campaign analytics
At this stage, your campaign is past the runtime. This is where you’ll measure the broader metrics of your campaign to gauge business impact and benchmark them against the pre-campaign metrics.
There are no blanket metrics to measure at this stage, and the ones you will measure will depend upon the campaign and business goals.
Here are some broad campaign metrics that you can analyze to gauge overall business impact:
📊 Post-campaign metrics | 📢 What they inform |
Customer churn rate | Percentage of customers lost |
Conversion rate | Percentage of people who completed a desired action (sales, sign-up, free-trial, demo) |
Repeat purchase rate | Percentage of existing customers who spent money on your business again |
Website traffic | Number of people who landed on your digital properties during a campaign |
Cost Per Acquisition (CPA) or Cost Per Conversion | Amount it costs to gain a desired outcome |
Return on Investment (ROI) or Return on Ad Spend (ROAS) | Percentage of profit generated for every dollar invested in the entire campaign |
NPS | A score that quantifies customer loyalty and likelihood of recommending your business |
👉 You may find helpful: How to get started with benchmarking
6 Pro tips to consider before using campaign analytics
Here's what you should know before processing campaign analytics:
- Identify attribution before running campaigns: “(...) Everyone loves shiny creatives and big budgets, but without solid attribution, you’re throwing money into a black hole,” says strategic investor Grady Cool. “The ugliest part of marketing [analytics] is often the most profitable.”
- Break data silos: It’s easy to lose track of the tools you use for your campaigns and miss the fact that your teams are working in silos when it comes to analyzing the data. Try to bring campaign analytics under one dashboard using a marketing analytics platform so your teams can collaborate on holistic data.
- Familiarize yourself with your analytics jargon: To be able to analyze the data from your campaigns, it’s important to familiarize yourself with the metrics your analytics will pull often. Identify the most used metrics and learn what they mean and how they impact your business.
- Do frequent reporting: Set up recurrent reporting cadence with your team or set up scheduled automated reports if your analytics platform supports. Keeping a regular tab on your campaigns can help you stay on top of trends and quickly pivot when there’s a requirement.
- Strike a balance between vanity and actionable metrics: Metrics like impressions and clicks are easy to track, but they don't always translate to business value. Focus your analysis on metrics that demonstrate impact on the defined objectives.
- Benchmark against competitors: Competitive benchmarking or comparing your key metrics — conversion rates, CPC, engagement — against industry norms or direct competitors reveals where you lead or lag. You can use this information to allocate resources and budgets to move the needle
5 Specific tools for multi-channel campaign analytics
Besides your native campaign and web analytics tools, you can pair us with any of these multi-channel campaign analytics platforms to make the most out of your campaign data:
1. Sprinklr Marketing
⚡Best features: Unified campaign overview, customizable campaign analytics, enterprise-grade governance, native AI, full-funnel customer journey mapping, and integration with other tools
This is one of the most advanced marketing intelligence tools you can get. Sprinklr marketing analytics platform, part of Sprinklr Marketing, is built on a bedrock of the broadest possible access to marketing channels and native AI, which other platforms do not offer.
Features that make Sprinklr worth it:
- Unified dashboard: Track marketing efforts across organic and paid channels in one place and pull in data sources from third-party web analytics
- Real-time sentiment analysis: Monitor campaign sentiment in real time and have Sprinklr flag anomalies for quick course correction and avoid potential brand reputation risks
- Auto notifications and reporting: Get timely notifications on insights that matter to you and have reports delivered to your email
- Enterprise-grade governance: Empower teams by giving access to the only data they need for more precision and focus using account-sharing capabilities
- Powerful integrations: Sprinklr integrates web analytics and data from CRM and CDP systems for a complete view of the customer journey
- Used by half of Fortune 100: Brands like 3M, Corning, Vodafone Germany, Burger King, Wells Fargo, and Phillips, among others, use Sprinklr Marketing
⚡ Bring all your marketing channels and metrics in 1 unified platform — See Sprinklr in action

2. HubSpot marketing analytics
⚡Best features: Customer journey attribution, real-time campaign analytics, better if paired with HubSpot CRM
HubSpot marketing analytics is a part of their Marketing Hub platform, which contains the tools you need to measure and optimize your inbound marketing efforts.
Because HubSpot is a CRM vendor as well, this platform uses the data from Smart CRM to unify customer insights.
Features that make HubSpot worth it:
- Marketing analytics dashboards: Provides a centralized view of your marketing performance
- Campaign reporting: Analyze the effectiveness of your marketing campaigns across various channels
- Customer journey analytics: Visualize the impact of your marketing efforts on the customer journey
- Revenue attribution: Connecting marketing activities to sales outcomes
3. Adobe Analytics
⚡Best features: Customer journey mapping, robust web and mobile app campaign analytics, integration with Adobe marketing tools
Part of the Adobe Experience Cloud, Adobe Analytics is a powerful tool that combines advanced data visualization and analysis for large-scale marketing campaigns.
The platform focuses on providing unified customer measurement across various data points, content, and customer journeys.
Features that make Adobe Analytics worth it:
- Customer journey analytics: Connect customer interactions across all channels, devices, and time to track full campaign impact and efficacy
- Web and mobile analytics: Understand visitor engagement on your digital properties. For campaign analytics to measure campaign traffic, analyze landing page performance
- Content analytics: Measure and visualize the performance of your content to analyze creative performance, optimize content, and dissect engagement metrics
4. Salesforce Analytics
⚡Best features: Integrates with Salesforce Marketing Cloud, Agentforce AI to assist campaign optimization, cross-channel performance overview, bottom-line assistance
Salesforce Analytics, part of the Salesforce Marketing Cloud, is positioned to unify and transform marketing data into actionable insights.
This is a good platform to analyze campaign performance across various channels and assess their impact on the bottom line.
The bottom-line assessment feature is a highlight here which helps you directly tie your campaigns to ROI.
Features that make Salesforce Analytics worth it:
- Data unification and transformation: Automatically connects, harmonizes, and enriches marketing data from various sources to simplify multi-channel campaign analysis
- AI for data management and optimization: Salesforce’s AI, Agentforce, can help optimize campaigns such as identifying and pausing underperforming ads, providing recommendations for improvements, and adjusting campaign goals. AI also helps normalize and enrich marketing data with customer and business information, making data management more efficient
- Cross-channel performance overview: Get a comprehensive view of campaign performance across different channels, including Tableau Next visualizations, AI-powered campaign summaries, and goal-tracking
- Bottom-line impact assessment: Understand how your campaign performance contributes to the overall business results using predictive forecasting and built-in attribution models
5. ActiveCampaign analytics and reporting
⚡Best features: Proactive reporting guidance, intuitive dashboards, and data quality focus (BotSense) for real time insights
Like the other platforms on this list, ActiveCampaign offers a suite of analytics and reporting features designed to provide insights into your marketing performance across various channels.
Data sanity is an important part of campaign analytics, and ActiveCampaign has a specific solution to this problem called BotSense, which is a measure to protect against unreliable data from bot-activity and malware.
Features that make ActiveCampaign analytics worth it:
- Shareable dashboards: You can access dynamic and shareable dashboards that offer a quick overview of your campaign performance
- ActiveInsights: Get strategic guidance through interactive questions and prompts to help you uncover valuable insights from your data
- Real-time reporting toolkit: Identify trends faster, discover new opportunities, and optimize your marketing strategy with actionable data that is updated in real time
- Source tracking and attribution: Understand which campaigns, channels, or strategies are driving the best results for your business
Bring your campaign analytics in one platform with Sprinklr Marketing
Campaign analytics is not an option but the moat of your data-driven business transformation. And getting the most out of campaign data requires supportive internal workflows, priorities, and tools as we’ve discussed in the post.
However, what you learned is the broad overview of campaign analytics. There is no set template or rule to approach it, as the campaign type and business goals will determine your analytics playbook.
But one thing is written on the wall: you need robust analytics platforms to make the most of the data and drive tangible business impacts.
Explore how Sprinklr Marketing can help streamline your campaign analytics. Request a demo today!
Frequently Asked Questions
Campaign analytics generally focus on individual marketing campaigns to track their performance in real time.
General marketing analytics takes on a much broader view that encompasses every aspect of the marketing effort rather than singular campaigns.
Attribution models like first-touch, last-touch, and multi-touch attribution help to track conversions across multiple customer touchpoints. Sprinklr’s AI-powered analytics can give you super-precise attribution insights.
Performance marketing reporting measures all the direct response metrics like cost per acquisition and return on ad spends.
Campaign analytics is more focused on broader performance insights like engagement trends, audience behavior, and brand sentiment.
Leadership teams will more often focus on high-level KPIs like ROI, revenue impact, customer acquisition cost, and conversion rates.
Providing clear, visually compelling reports through campaign analytics tools helps communicate campaign success more effectively with the top brass.