


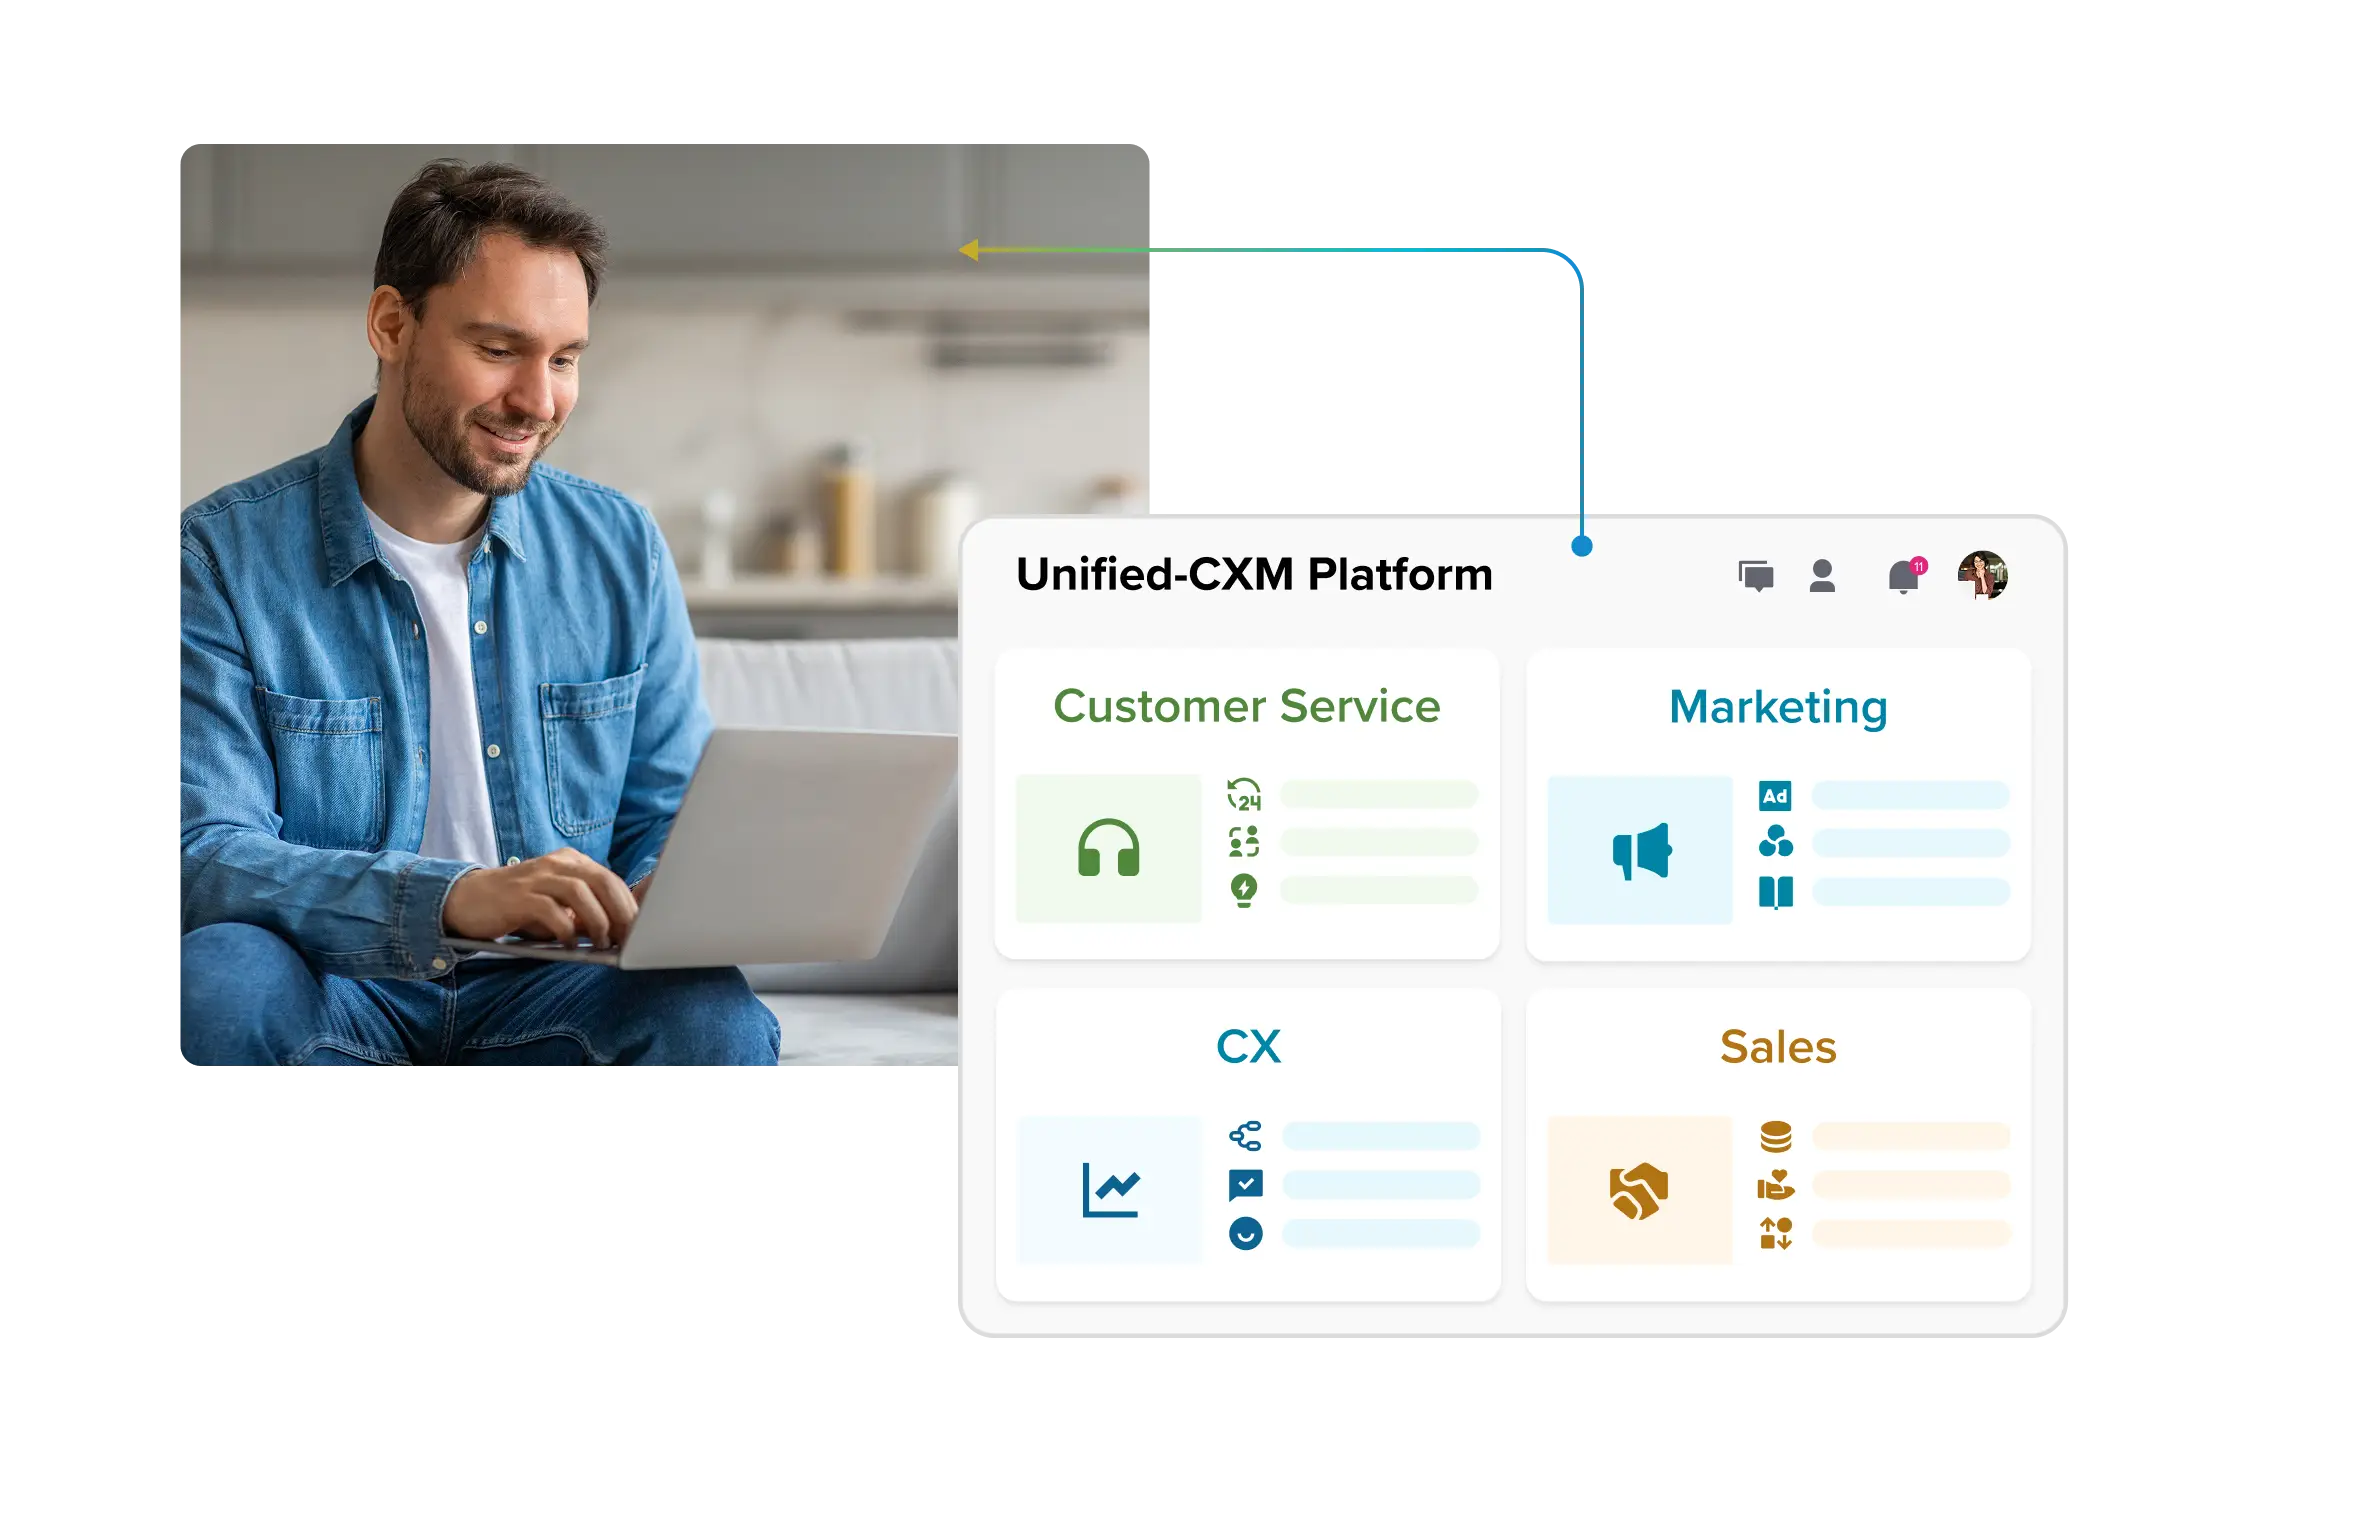
The strategic AI-native platform for customer experience management
Unify your customer-facing functions — from marketing and sales to customer experience and service — on a customizable, scalable, and fully extensible AI-native platform.


How to set up and run a Social Command Center using data visualization

Social media gives brands an insightful lens into the customer experience. The data from social media and modern channels can help brands understand delight and disappointment in real-time, track trends and viral moments as they unfold, and get insights into their products and services that were never possible before.
But unstructured series of charts and dashboards filled with social media data can also quickly overwhelm your brand. Rather than acting on meaningful insights, you might get stuck just trying to make sense of it all. Worse, even if you manage to capture all of that data, showcasing your findings with traditional spreadsheets and slide decks takes tons of work and are out-of-date before you can finish them.
A big-screen Social Command Center built with Sprinklr Display that can harness this real-time social data and convert it into visual storytelling displays can help, and using these displays to create points of collaboration and discussion can create a meaningful digital water-cooler for your teams.
Tell a story with data visualization
If you want to make the most use of your customer experience data, you need to be able to tell a story. And research shows that those stories are more memorable when the audience can visualize them. Studies show that your audience can process visuals 60,000 times faster than words. And, 80% of people are more likely to remember a visual over text.
Whether you’re trying to motivate your marketing team, deliver a fresh insight to your CEO, or delight customers with a provocative social media trend, real-time social media data visualization can help make your story more compelling, connected, and memorable.
No one knows this better than Clive Roach, Director of Digital Social Media at Signify, formerly known as Philips Lighting. Clive has been building Social Command Centers using data visualization techniques since the day of the cathode-ray tube, but today he’s creating Social Command Centers with Sprinklr Display on a whole new level.
Clive and I recorded a webinar recently where we talked about his favorite data visualization strategies. Here are some of my favorite tips and tricks from that conversation that will help you think about how to create this kind of visual experience for your brand.
Harness real-time CX insights
Customer experience data from social media is rich with content and constantly evolving — it doesn’t belong in a spreadsheet. A social command center can put the actual words, pictures, and sentiment of your customers on display in real time.
One trick is to think about all of the different dimensions you can use to visualize data. You’re not just dealing with numbers and metrics, anymore. For example, building displays that pull in the emojis people are using can tell more about customer sentiment than most other ways to analyze the data. An emoji is worth a thousand words.
Here is a data visualization example using emojis:
These real-time views can give you confidence when your brand strategy is working and provide valuable feedback to help you course correct when it’s not. If a campaign or a product launch isn’t going well and generates negative sentiment, visible with blush emojis, thumbs down emojis, or even crying laughing emojis, your teams have a chance to act quickly to remedy the situation.
With Sprinklr’s powerful sentiment analysis available in multiple languages, you can also track sentiment across a variety of dimensions like demographics, topics, influencers’ status, and more. Watching data unfold over time on the big screen can help you and your team stay informed as the conversation around your brand develops.
Create a shared experience
Want your marketers to see how a new campaign is going? Or let your development team see actual feedback from a new product launch? Or do you want your customers to see what kind of impact your brand or your product is having globally? A social command center built with Sprinklr Display can do all of these things.
For example, if you launched a new product video, you can use a Sprinklr Display to show the video on one screen, and the social feedback and sentiment on another. Put it up on the wall where your marketing and communications teams work so they can see real-time feedback about their work. Watching social comments unfold in real time as a campaign launches with marketing and product teams can help create a shared experience that results in discussion and collaboration.
Keeping your displays simple and tailored to your audience is a critical data visualization technique. The data that excites your marketing team may be very different than your product developers or your C-Suite. Make sure to customize your displays wherever you can. With Sprinklr Display, switching out the content is easy with the remote control app optimized for your phone. You can be watching updates on a recently launched campaign and quickly switch to a brand sentiment view when the CEO enters the room. Any command center should be able to switch views on “command.”
Mashup your data visualization for unique insights
Just like the emoji and video examples above, finding new ways to combine data sources to create compelling insights is one of the most rewarding parts of a well-done Social Command Center.
This is one of Clive’s favorite parts, too. He uses data mashups to do interesting things like combine product feedback and influencer scores to show how influencers are amplifying their brand. “This is the big difference between social and other click data. [With social], you get to see how people actually feel,” says Clive.
With Sprinklr Data Flow/Data Engine, you can load in non-social data and use Sprinklr Display to visualize it in a compelling way. Upgrade your Social Command Center to a Business Command Center.
Take control of your display, and your brand
Clive also suggests tailoring your displays to align with key moments. For example, if your brand is holding a conference or has a presence at an industry event, you can use displays to see what people are chattering about, what sessions they are looking forward to, and the highs and lows of activity as the event plays out.
Clive explains, no matter what data you put on display, remember to keep it simple, and keep it fresh. Displays that stay static for more than 15 seconds risk losing the interest of the audience. And displays that try to show every kind of data under the sun just confuse people. Pick a few data points or graphics that make the most impact, and keep it moving. Remember, you’re trying to tell a story. I love this insight. If screens aren’t moving, animating, or flickering, the data can look stagnant. Keep it moving to keep it engaging.
Put the data in your pocket
If you have all of your data on a unified customer experience management (Unified-CXM) platform, you can easily transition your data from big-screen displays to live presentations that can give your slides the same dynamic insights you use in your command center. Clive and his team call this putting the data in your pocket because it’s easy to take the data with you — whether it’s a client meeting or a board meeting.
With Sprinklr Display, you can easily convert to Sprinklr Presentations. Now you have all the insights from the big screen, sharable as slides. You can also move in the other direction, too. Imagine sharing a set of slides and then when the team can gather in front of the command center, moving it up to the big screen with a click of the button.
AI-powered insights can also help you dive into data points at a more granular level. AI can spot trends, anomalies, and other dimensions that might make a data point worth looking at more closely. This kind of feature can transform your data from nice-to-know to actionable insights.
Listen in to my discussion with Clive to learn more about how you might be able to harness data visualization to transform your customer experience data into a compelling story about your brand.
Watch the webinar.
Check out Sprinklr Display.
Check out Sprinklr Presentations.