


Transform CX with AI at the core of every interaction
Unify fragmented interactions across 30+ voice, social and digital channels with an AI-native customer experience platform. Deliver consistent, extraordinary brand experiences at scale.


Customer service analytics – A comprehensive guide
Businesses that really listen to the voice of the customer (VoC) witness enduring growth and success. But the customer’s voice is garbled in terabytes of raw data, waiting to be processed into comprehensible insights. That’s where customer service analytics or CSA enters the picture.
CSA enables support professionals to capture, process and analyze tons of raw customer data into actionable insights that can be used to inform every customer-facing function - from support to sales to marketing.
Now more than ever, customer service analytics is in the spotlight.
Why, you ask?
Customer service channels are exploding. Customer journeys are becoming more and more complicated. Data is pouring in from all sides, giving support teams the insider advantage that other teams lack. With access to first-hand, real-time customer data, support teams now hold the key to long-term customer retention and business growth.
Learn more: Voice of Customer – What it means and how to interpret it
Listen to Gartner’s take on CSA: 84% of customer support leaders view customer data and analytics as “important” to “very important” towards attaining their organizational goals in 2023. For all the respondents, CSA emerged as the topmost priority for achieving their customer service objectives.
Understanding customers’ needs and expectations for their service experience is integral for improving loyalty and creating customer value, especially when organizations are up against economic headwinds.
Jonathan Schmidt
Sr. Principal, Gartner
So, if you’re serious about building a customer-centric brand, stick around. We intend to cover the length and breadth of customer support analytics – spanning its concept, benefits, use cases and key metrics. Let’s get started.
What is customer service analytics?
Customer service analytics (CSA) is the process of tracking and processing customer data from various touchpoints and tools to generate intelligible insights for business leaders and support professionals. The data is gleaned from pre-purchase queries, social media comments, purchase/return histories, reviews, customer surveys and beyond. Yes, the coverage of CSA is comprehensive, and the application is business-wide.
Imagine an everyday scenario at your contact center.
You trigger a social media poll to gather early feedback after a big product launch. All kinds of poll responses flood your timeline. However, without customer service analytics, this mammoth data is just noise. It is CSA that converts data to insights and delivers visual customer service reports that stakeholders seek.
CSA stems from the concept of Earned Growth – a metric introduced by Bain & Co. to define the quality of business growth. It measures the segment of business growth attributed to existing customers, organic referrals and retention efforts. In other words, it quantifies your customer lifetime value and its impact on your overall revenue.
Earned growth holds a lot of weight in a hypercompetitive business landscape marred by steep customer acquisition costs. That’s what makes customer service analytics an essential building block for modern enterprises.
Why is customer service analytics important to businesses?
We have touched on the benefits of CSA briefly. To elaborate, customer support analytics drives:
- Improved customer satisfaction: Deloitte found that brands that analyze customer interactions rigorously witness 20% higher CSAT or customer satisfaction. By aligning products and processes to real-time demand, they are able to deliver hyper-personalized customer experiences that the modern customer craves.
- Cost and operational efficiency: Analyzing customer interaction indicates the loopholes in your macro and micro processes and teams. With timely intervention, you can cut support costs by 15%-20%, according to McKinsey.
Likewise, CSA helps with unclogging your operational processes with efficient tagging of customer issues. When tickets are tagged correctly, they are routed to the right teams/departments for efficient resolution.
💡Pro tip: There are omnichannel ticketing tools that allow task assignment to relevant teams when certain predefined conditions are met. Agile operations that move on autopilot save you tons of time and effort.
- Data-driven decision-making: As stated, support data and insights shape your product roadmap, sales offerings, marketing campaigns and many other strategic decisions. With astute data for guidance, your business can make decisions 2.6x faster than peers who don’t use data analytics. It’s also easier to pivot and change directions with a data-backed approach to defend yourself.
Types of customer service analytics
Customer service analytics typically fall into a few buckets based on the insights they generate and the input they require.
Prescriptive analytics
These analytics give actionable recommendations to resolve existing issues and refine your customer support strategy.
Example: Customer analytics tool detects customer disengagement and possible churn. It suggests quick fixes such as deals and discounts to re-engage the at-risk customer.
Descriptive analytics
Descriptive analytics summarize insights and pinpoint trends from historical customer data to help you decide the future plan of action. Example: A channel-wise analysis of incoming tickets can identify your customers’ preferred communication channels and guide your resource allocation.
Predictive analytics
Predictive analytics, as the name suggests, forecasts potential issues based on historical trends. Thereafter, proactive measures can be implemented to avoid support mishaps and undesirable outcomes. Finance and marketing professionals use these analytics extensively to risk-proof their strategies. Example: Agent absenteeism is common in holiday seasons, which leads to long wait times and churn for customers. If your customer service analytics tool predicts these instances, proactive measures can be taken to avoid understaffing and its aftermath.
Diagnostic analytics
Diagnostic analytics helps with root cause analysis of specific events by examining customer data. It is great for deciphering trends and patterns in customer behavior after milestone events such as product releases or updates.
Example: A spate of customer complaints after a new campaign indicates brewing trouble. You can identify the causal factors by scouring customer call transcripts and messages.
Based on the application, customer service analytics can be categorized as:
Customer journey analytics
A type of predictive analytics, customer journey analytics presents a helicopter view of the customer journey. It shows potential engagement and revenue opportunities that crop up when click-happy customers switch channels. With an analytics tool watching their moves, it’s easy to keep pace and swing into action quickly. Open rates of outbound emails and purchase/return histories can divulge journey-related data.
Customer experience analytics
This category covers standard metrics that give visibility into customer satisfaction (CSAT), first response time (FRT) and average handling time (AHT). The insights can be used to optimize workflows and turbocharge your sales, marketing and support teams.
Customer retention analytics
This bucket entails all the metrics that foster customer loyalty and retention, including net promoter score (NPS), customer effort score (CES) and customer lifetime value (CLV). The underlying logic is that high-effort interactions signify a lousy customer experience, which erodes customer loyalty. Conversely, effortless customer interactions result in positive experiences, leading to high customer loyalty and repeat interactions.
Use cases & examples
En masse customer interaction opens the floodgates to valuable customer data. If you are underutilizing customer service analytics, there are plenty of use cases to give you a winning start. Let’s discuss them.
Use case 1: Build self-serve tools
Top contact driver data can guide your self-serve support strategy and help you build knowledge bases, FAQ chatbots and troubleshooting resources. Empowered customers are happier customers.
Use case 2: Gather product/service feedback
Combining customer surveys and review platforms will uncover the customer’s perception of your brand and products/services. With this added visibility, realign your product roadmap and prioritize enhancements that make sense.
Use case 3: Improve ticket prioritization
Ticket tagging and priority ought to be based on issue complexity and sentiment analysis. Customer service analytics can help put a pin on these variables so that SLA violations and escalations are minimal.
💡Pro tip: Not all incoming messages warrant a response from support teams. There are AI-powered customer support tools that filter engageable messages from the crowd. With ticket queues decongested, priority setting and time management become easy for agents and supervisors.
Use case 4: Manage brand health on social media
Tracking brand sentiment on social media platforms is essential in this day and age where negative PR spreads like wildfire. Customer service analytics of predictive nature can notify you as sentiment around your brand dips, enabling you to take timely action.
Important metrics of customer service analytics
There are scores of customer support metrics that need to be tracked in order to get a holistic picture of your brand health. However, these six metrics are non-negotiable when it comes to defining business growth in the CX realm:
1. Customer Satisfaction (CSAT)
CSAT indicates overall customer happiness with your brand, products and services. It is the median response of all your customers to the question – On a scale of 1-10, how happy are you with your experience with us today? The higher the score, the better it is for your brand.
2. Customer Effort Score (CES)
CES measures the amount of effort customers exert in order to get information, resolutions or assistance from your brand. If a customer faces friction while navigating your website or accessing your support, the customer experience suffers which spells trouble for any brand.
3. Customer Lifetime Value (CLV)
CLV quantifies a customer’s lifelong spend with your company. If a customer repeat-buys from your brand or brings in referrals or positive engagements, their lifetime value spikes, indicating satisfaction with your brand as a whole. Contrarily, dipping CLV shows dissatisfaction and can be rectified with targeted offers, loyalty incentives and other strategies.
4. First Contact Resolution (FCR)
FCR is the percentage of tickets that are solved in the first instance, without the need for repeated contacts. It evaluates the efficiency and quality of your support function - from your agent quality to your routing algorithm. A brand that is able to deliver prompt and accurate resolutions in the first go is set for success in this era of instant gratification.
5. Customer Retention Rate (CRR)
CRR is the percentage of total customers your business is able to retain over a fixed period of time. Modern customers value product quality, personalized experiences and support responsiveness in brands they patronize. So, nail these aspects if you want to improve customer retention and avoid hefty customer acquisition costs.
6. Customer Churn
Customer churn defines the number of customers who abandon your brand in a specific period of time. It is inversely correlated to customer retention. Customer churn is a precursor of doom for modern brands as it can set off a domino effect. If spurned customers vent on public forums, they can turn off other existing and prospective customers into churning as well.
Interesting read: 7 proven ways to reduce customer churn rate
How to perform root cause analysis in customer service with the help of data and AI?
The global customer analytics market is expected to skyrocket on the back of big data and artificial intelligence. AI, as a technology, is brilliant at number-crunching tens and thousands of conversations in seconds. There is little room for subjectivity or human error in the analysis. Additionally, trendspotting is easier with AI removing layers of unwanted data and laying bare the metrics that matter.
With the advent of natural language processing (NLP), synthesizing voice and text data has become easier. NLP processes conversations like humans – in semantic phrases, not standalone keywords. That’s why root cause analysis (RCA) in customer service is now more objective and accurate than ever.
Conclusion
To summarize, customer support analytics are foundational to business excellence and growth. In the right hands, CSA has the power to harmonize core business functions with customer needs, interests and demands. When customers feel heard and valued, magic happens.
Still skeptical?
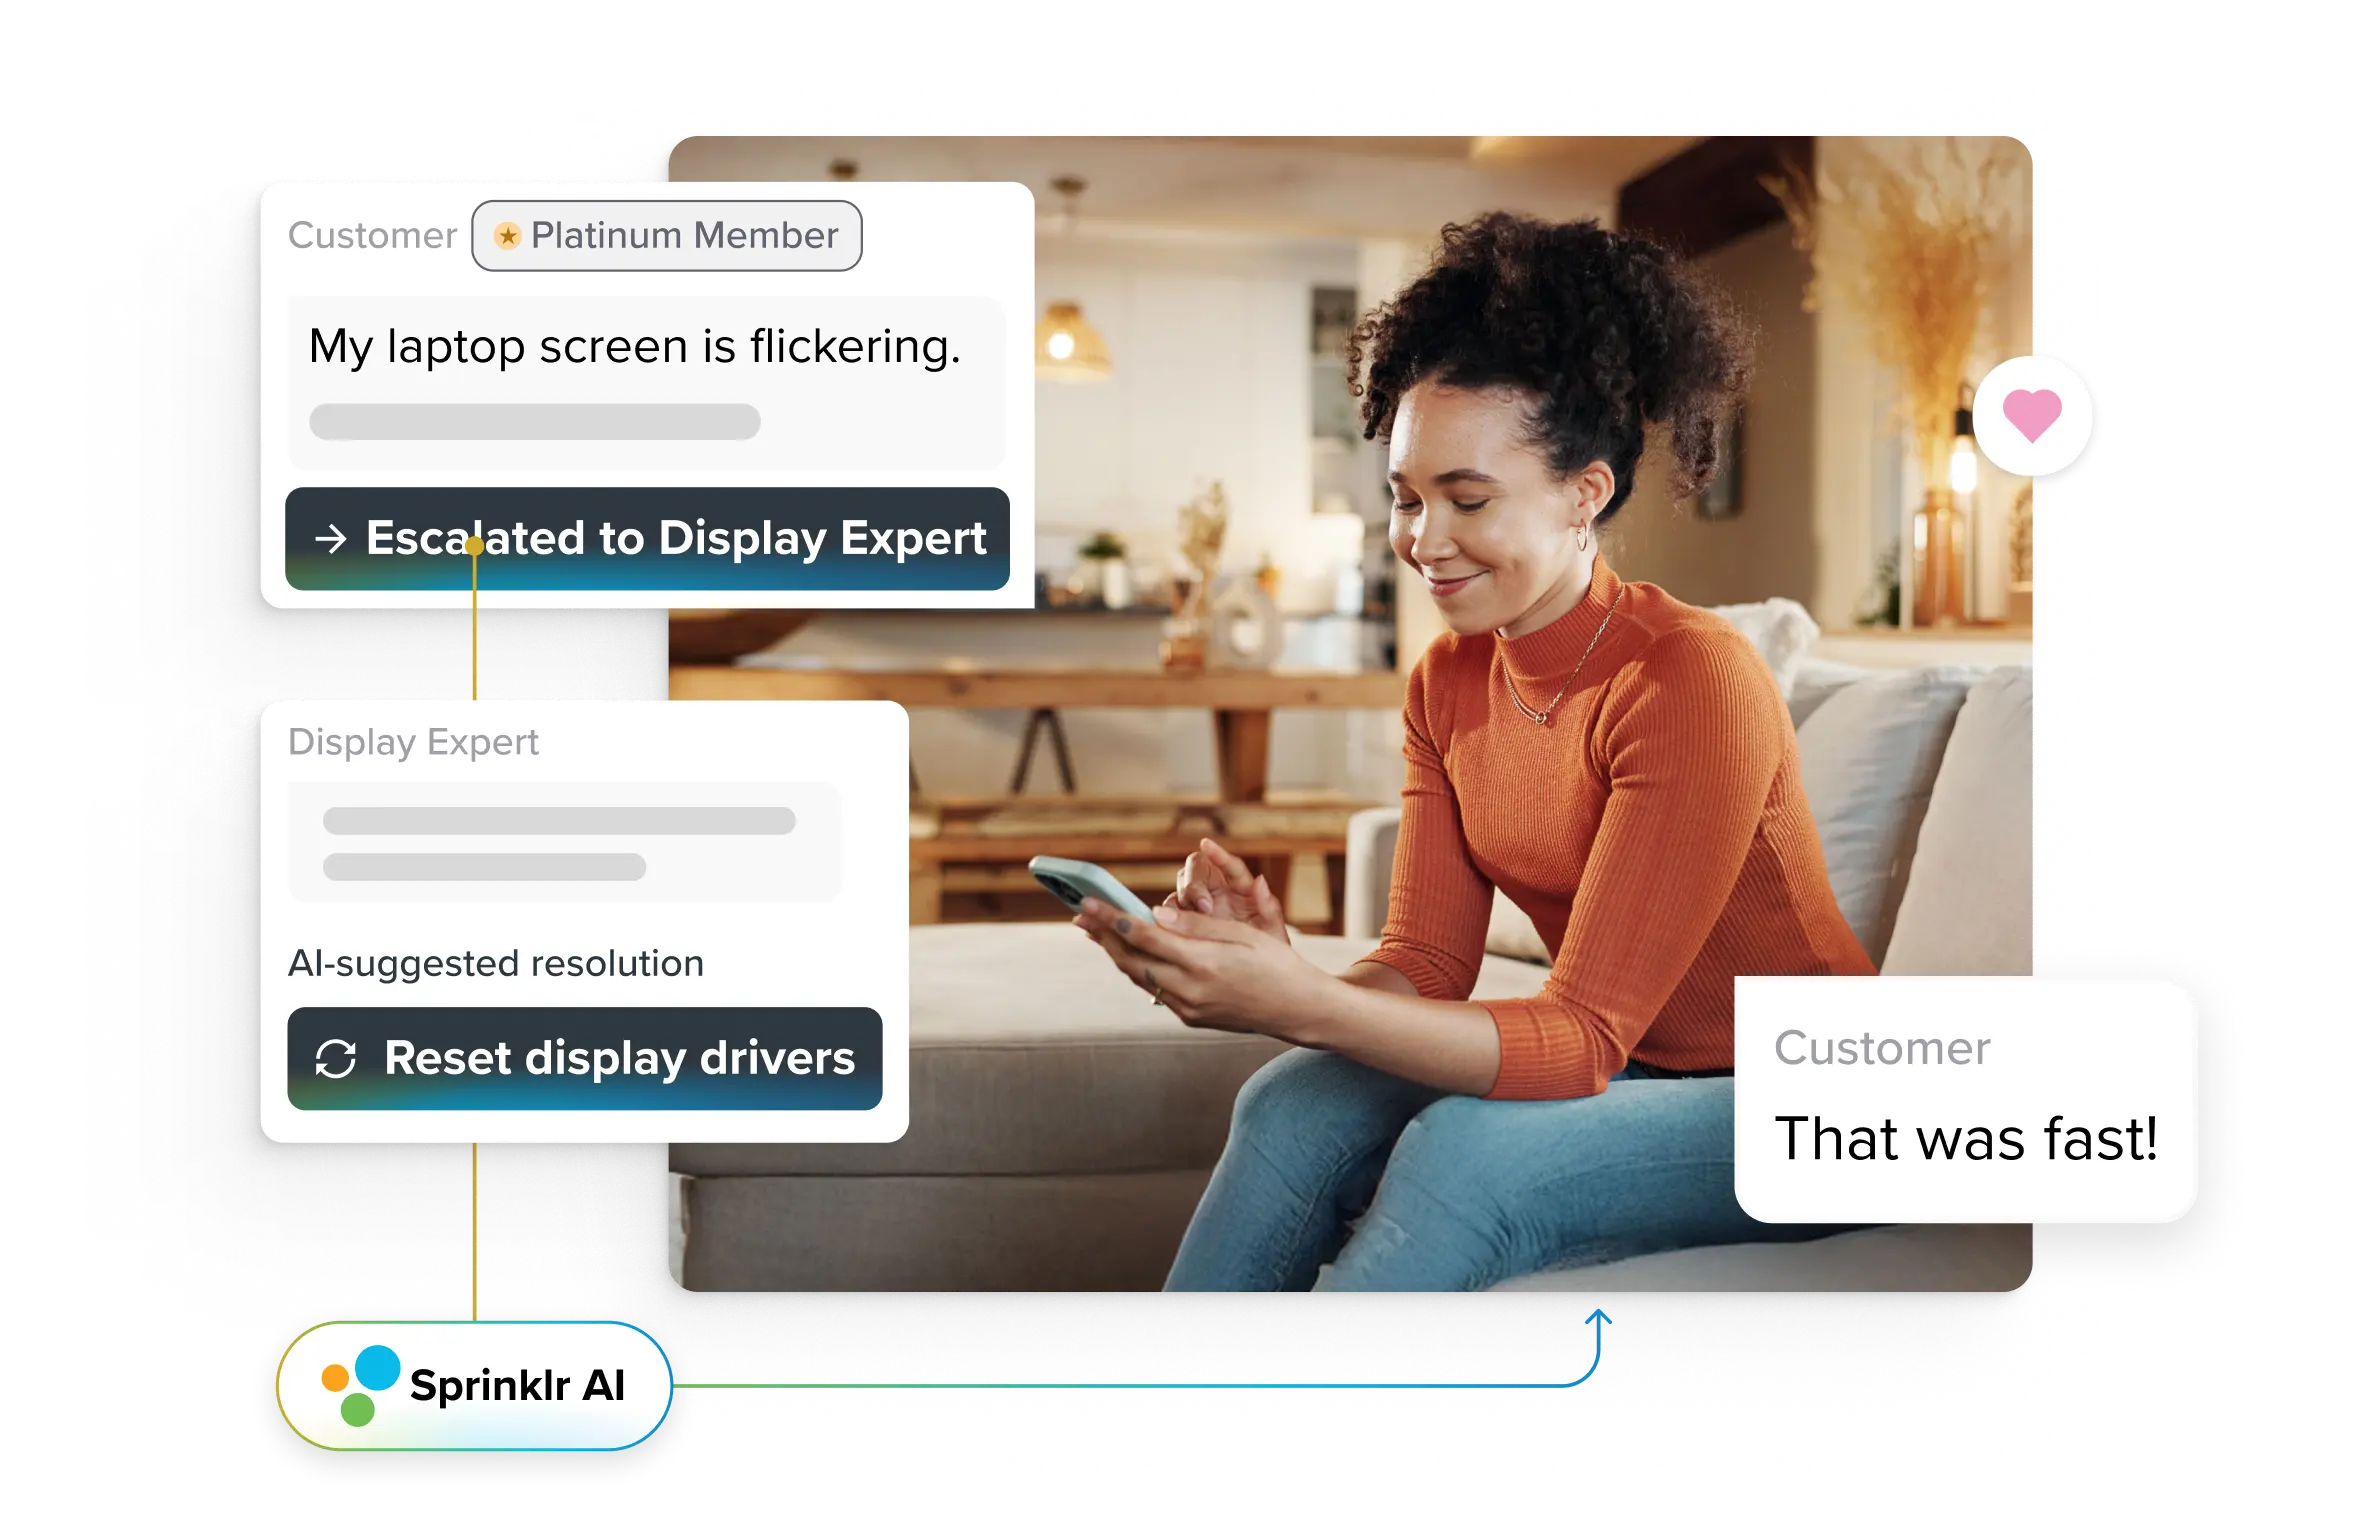
Check out Sprinklr Service, which powers customer support for nine out of 10 leading enterprises including Honda and Uber.
With AI-powered reporting and analytics software, Sprinklr can glean insights from 100% of your customer conversations across 30+ channels to give you comprehensive insights. Persona-led dashboards and customizable reports enable easy comprehension of data. Request a demo or book a free trial today.
Frequently Asked Questions
Customer service analytics can be categorized into four main categories:
- Prescriptive analytics
- Descriptive analytics
- Diagnostic analytics
- Predictive analytics
Data analytics in customer service helps analyze customer data to gain insights, improve support processes, personalize interactions and predict customer needs, ultimately enhancing the overall customer experience.
Metrics in customer service analytics are essential because they help:
- Identify issues and detect improvement opportunities
- Measure performance and ensure quality
- Simplify decision-making with data-driven insights


