


The strategic AI-native platform for customer experience management
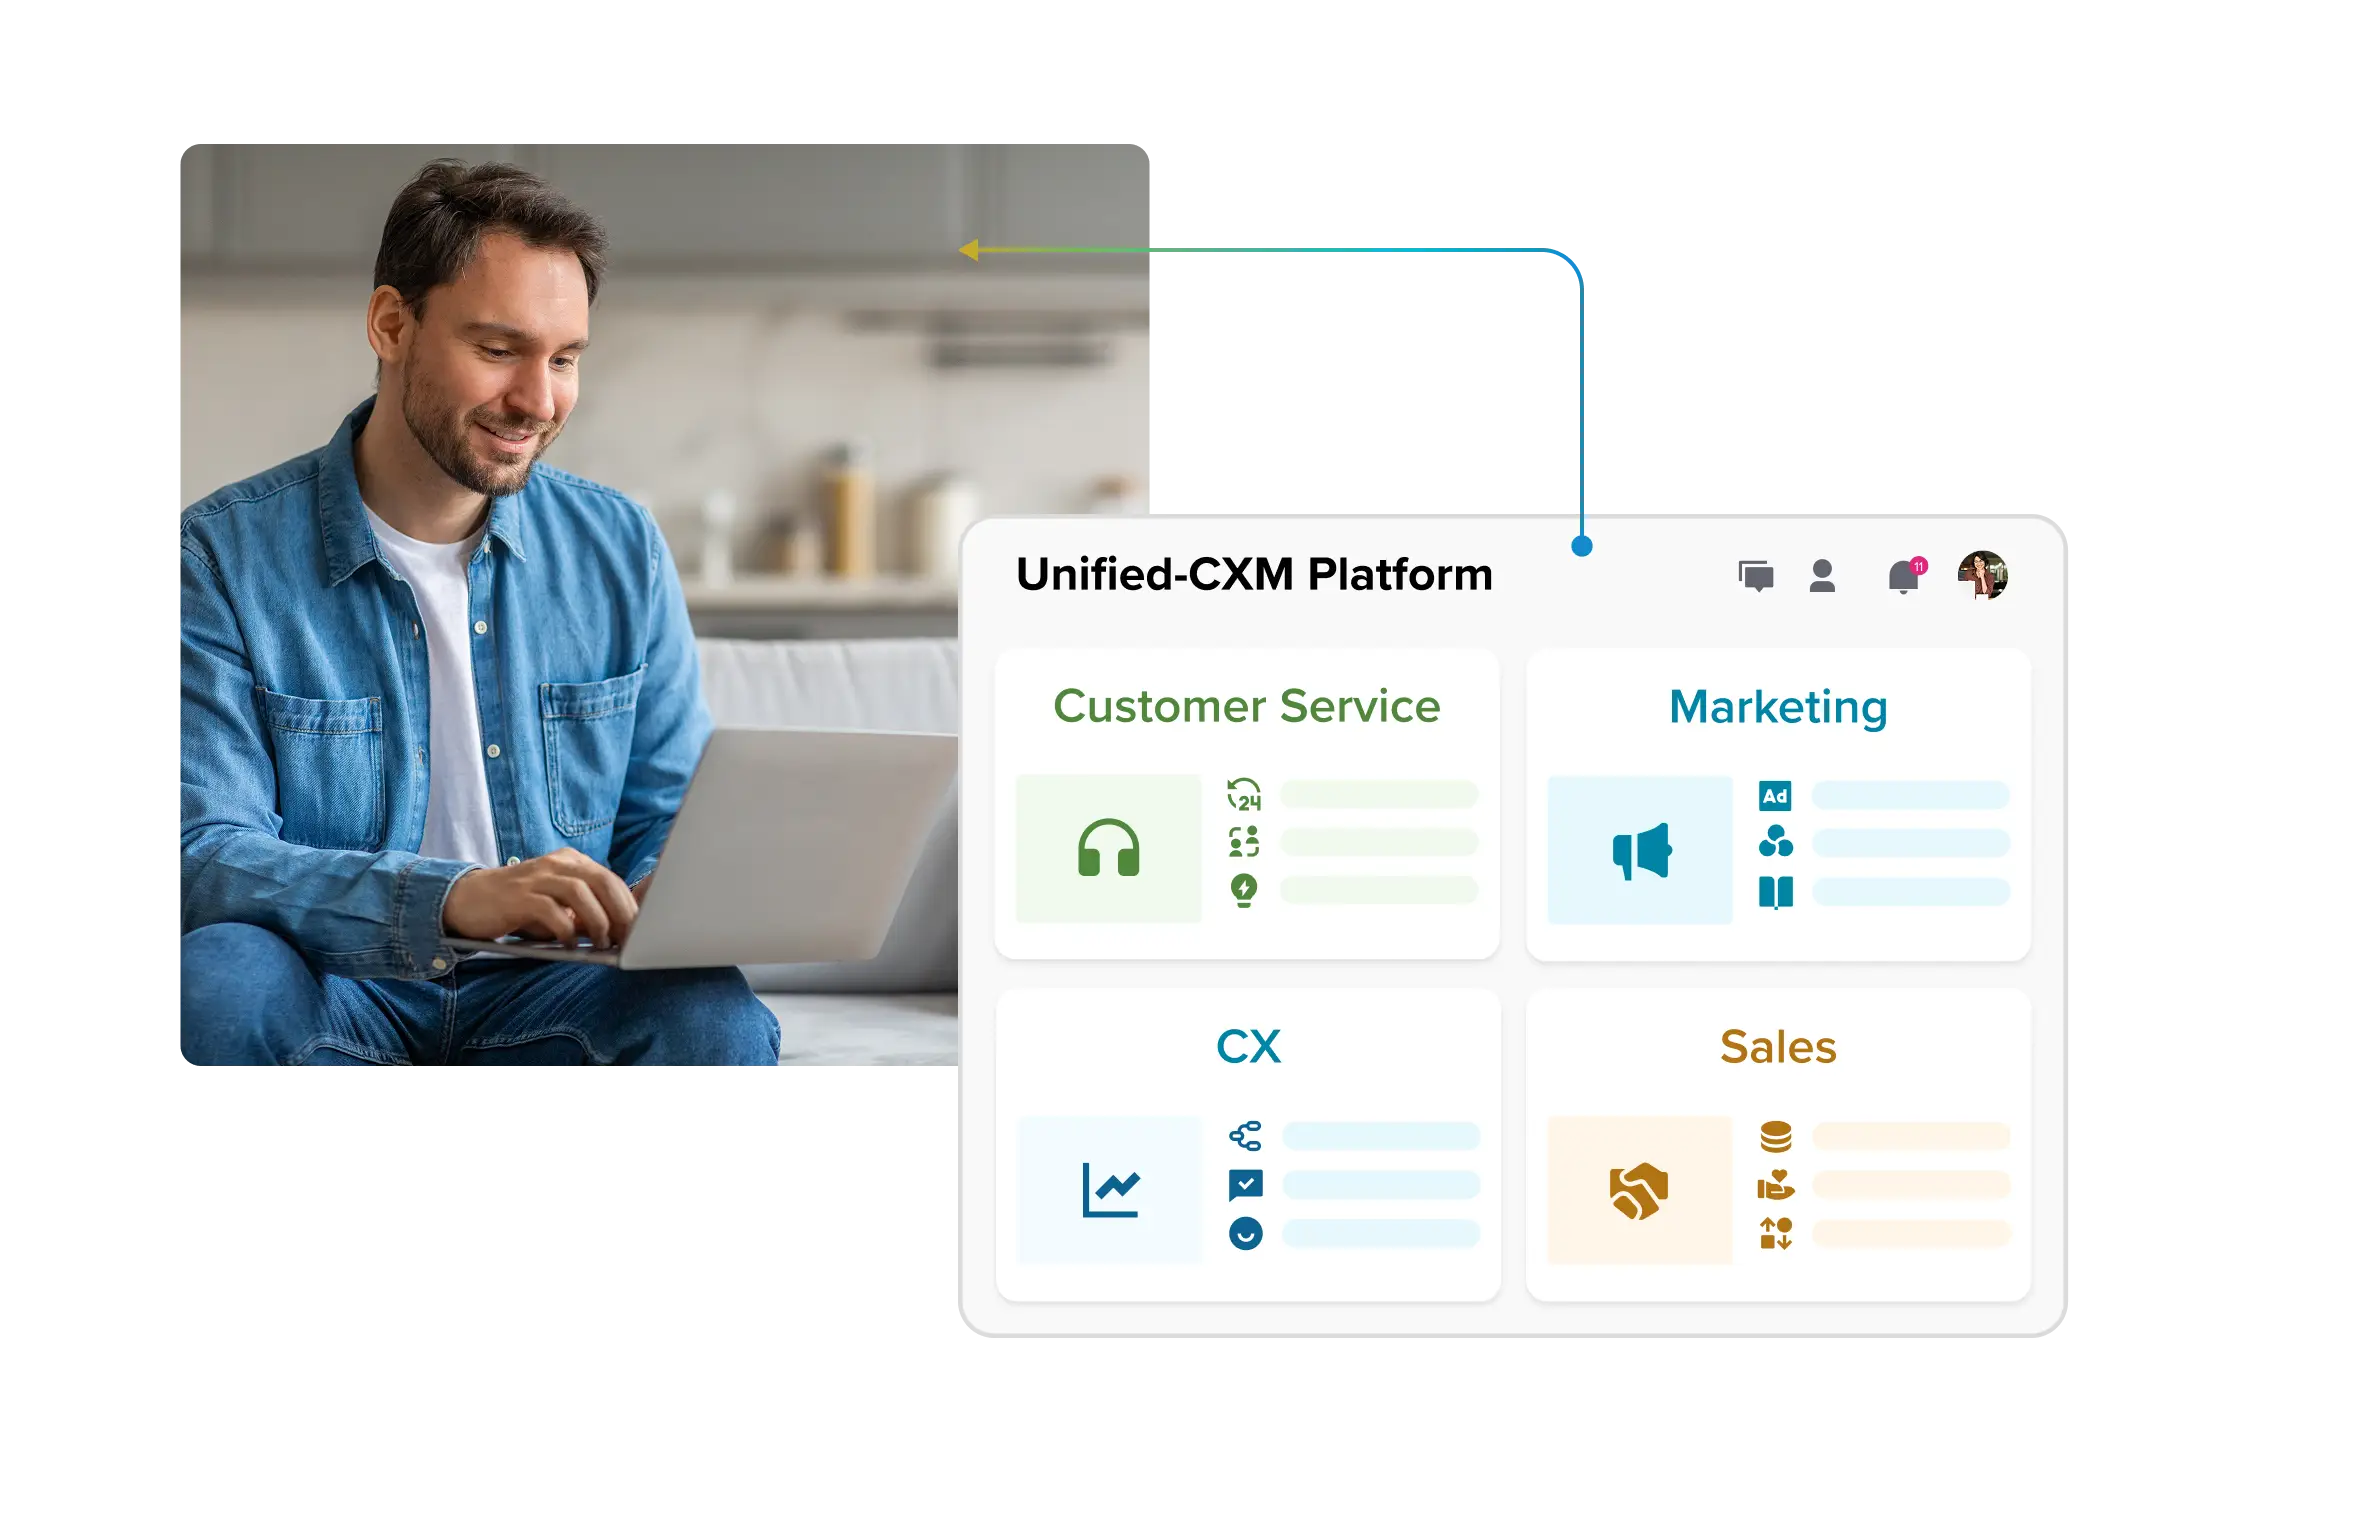
Unify your customer-facing functions — from marketing and sales to customer experience and service — on a customizable, scalable, and fully extensible AI-native platform.


How To Measure Customer Experience Using Real-Time Signals


Measuring your brand's customer experience (CX) through traditional metrics alone is like experiencing a symphony through a single, muffled earpiece. You'll catch some notes but miss the full emotional crescendo happening in real time.
Legacy measurements of customer experience, like NPS and CSAT surveys, provide valuable baseline insights. But they capture only snapshots of your customers’ sentiment, often weeks or months too late after the actual experience occurred.
What you’re missing here is big: over 80-90% of customer feedback now exists in unstructured formats across social media, reviews, and digital conversations.
Can you ignore this goldmine of real-time feedback/data?
If you can’t, in this post, we’ll walk you through the real-time KPIs for CX — from social listening to live sentiment analysis — along with the traditional ones, so you can strike the right balance when it comes to pulse-checking the modern customer experience.
- Why real‑time signals are vital in measuring modern customer experience
- What are these real-time signals of customer experience?
- Why traditional survey-based metrics aren’t enough to measure CX
- Why real-time, AI-driven CX measurement is the new standard
- Top 12 metrics to measure customer experience in real-time
- Where to find signals for customer experience?
Why real‑time signals are vital in measuring modern customer experience
As we keep saying at Sprinklr, one good customer experience anywhere sets the expectations everywhere — not necessarily from your competitors.
Your customers think: “If one brand can do it, why can’t others?”
And customers mean it, too: 33% of them will abandon a brand after just one poor experience. So, the luxury of delayed insights is off the books, if you ask us.
That’s why capturing and measuring interactions as they happen is the only way to measure modern CX.
Real-time insights let you respond to customer needs and convert interest into loyalty in the moment. Not after they’ve decided to move on.
Have you wondered: What do customers really want?
Before we explore the value of real-time CX measurement, let’s take a step back and clarify what real-time signals really are.
🔥Measure CX via real-time signals from 30+ channels. Have AI automatically score interactions and interpret CX drivers
Sprinklr’s Conversational Analytics software uses AI to analyze 100% of your customer interactions across channels: voice, chat, email, and social.
It then detects sentiment, root causes, anomalies, topic trends, and top impact factors on key contact center metrics in the conversations.
It doesn’t just measure CX; it tells you what’s moving your metrics.
What are these real-time signals of customer experience?
Real-time signals are the immediate customer cues and behavioral data that you can capture as interactions unfold.
For example, your customer tweets about a delayed delivery. If you’re measuring CX in real time, the software will pick it up instantly, alert support, and you can respond with an apology and/or update.
All these happen without the customer even tagging your account. That’s using a real-time signal to act fast and improve the experience.
As you can see, these are dynamic signals rather than just survey-based metrics. Just like tweets, clicks, purchases, social media posts, or chat messages — all these show how a customer is feeling or behaving right now.
And with the correct system in place, you can track, analyze, and act upon them right when they’re happening.
Here are a few examples to illustrate the range of real-time CX signals:
- Sudden uplift or drop in customer sentiment during a chat or call
- Shifts in journey behavior, such as session drop-offs or repeated page refreshes
- Instant feedback pings via micro-surveys or live ratings
- Key interaction metrics, like live support wait times or transaction abandonment rates
We’ll examine how to utilize each of these signals further ahead. But first, let’s address another question:
Why traditional survey-based metrics aren’t enough to measure CX
According to research published by Urban Affairs Review, several persistent issues undermine the effectiveness of conventional CX measurement methods:
- Slow and retrospective: Traditional customer surveys and questionnaires are collected after the customer interaction.
This lag prevents them from capturing real-time sentiment or behavioral shifts, providing only a static snapshot rather than a dynamic, ongoing view of the customer experience.
- Low engagement and response rates: Declining response rates for web-based and traditional surveys make it harder to gather representative feedback.
Systematic reviews highlight a “clear downward trend in response rates,” which reduces both the reliability and the timeliness of these insights.
- Limited depth and context: Structured survey questions and Likert scales often fail to capture the nuances of customer sentiment or the context behind their experiences.
Open-ended feedback is usually sparse, especially on mobile devices, limiting the richness of insights.
Why real-time, AI-driven CX measurement is the new standard
Here are the tangible benefits of AI-driven, real-time CX measurement approaches:
Real-time sentiment and behavioral insights
Modern AI-based customer support tools like Sprinklr Service use natural language processing and sentiment analysis.
You can, therefore, analyze every interaction, including surveys, social media content, and others, as they happen.
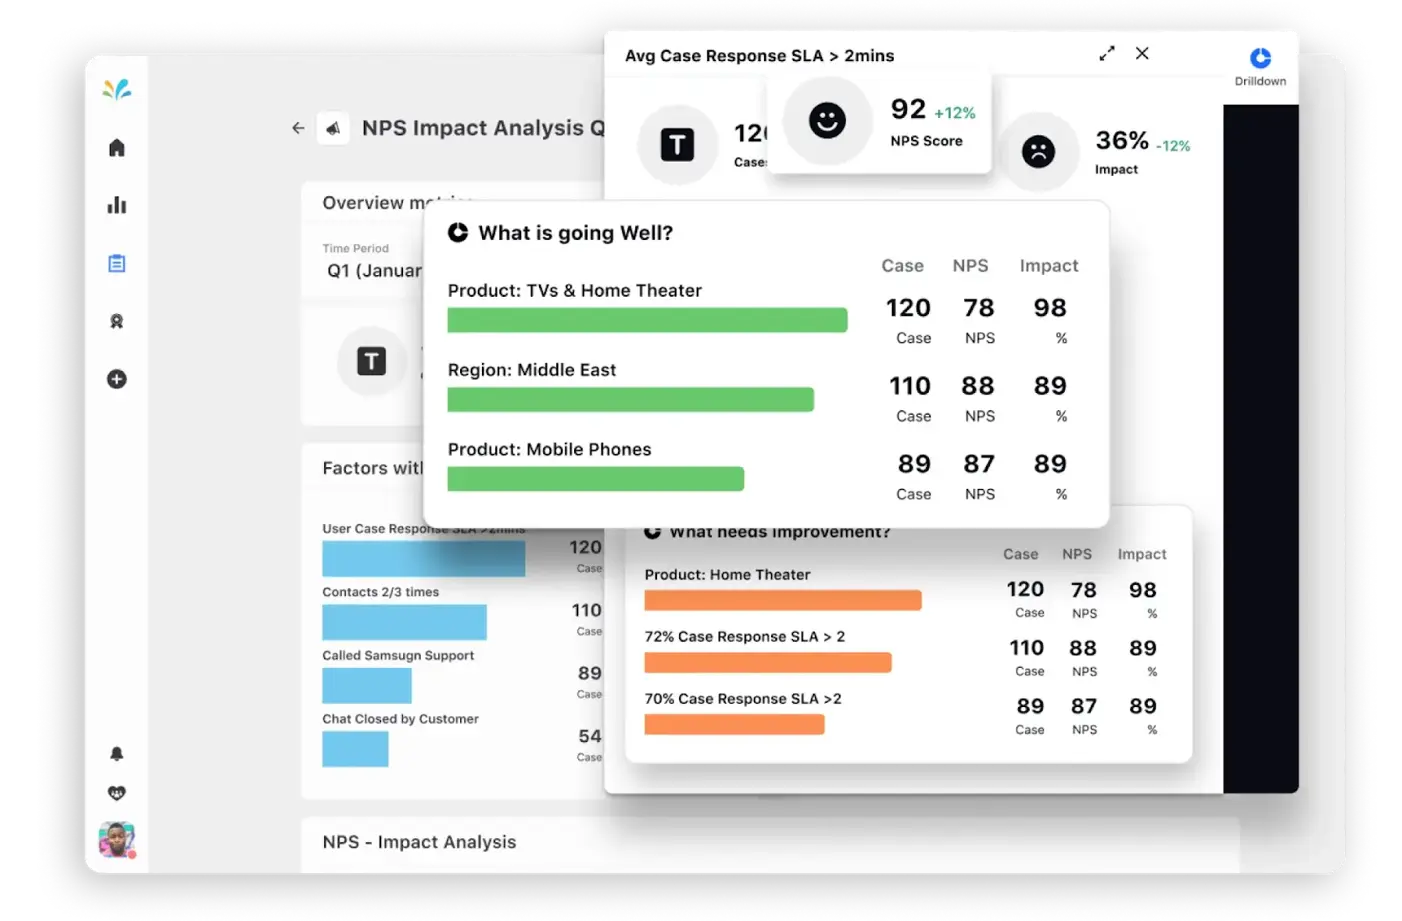
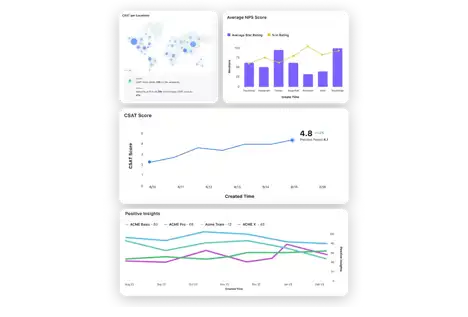
Here’s an example of Sprinklr Service analytics breaking down the top contact drivers by channels, sentiment, and other data visualizations 👇
Sentiment and behavioral metrics capture immediate emotional responses and trends that give you actionable insights faster than conventional surveys.
Deeper insights from unstructured data
AI can extract themes, emotions, and intent from free-text feedback, chat logs, and social posts.
These unstructured sources often contain a Pandora’s Box of information about CX, but you need a system to glean feedback or score it.
CX platforms, such as Sprinklr, come built-in with the capability to extract qualitative data from unstructured sources.
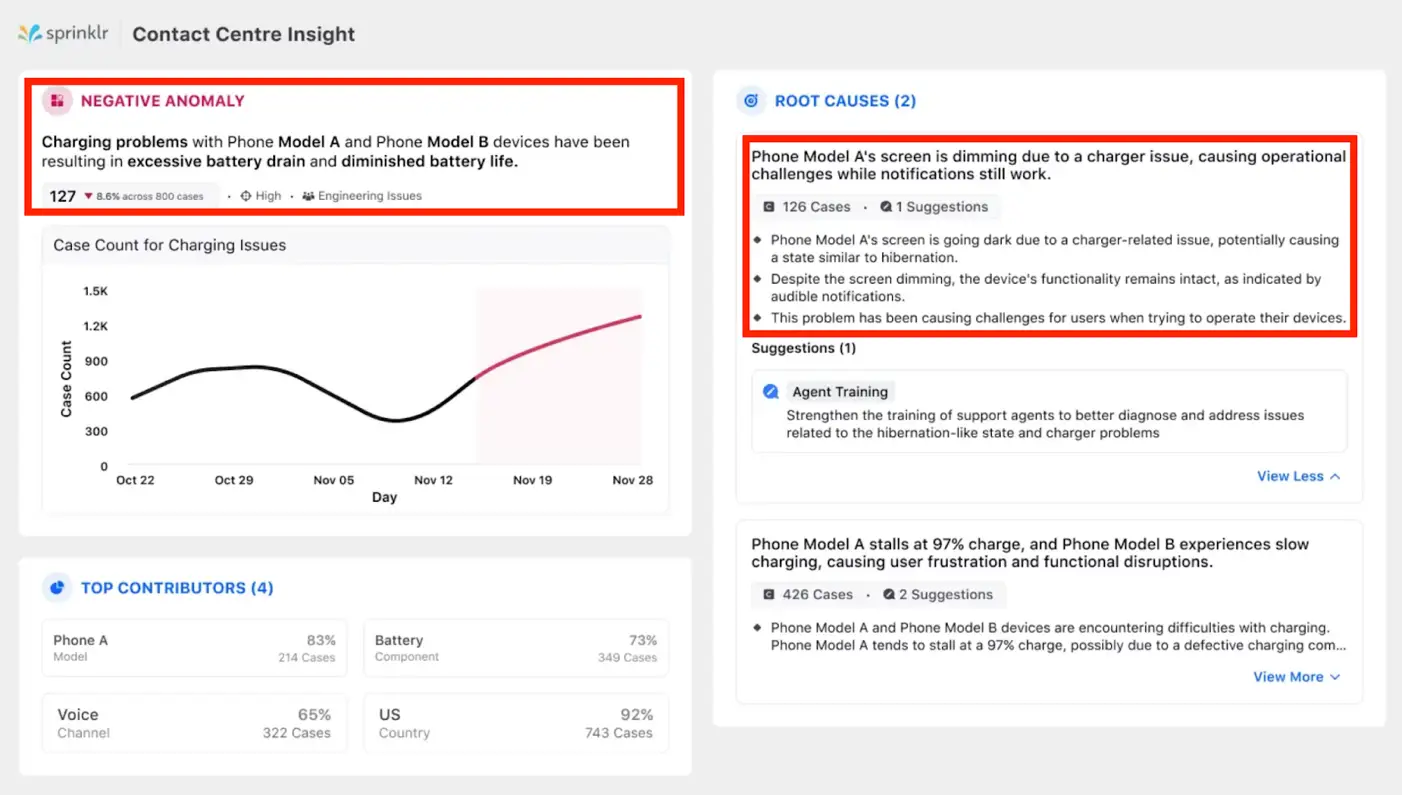
For example, Conversational Analytics in Sprinklr Service utilizes AI to scan 100% of conversations live and identify potential issues, such as missed SLAs by a team/region, or interactions with low predicted CSAT. It then auto-alerts supervisors using Sprinklr AI👇
This leads to a richer and more accurate view of customer experience beyond what structured survey data can offer.
Adaptive and contextual surveys and scores
Asking the right questions is as important as measuring their outcomes. This is because questions will determine the answers, and that will impact the scores.
If you rely on cookie-cutter survey templates to inform CX, you’re probably running in circles.
Meanwhile, your customers have a range of experiences from different touchpoints of your brand, which they may be ready to share with you.
This is where AI-driven surveys and chatbots, such as Sprinklr’s Omnichannel Surveys, come in.
Conversational Surveys feature uses AI to dynamically adjust questions, typically in a chatbot environment, based on the customer’s response 👇
For example, in a smartphone feedback survey, if a customer selects “Very dissatisfied” for battery life, the AI immediately asks: “What frustrated you most—fast drain during video playback, standby time, or general use?” This ensures relevant, deeper follow‑up only when needed
This technology helps you track evolving customer needs and reactions dynamically, instead of sending generic questions and soul-searching in a vast pool of opaque responses later.
🔥Measure CX using omnichannel surveys and built-in data visualization
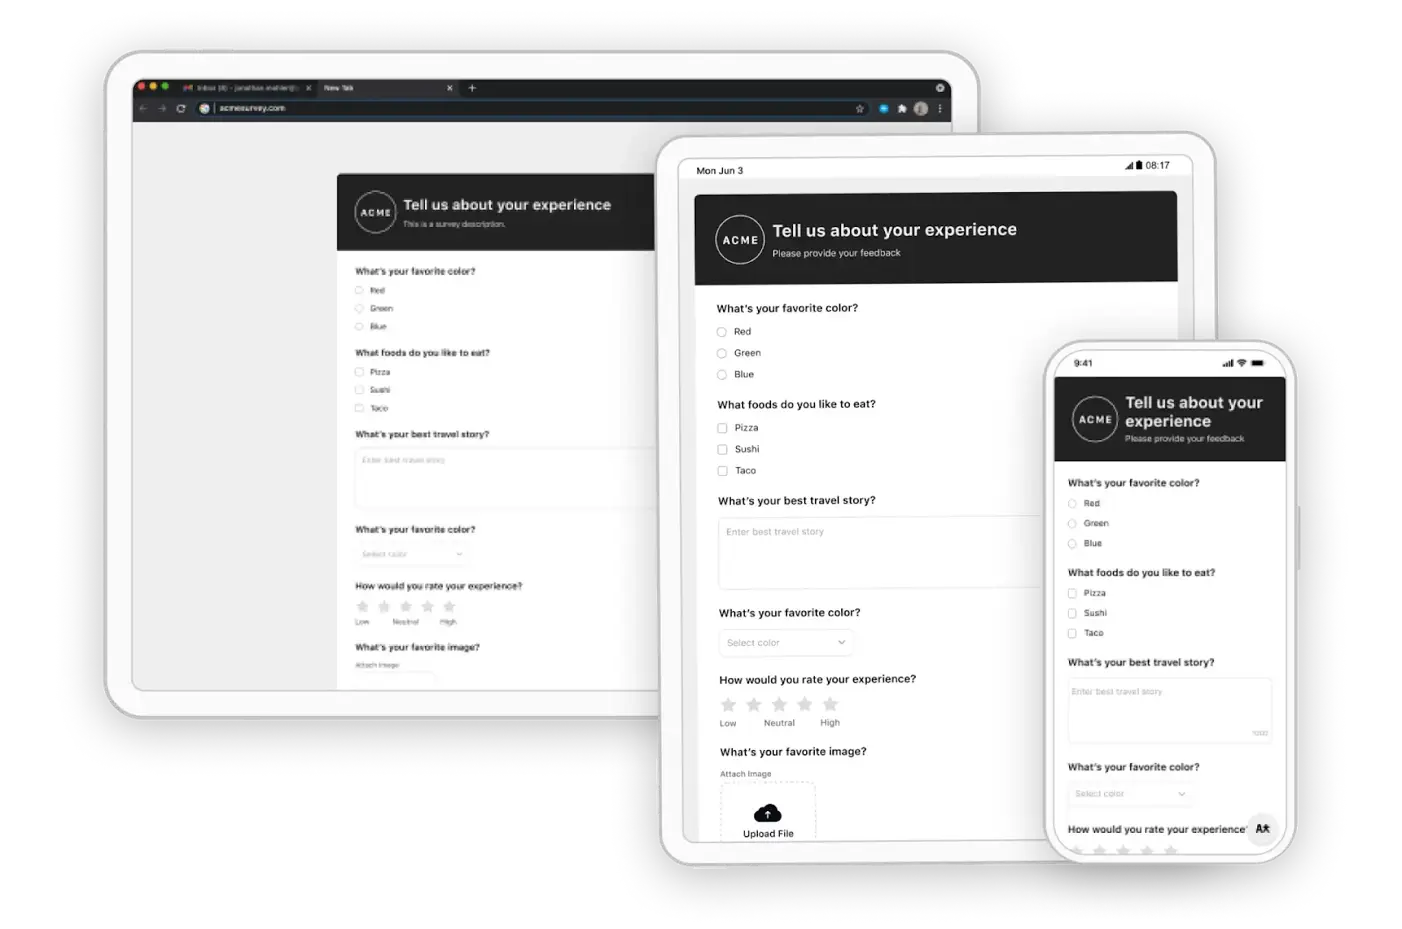
Build mobile-optimized and channel-specific surveys to receive more customer responses.
Pick from standalone, AI-powered, or prompt-based surveys. Sprinklr will automatically predict sentiment, CSAT, and escalation potential scores in every conversation.
Once done, convert survey results into beautiful reports and share them with stakeholders. All on one unified platform.
Top 12 metrics to measure customer experience in real-time
Let’s explore the key metrics that help you measure customer experience in real time and understand the value behind each one:
Real-time sentiment and predictive analytics
This category harnesses the power of AI to analyze live customer sentiment, detect hidden issues, and anticipate risks, all before they impact business outcomes.
Sentiment and emotion scores
Sentiment and emotion scores analyze conversations, reviews, and support interactions to determine how customers feel at specific moments, whether frustrated, delighted, or confused.
How it helps: Capturing sentiment scores in real time helps your team address dissatisfaction immediately and double down on what’s working, rather than waiting for negative patterns to appear in survey results.
Imagine a sudden rise in negative sentiment detected across live chat sessions during a product rollout.
Support leads receive an instant alert and intervene proactively, which reduces escalations and protects brand trust.
If 2,000 interactions yield a cumulative sentiment value of -500 (where negative values indicate frustration), the real-time sentiment score is -500 ÷ 2,000 = -0.25.
Your teams can act on this drop immediately to address root causes as they surface.
AI-based anomaly detection
AI-based anomaly detection continuously scans customer data to flag sudden, unexpected changes, such as complaint spikes, abrupt satisfaction drops, or unusual engagement patterns.
How it helps: Monitoring anomalies as they occur lets you investigate and resolve potential issues before they affect a broader customer base.
Say, your system notices an abnormal increase in failed transactions within minutes. Instead of waiting for complaints to accumulate, IT and customer care can immediately step in, minimizing service disruption.
Suppose the average daily complaints are 40 with a standard deviation of 8. If suddenly 80 complaints come in, the anomaly score is (80 – 40) ÷ 8 = 5, a clear sign to investigate and act on the issue in real time.
You should invest in customer experience measurement tools that incorporate as many of the metrics listed above as possible. When gathering and analyzing CX data, you should look to cast as wide a net as possible.
Real-time traditional feedback scores
Real-time feedback scores are immediate signals that you can gather directly from customers during or right after key touchpoints. This helps detect shifts in sentiment and resolve issues as they happen. They include:
Net promoters score (NPS)
NPS measures how likely customers are to recommend your brand to others, capturing shifts in overall brand sentiment and advocacy as they happen.
How it helps: Tracking NPS in real time helps you instantly identify changes in customer loyalty, enabling immediate action if sentiment drops after a key interaction or campaign.
For instance, immediately after a support chat, customers rate how likely they are to recommend your brand.
This real-time input helps your team spot and respond to negative experiences before they impact broader brand perception.
Suppose you surveyed 200 customers after digital support chats. If 120 are promoters, 50 are passives (scores 7–8), and 30 are detractors, your NPS would be (120/200 * 100) – (30/200 * 100) = 60% – 15% = 45. This real-time NPS highlights customer advocacy based on their most recent experience.
Customer satisfaction score (CSAT)
CSAT gauges your customers' satisfaction with a specific product, service, or interaction, delivering a current, moment-by-moment pulse on experience quality.
How it helps: Measuring CSAT in real-time helps you quickly detect and resolve issues, preventing minor problems from escalating and improving satisfaction on the spot.
For example, a customer rates their satisfaction with your checkout right after completing an online transaction.
This real-time CSAT score alerts your team to immediate friction, enabling proactive fixes before dissatisfaction spreads.
If 180 out of 220 customers rate their experience as “satisfied” or “very satisfied” after a self-service portal interaction, your CSAT is (180/220) × 100 = 81.8%. This tells you, in the moment, how well your platform is meeting user expectations.
Pro tip: Use Sprinklr’s customer satisfaction software to combine AI-powered CSAT prediction with automated, omnichannel surveys. You can analyze real-time conversations for intent, sentiment, emotion, and response time — all in one platform.
The result is a unified view of survey results and feedback from multiple channels into a single dashboard. You can use it to glean actionable insights and improve agent performance and customer experience.

Customer effort score (CES)
CES tracks how easy it was for customers to achieve their goal, such as resolving an issue or making a purchase, right after the interaction.
How it helps: Real-time CES data reveals friction points as they occur, allowing teams to streamline journeys and improve experience without waiting for lagging survey results.
For example, after finishing a digital onboarding process, a customer rates the effort required.
A low real-time CES score signals a need for immediate improvement, helping your team address obstacles before they affect more customers.
If 150 users rate their effort on a 1 – 7 scale after using your digital onboarding process, and the total score is 900, your CES is 900 ÷ 150 = 6.0.
A higher CES indicates customers find your process simple and stress-free.
Service performance metrics
Service performance metrics capture how efficiently and effectively customer support teams handle inquiries, requests, and issues at the moment.
First contact resolution (FCR)
FCR measures the percentage of customer issues resolved during the first interaction, without requiring follow-up.
How it helps: Tracking FCR as it happens helps you spot emerging support challenges, identify training needs, and keep resolution rates high. All these directly impact customer confidence and loyalty.
Imagine a scenario where a customer’s technical issue is solved in their very first live chat session. Real-time tracking of FCR helps your managers recognize which teams or shifts consistently resolve queries upfront, allowing best practices to be shared across the organization.
If your support team handles 500 inquiries daily and 380 are resolved at the initial touchpoint, your FCR stands at (380/500) × 100 = 76%.
This real-time view flags sudden drops, so you can intervene before customer satisfaction declines.
Queue and wait times
Average hold time and wait times measure how long customers wait to connect with support via phone, chat, or email.
How it helps: Monitoring this metric in real time is crucial for managing spikes in demand, optimizing staffing levels, and ensuring customers aren’t left waiting during critical moments.
During a peak product launch, if real-time dashboards show wait times rising above your service standards, you can instantly deploy additional agents or reroute inquiries to prevent frustration and maintain a positive brand image.
Suppose 1,000 customers spend a combined total of 5,000 minutes in the queue on a busy day. Your average wait time is 5,000 ÷ 1,000 = 5 minutes per customer.
Noticing an upward trend at midday indicates the need for more timely responses before more negative feedback accumulates.
Resolution time per channel
Average resolution time tracks the average time to resolve customer issues on each support channel, such as phone, chat, or email.
How it helps: Real-time monitoring provides instant visibility into which channels are lagging, allowing for quick resource reallocation and workflow adjustments to ensure consistent service quality across all touchpoints.
Suppose your live chat channel usually resolves tickets within 10 minutes, but today, resolution time suddenly climbs.
Live metrics help you pinpoint technical glitches or increased complexity immediately, so corrective action can be taken before customer frustration escalates.
If your email support team resolves 80 cases daily with a combined resolution time of 1,600 minutes, the average resolution time per case is 1,600 ÷ 80 = 20 minutes.
Real-time analysis enables you to fix performance issues as they occur, instead of reacting afterward.
Digital journey metrics
Digital journey metrics show how customers interact with your digital properties as experiences unfold.
Digital engagement
Digital customer engagement tracks real-time actions such as clicks, scroll depth, active time, and navigation patterns on websites or apps.
How it helps: Analyzing this data instantly reveals what captures your customers’ attention or where they lose interest. This metric enables your teams to refine interfaces and content in response to emerging patterns.
A spike in page scroll depth during a flash sale indicates visitors are highly engaged with new product information.
Live monitoring enables the marketing team to double down on what’s working or tweak CTAs if engagement lags.
If users collectively generate 15,000 key actions (clicks, scrolls, interactions) across 2,500 sessions daily, the engagement score is 15,000 ÷ 2,500 = 6 actions per session.
Real-time insight allows immediate adjustment of campaign or layout strategy.
Journey completion rate
Journey completion rate reflects the percentage of your users who successfully reach a key outcome, such as checking out, registering, or completing onboarding, after starting a process online.
How it helps: Tracking this metric live helps spot where users abandon flows, allowing quick interventions to increase completion.
If data shows a sudden dip in account sign-ups mid-campaign, your team can immediately investigate and resolve technical errors or confusing instructions, protecting conversion rates before revenue is lost.
Suppose 3,000 customers begin a subscription process and 2,100 finish it. Your journey completion rate is (2,100 ÷ 3,000) × 100 = 70%.
Tracking these live highlights any drop-off points, so teams can address them before they impact business outcomes.
Session drop-off rate
Session drop-off rate measures the proportion of users who exit a process or abandon a session before reaching the intended goal.
How it helps: Capturing this data in real time reveals friction points as they occur, enabling design or support teams to respond rapidly.
An abrupt increase in drop-offs during payment may signal a checkout bug. With live analytics, your IT can immediately step in and minimize lost transactions and customer frustration.
If 800 of 4,000 website sessions end before checkout, the drop-off rate is (800 ÷ 4,000) × 100 = 20%.
Real-time trends empower leaders to deploy fixes or targeted messaging before the issue escalates.
Channel switch rate
Channel switch rate captures how often your customers move between different channels, such as web to chat or app to phone, during a single support journey.
How it helps: Real-time monitoring of this metric helps organizations identify pain points or confusion that drive users to seek alternative help routes.
A sudden surge in customers switching from self-service to live chat could signal unclear FAQs. Quick recognition allows you to update resources or direct customers more efficiently before the switch rate becomes a larger support cost.
If 350 out of 2,000 customer journeys involve a switch from web to phone support, the channel switch rate is (350 ÷ 2,000) × 100 = 17.5%.
Noticing spikes in this metric should point your operations teams to troubleshoot the root cause immediately.
Where to find signals for customer experience?
You’ve already learned about the 12 metrics that can directly inform you about your customer’s experience with your brand at different touchpoints.
But where else do you find customer signals to measure? This list includes both direct and indirect touchpoints where customers express their satisfaction, frustration, needs, or behavior.
Please note that these signals can be explicit (surveys) or implicit (social media behavior, chat tone, etc.). Here you go:
Direct signals (structured, explicit)
- Customer support tickets – Volume, sentiment, resolution time
- App and website feedback forms – Feature requests, complaints, bug reports
- In-app or on-site polls – Quick pulse checks during digital journeys
- CRM – Case reopen rates, support volumes, lead-to-customer conversion, campaign engagement, sentiment tags, and churn-risk flags
🫡Good to know: Sprinklr Service and its unified customer experience management solution integrates with all the direct signals mentioned. So you can measure CX from these sources without point solutions. Find the tools you can integrate with Sprinklr here.
Indirect signals (unstructured, implicit)
- Social media posts and comments – Praise, rants, reviews, mentions, sentiment
- Online reviews (G2, Trustpilot, Play Store) – Authentic feedback from real users
- Customer call transcripts and chat logs – Language cues, tone, repeated pain points
- Browsing behavior – Clicks, drop-offs, repeat visits, rage clicks
- Product usage patterns – Features adopted, usage frequency, churn indicators
- Search queries on help centers – What users struggle to understand or do
- Social listening – Pull trends from public platforms
- Marketplaces and app stores – Sentiment across competitors
- Industry benchmarks – Compare customer sentiment vs. competitors
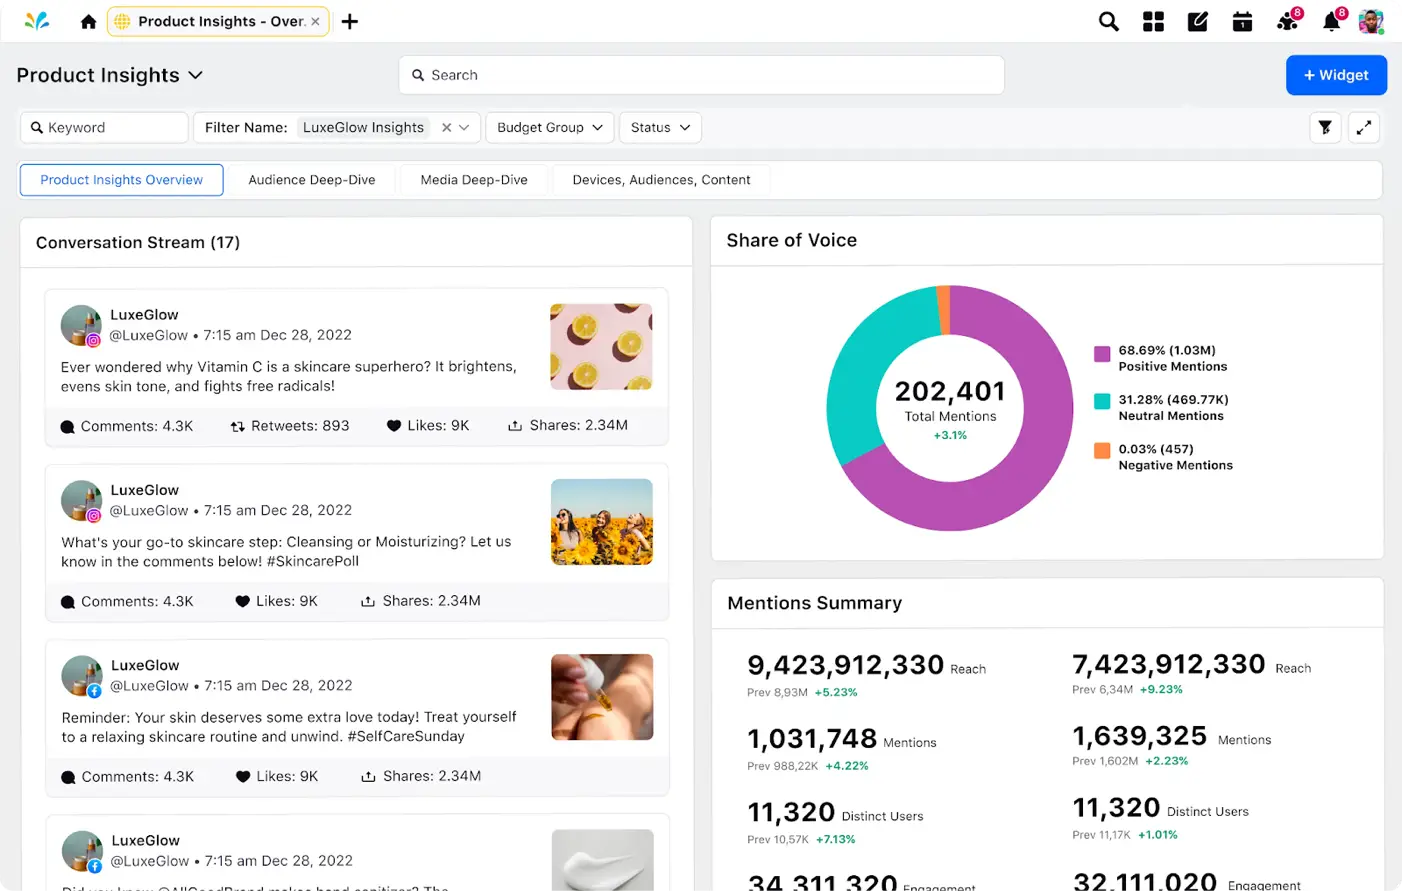
🫡Good to know: You can track, measure, and even benchmark unstructured and unsolicited customer feedback across 30+ channels, including all the indirect ones mentioned above, on Sprinklr Insights — a consumer intelligence platform.
Operational signals
- Delivery/logistics metrics – Delays, fulfillment accuracy
- Payment failures or abandonment rates
- Return/refund rates
🫡Good to know: Sprinklr’s Unified-CXM platform [Service + Social Listening + Complaints Management modules] can integrate data from operations and socials into one view.
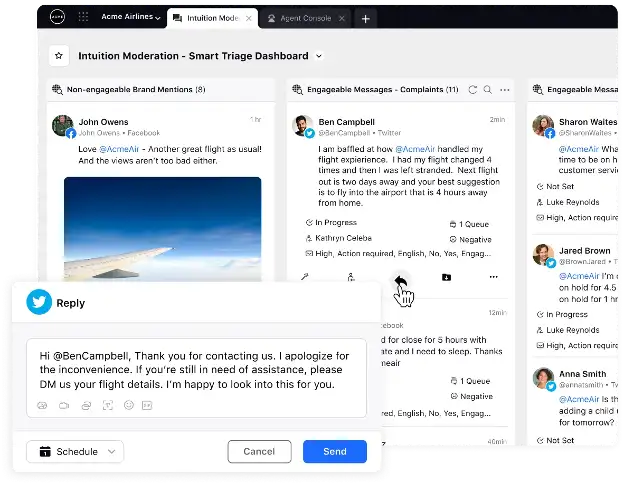
Your marketing, service, and logistics teams can, therefore, act on delivery issues tracked via customer interactions (e.g., delay complaints on social or chat) 👇
CX Signals are as valuable as the actions you take. Turn signals into action on Sprinklr’s Unified-CXM platform
Plenty of vendors offer tools that deliver real-time signals to measure customer experience. The challenge is that, even with real-time data, few enterprises have the capacity or scale to sift through endless metrics and extract insights that drive real action. Fewer integrate the data to prevent silos.
But Sprinklr is different.
Its Unified-CXM platform integrates customer service, social, marketing, and consumer intelligence into one, unified platform.
Throw native AI to the mix, and you get unparalleled access to consented customer data in one place that you can instantly analyze using AI and act on the same platform.
See how intelligent automation can turn overwhelming data into smarter business outcomes. Book a free demo and experience the difference.
Frequently Asked Questions
Real-time signals are immediate data points, like live feedback, sentiment shifts, chat activity, or website actions, that show how customers feel and behave as they interact with your brand. These signals help you respond fast and improve the experience on the spot.
AI analyzes feedback, conversations, and behavior across channels as they happen. It detects patterns, emotions, and trends that people might miss, turning raw data into clear, actionable insights for better decision-making.
Track feedback, engagement, and resolution rates from every touchpoint: phone, chat, email, web, and social media. Use unified analytics to compare performance, spot gaps, and keep the customer experience consistent everywhere.
Start by mapping key journeys and touchpoints. Use tools that gather and analyze signals instantly. Set up dashboards for live monitoring and act on insights fast. Constantly review and refine your approach to stay ahead of customer needs.
Choose platforms that handle large volumes of data and support multiple languages and regions. Standardize metrics, integrate with local systems, and use AI to unify and analyze signals from every market for a complete, global view.


